Victory-native: Get y-Value relative to intersection of line on touch position
I have a chart with zoom and cursor container.
I would like to get the y-value when 'onCursorChange' is called.
the problem is that the chart is timeScale on x-axis, and I cant get the exactly Y value.
//Code to get the point

  handleCursorChange(value) {
    console.log('VALUEEEE', value)
    this.setState({
      activePoint: this.findClosestPointSorted(data.data, value)
    });
  }

  findClosestPointSorted (data, value) {

    if (value === null) return null;
    const start = first(data).x;
    const range = (last(data).x - start);
    const index = Math.round((value - start)/range * (data.length - 1));

    return data[index];
  }

//Render function
render(){
 return (
      <View>
          <View style={styles.container}>
            <VictoryChart
              width={winSize.width}
              theme={VictoryTheme.material}
              scale={{x: "time", y: "linear"}}
              containerComponent={
                <ChartContainer
                  dimension="x"
                  cursorDimension="x"
                  zoomDomain={{y: [min, max]}}
                  zoomDimension="x"
                  onCursorChange={(value) => this.handleCursorChange(value)}
                  cursorLabel={cursor => `${new Date(activePoint.x)}, ${Math.round(activePoint.y)}`}
                />
              }>
              <VictoryLine
                interpolation="basis"
                style={{
                  data: { stroke: "#c43a31" },
                  parent: { border: "1px solid #ccc"}
                }} data={data.data} />
                {point}
            </VictoryChart>
          </View>
      </View>
    );
}
And when I touch somewhere on the graph, thats what it is displaying
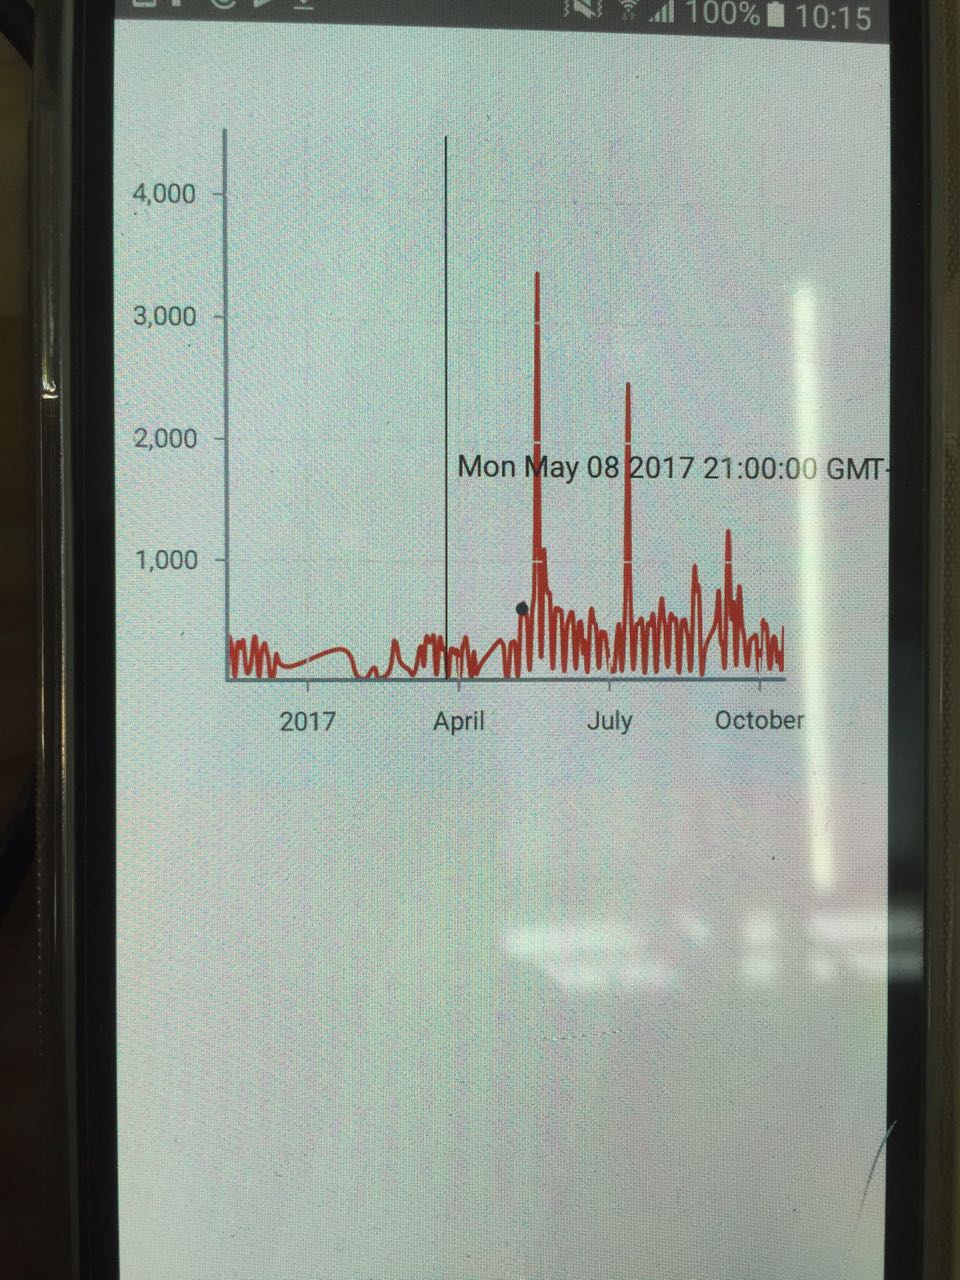
Any idea to get to the solution?
Thanks in advance
 vlimag
All 14 comments
@vlimag if I'm understanding your issue correctly, I think you are having some trouble finding the dearest data point that corresponds to your cursor. The best way to do this would be to use VictoryVoronoiContainer. You can either use createContainer to make a hybrid cursor + voronoi container, or you can make a custom label component for VictoryVoronoiContainer that also renders an indicator line.
If you want to keep using the code you have, I would focus on your findClosestPointSorted method. Your implementation looks like it relies on evenly spaced data, which may be why you are getting an odd result.
 boygirl
on 8 Aug 2018
boygirl
on 8 Aug 2018
Actually that's not the issue.
I need to find the intersection (The Y value corresponding to the red line).
What I've done so far:
I've created a path with react-native-svg, and I get the intersection with operations on the path, and the X value clicked.
It works just fine if the chart has no zoom.
If Zoom occurs, it loses the precision.
Is there any better solution for this issue?
vlimag
on 8 Aug 2018
@vlimag
Is the issue that you need your active point to also update when your zoom level changes? onCursorChange is not called when you zoom, so it wouldn't update
A gif of this interaction would really help me understand what's going on.
boygirl
on 9 Aug 2018
@vlimag it also occurs to me that you might get find the Selection helpers useful.
Use Selection.getSVGEventCoordinates(evt) to get the coordinates that correspond to your touch event
You can then use the scale of your chart (provided to your container via props) to convert from svg coordinates to data coordinates:
{
   x: scale.x.invert(x),
   y: scale.y.invert(y)
};
@boygirl I need to get the coordinates relative to the intersection of the touch event with the line.
I am doing that, but when the zoom occurs, it loses precision.
thank you for your support.
vlimag
on 9 Aug 2018
@vlimag thanks for the video, that makes the issue so much easier to understand! The fact that your cursor and cursor label seem to have correct values after zooming, but not your custom point make me think that issue your seeing might be related to how you are translating between data value and position on the chart for rendering your point. Because you have zoomed, the domain has changed, so the scale you're using to translate between data x value and the svg x coordinate needs to be updated to use the new domain. Can you show the code that controls the component you're rendering in {point}?
boygirl
on 10 Aug 2018
Sure..
import React, {Component} from 'react';
import {
  Platform,
  StyleSheet,
  Text,
  View,
  ScrollView,
  Dimensions
} from 'react-native'
import {
  VictoryBar,
  VictoryChart,
  VictoryLine,
  VictoryTheme,
  VictoryZoomContainer,
  VictoryCursorContainer,
  VictoryLabel,
  VictoryScatter,
  createContainer
} from "victory-native"
const ChartContainer = createContainer('cursor', 'zoom')
import * as d3 from 'd3'
import * as scale from 'd3-scale'
import * as shape from 'd3-shape'
import * as array from 'd3-array'
import data from './data'
var path = require("svg-path-properties")

import {G,Line} from "react-native-svg"
import _ from 'lodash'
const { range, first, last } = _
var moment = require('moment');

let winSize = Dimensions.get('window')

type Props = {};
export default class App extends Component<Props> {

  constructor() {
    super();
    this.state = {
      activePoint: null,
      width: 0,
      height: 0,
    }
    this.yMin
    this.yMax
  }

  componentWillMount(){
    let {yMin, yMax} = this.getBounds()
    yMax = Math.floor(yMax)
    yMin = Math.floor(yMin)
    this.yMin = yMin
    this.yMax = yMax
  }

  getBounds(){
    let yMin = 10000000000000
    let yMax = -10000000000000
    data.data.map((data)=>{
      if(data.y < yMin) yMin = data.y
      if(data.y > yMax) yMax = data.y
    })
    return {yMin, yMax}
  }

  pressOut(paths, chartLine, x2, y2, func){
    var pos = 0
    if(chartLine){
        var properties = path.svgPathProperties(paths.path);
        var length = properties.getTotalLength();
        var start = 0
        var end = length
        var target = (start + end) / 2

        var count = 0
        // Walk along the path using binary search
        // to locate the point with the supplied x value

          while ((target >= start && target <= length) && count < 300) {
          pos = properties.getPointAtLength(parseInt(target))
          // use a threshold instead of strict equality
          // to handle javascript floating point precision
          if (Math.abs(pos.x - chartLine.x) < 1) {
          // console.log('DEBUG 10', count++)
            pos.y = y2(pos.y).toFixed(2).toString()
            pos.x = x2(pos.x)
            return pos
          }
          else if (pos.x > chartLine.x) {
            end = target
          }
          else {
            start = target
          }
          target = (start + end) / 2
          count++
        }
        pos.y = pos.y ? parseFloat(y2(pos.y)) : null
        pos.x = x2(pos.x)

        return pos
    }
    if(func) return 0
  }

  handleCursorChange(value, props) {

    const mappedData = data.data.filter((dt)=> (dt.x >= props.domain.x[0] && dt.x <= props.domain.x[1])).map((item, index) => ({
            y: item.y,
            x: item.x,
        }))
    //invert range to support svg coordinate system
    const yScale = d3.scaleLinear
    const xScale = d3.scaleTime

    const yValues = mappedData.map(item => item.y)
    const xValues = mappedData.map(item => item.x)

    const yExtent = array.extent([ ...yValues, this.yMin, this.yMax ])
    const xExtent = array.extent([ ...xValues ])
    const y = yScale()
        .domain(yExtent)
        .range([ this.state.height - 0, 0 ])
    const y2 = yScale()
        .domain([ this.state.height - 0, 0 ])
        .range(yExtent)
    const x = xScale()
        .domain(xExtent)
        .range([ props.children[0].props.padding.left, props.width - props.children[0].props.padding.right ])

    const x2 = xScale()
        .domain([ props.children[0].props.padding.left, props.width - props.children[0].props.padding.right ])
        .range(xExtent)
    const paths = this.createPaths({
        data: mappedData,
        x,
        y,
    })
    const obj = {
      x: value ? props.scale.x(value.getTime()) : 0,
      y: 0
    }
    var pos = this.pressOut(paths, obj, x2, y2, true)

    this.setState({
      activePoint: {x: pos.x, y: parseFloat(pos.y)}
    })
  }

  createPaths({ data, x, y }) {

        const line = shape.line()
            .x((d) => x(d.x))
            .y(d => y(d.y))
            .defined(item => typeof item.y === 'number')
            .curve(d3.curveBasis)
            (data)

        return {
            path: line,
            line,
        }
    }

  formatLabel(){
    let { activePoint } = this.state
    let str = ''
    let date = moment(activePoint.x).format('DD/MM/YYYY') + ' - ' + activePoint.y
    str = str + new Date(activePoint.x)
    return date
  }

  _onLayout(event) {
    const { nativeEvent: { layout: { height, width } } } = event
    this.setState({ height, width })
  }

  render() {
    const { activePoint } = this.state;
    const point = activePoint ?
      <VictoryScatter data={[activePoint]} style={{data: {size: 100} }}/>
      : null;
    return (
      <View>
        <View style={styles.container} onLayout={ event => this._onLayout(event) }>
          <VictoryChart
            width={winSize.width}
            theme={VictoryTheme.material}
            scale={{x: "time", y: "linear"}}
            containerComponent={
              <ChartContainer
                dimension="x"
                cursorDimension="x"
                zoomDomain={{y: [this.yMin, this.yMax]}}
                zoomDimension="x"
                onCursorChange={(value, props)=>this.handleCursorChange(value, props)}
                cursorLabel={() => this.formatLabel()}
              />
            }>
            <VictoryLine
              interpolation="basis"
              style={{
                data: { stroke: "#406a80" },
                parent: { border: "1px solid #ccc"}
              }} data={data.data} />
              {point}
          </VictoryChart>
        </View>
      </View>
    )
  }
}

const styles = StyleSheet.create({
  scrollView:{
    height:400,
    width: winSize.width
  },
  container: {
    justifyContent: "center",
    alignItems: "center",
    backgroundColor: "#f5fcff",
    width: winSize.width
  },
  welcome: {
    fontSize: 20,
    textAlign: 'center',
    margin: 10,
  }
})
If you have any ideas please let me know heh
vlimag
on 10 Aug 2018
Actually, the code above only works fine with DeveloperTools working on a better machine.
Is there a way to get this value (the y coordinate) without having to draw the line every time?
vlimag
on 10 Aug 2018
Hi guys, sorry if I step in, but it seems we are talking about the same thing. Do you know a way to get the Y interpolated value? I am not interested in getting the nearest, but just the Y interpolated value provided X.
 edo1493
on 18 Aug 2018
edo1493
on 18 Aug 2018
Sure..
import React, {Component} from 'react';
import {
  Platform,
  StyleSheet,
  Text,
  View,
  ScrollView,
  Dimensions
} from 'react-native'
import {
  VictoryBar,
  VictoryChart,
  VictoryLine,
  VictoryTheme,
  VictoryZoomContainer,
  VictoryCursorContainer,
  VictoryLabel,
  VictoryScatter,
  createContainer
} from "victory-native"
const ChartContainer = createContainer('cursor', 'zoom')
import * as d3 from 'd3'
import * as scale from 'd3-scale'
import * as shape from 'd3-shape'
import * as array from 'd3-array'
import data from './data'
var path = require("svg-path-properties")

import {G,Line} from "react-native-svg"
import _ from 'lodash'
const { range, first, last } = _
var moment = require('moment');

let winSize = Dimensions.get('window')

type Props = {};
export default class App extends Component<Props> {

  constructor() {
    super();
    this.state = {
      activePoint: null,
      width: 0,
      height: 0,
    }
    this.yMin
    this.yMax
  }

  componentWillMount(){
    let {yMin, yMax} = this.getBounds()
    yMax = Math.floor(yMax)
    yMin = Math.floor(yMin)
    this.yMin = yMin
    this.yMax = yMax
  }

  getBounds(){
    let yMin = 10000000000000
    let yMax = -10000000000000
    data.data.map((data)=>{
      if(data.y < yMin) yMin = data.y
      if(data.y > yMax) yMax = data.y
    })
    return {yMin, yMax}
  }

  pressOut(paths, chartLine, x2, y2, func){
    var pos = 0
    if(chartLine){
        var properties = path.svgPathProperties(paths.path);
        var length = properties.getTotalLength();
        var start = 0
        var end = length
        var target = (start + end) / 2

        var count = 0
        // Walk along the path using binary search
        // to locate the point with the supplied x value

          while ((target >= start && target <= length) && count < 300) {
          pos = properties.getPointAtLength(parseInt(target))
          // use a threshold instead of strict equality
          // to handle javascript floating point precision
          if (Math.abs(pos.x - chartLine.x) < 1) {
          // console.log('DEBUG 10', count++)
            pos.y = y2(pos.y).toFixed(2).toString()
            pos.x = x2(pos.x)
            return pos
          }
          else if (pos.x > chartLine.x) {
            end = target
          }
          else {
            start = target
          }
          target = (start + end) / 2
          count++
        }
        pos.y = pos.y ? parseFloat(y2(pos.y)) : null
        pos.x = x2(pos.x)

        return pos
    }
    if(func) return 0
  }

  handleCursorChange(value, props) {

    const mappedData = data.data.filter((dt)=> (dt.x >= props.domain.x[0] && dt.x <= props.domain.x[1])).map((item, index) => ({
            y: item.y,
            x: item.x,
        }))
    //invert range to support svg coordinate system
    const yScale = d3.scaleLinear
    const xScale = d3.scaleTime

    const yValues = mappedData.map(item => item.y)
    const xValues = mappedData.map(item => item.x)

    const yExtent = array.extent([ ...yValues, this.yMin, this.yMax ])
    const xExtent = array.extent([ ...xValues ])
    const y = yScale()
        .domain(yExtent)
        .range([ this.state.height - 0, 0 ])
    const y2 = yScale()
        .domain([ this.state.height - 0, 0 ])
        .range(yExtent)
    const x = xScale()
        .domain(xExtent)
        .range([ props.children[0].props.padding.left, props.width - props.children[0].props.padding.right ])

    const x2 = xScale()
        .domain([ props.children[0].props.padding.left, props.width - props.children[0].props.padding.right ])
        .range(xExtent)
    const paths = this.createPaths({
        data: mappedData,
        x,
        y,
    })
    const obj = {
      x: value ? props.scale.x(value.getTime()) : 0,
      y: 0
    }
    var pos = this.pressOut(paths, obj, x2, y2, true)

    this.setState({
      activePoint: {x: pos.x, y: parseFloat(pos.y)}
    })
  }

  createPaths({ data, x, y }) {

        const line = shape.line()
            .x((d) => x(d.x))
            .y(d => y(d.y))
            .defined(item => typeof item.y === 'number')
            .curve(d3.curveBasis)
            (data)

        return {
            path: line,
            line,
        }
    }

  formatLabel(){
    let { activePoint } = this.state
    let str = ''
    let date = moment(activePoint.x).format('DD/MM/YYYY') + ' - ' + activePoint.y
    str = str + new Date(activePoint.x)
    return date
  }

  _onLayout(event) {
    const { nativeEvent: { layout: { height, width } } } = event
    this.setState({ height, width })
  }

  render() {
    const { activePoint } = this.state;
    const point = activePoint ?
      <VictoryScatter data={[activePoint]} style={{data: {size: 100} }}/>
      : null;
    return (
      <View>
        <View style={styles.container} onLayout={ event => this._onLayout(event) }>
          <VictoryChart
            width={winSize.width}
            theme={VictoryTheme.material}
            scale={{x: "time", y: "linear"}}
            containerComponent={
              <ChartContainer
                dimension="x"
                cursorDimension="x"
                zoomDomain={{y: [this.yMin, this.yMax]}}
                zoomDimension="x"
                onCursorChange={(value, props)=>this.handleCursorChange(value, props)}
                cursorLabel={() => this.formatLabel()}
              />
            }>
            <VictoryLine
              interpolation="basis"
              style={{
                data: { stroke: "#406a80" },
                parent: { border: "1px solid #ccc"}
              }} data={data.data} />
              {point}
          </VictoryChart>
        </View>
      </View>
    )
  }
}

const styles = StyleSheet.create({
  scrollView:{
    height:400,
    width: winSize.width
  },
  container: {
    justifyContent: "center",
    alignItems: "center",
    backgroundColor: "#f5fcff",
    width: winSize.width
  },
  welcome: {
    fontSize: 20,
    textAlign: 'center',
    margin: 10,
  }
})
If you have any ideas please let me know heh
can you tell what is your Data. Can You share it
 rajatgng
on 16 Jun 2019
rajatgng
on 16 Jun 2019
Sure..
import React, {Component} from 'react';
import {
  Platform,
  StyleSheet,
  Text,
  View,
  ScrollView,
  Dimensions
} from 'react-native'
import {
  VictoryBar,
  VictoryChart,
  VictoryLine,
  VictoryTheme,
  VictoryZoomContainer,
  VictoryCursorContainer,
  VictoryLabel,
  VictoryScatter,
  createContainer
} from "victory-native"
const ChartContainer = createContainer('cursor', 'zoom')
import * as d3 from 'd3'
import * as scale from 'd3-scale'
import * as shape from 'd3-shape'
import * as array from 'd3-array'
import data from './data'
var path = require("svg-path-properties")

import {G,Line} from "react-native-svg"
import _ from 'lodash'
const { range, first, last } = _
var moment = require('moment');

let winSize = Dimensions.get('window')

type Props = {};
export default class App extends Component<Props> {

  constructor() {
    super();
    this.state = {
      activePoint: null,
      width: 0,
      height: 0,
    }
    this.yMin
    this.yMax
  }

  componentWillMount(){
    let {yMin, yMax} = this.getBounds()
    yMax = Math.floor(yMax)
    yMin = Math.floor(yMin)
    this.yMin = yMin
    this.yMax = yMax
  }

  getBounds(){
    let yMin = 10000000000000
    let yMax = -10000000000000
    data.data.map((data)=>{
      if(data.y < yMin) yMin = data.y
      if(data.y > yMax) yMax = data.y
    })
    return {yMin, yMax}
  }

  pressOut(paths, chartLine, x2, y2, func){
    var pos = 0
    if(chartLine){
        var properties = path.svgPathProperties(paths.path);
        var length = properties.getTotalLength();
        var start = 0
        var end = length
        var target = (start + end) / 2

        var count = 0
        // Walk along the path using binary search
        // to locate the point with the supplied x value

          while ((target >= start && target <= length) && count < 300) {
          pos = properties.getPointAtLength(parseInt(target))
          // use a threshold instead of strict equality
          // to handle javascript floating point precision
          if (Math.abs(pos.x - chartLine.x) < 1) {
          // console.log('DEBUG 10', count++)
            pos.y = y2(pos.y).toFixed(2).toString()
            pos.x = x2(pos.x)
            return pos
          }
          else if (pos.x > chartLine.x) {
            end = target
          }
          else {
            start = target
          }
          target = (start + end) / 2
          count++
        }
        pos.y = pos.y ? parseFloat(y2(pos.y)) : null
        pos.x = x2(pos.x)

        return pos
    }
    if(func) return 0
  }

  handleCursorChange(value, props) {

    const mappedData = data.data.filter((dt)=> (dt.x >= props.domain.x[0] && dt.x <= props.domain.x[1])).map((item, index) => ({
            y: item.y,
            x: item.x,
        }))
    //invert range to support svg coordinate system
    const yScale = d3.scaleLinear
    const xScale = d3.scaleTime

    const yValues = mappedData.map(item => item.y)
    const xValues = mappedData.map(item => item.x)

    const yExtent = array.extent([ ...yValues, this.yMin, this.yMax ])
    const xExtent = array.extent([ ...xValues ])
    const y = yScale()
        .domain(yExtent)
        .range([ this.state.height - 0, 0 ])
    const y2 = yScale()
        .domain([ this.state.height - 0, 0 ])
        .range(yExtent)
    const x = xScale()
        .domain(xExtent)
        .range([ props.children[0].props.padding.left, props.width - props.children[0].props.padding.right ])

    const x2 = xScale()
        .domain([ props.children[0].props.padding.left, props.width - props.children[0].props.padding.right ])
        .range(xExtent)
    const paths = this.createPaths({
        data: mappedData,
        x,
        y,
    })
    const obj = {
      x: value ? props.scale.x(value.getTime()) : 0,
      y: 0
    }
    var pos = this.pressOut(paths, obj, x2, y2, true)

    this.setState({
      activePoint: {x: pos.x, y: parseFloat(pos.y)}
    })
  }

  createPaths({ data, x, y }) {

        const line = shape.line()
            .x((d) => x(d.x))
            .y(d => y(d.y))
            .defined(item => typeof item.y === 'number')
            .curve(d3.curveBasis)
            (data)

        return {
            path: line,
            line,
        }
    }

  formatLabel(){
    let { activePoint } = this.state
    let str = ''
    let date = moment(activePoint.x).format('DD/MM/YYYY') + ' - ' + activePoint.y
    str = str + new Date(activePoint.x)
    return date
  }

  _onLayout(event) {
    const { nativeEvent: { layout: { height, width } } } = event
    this.setState({ height, width })
  }

  render() {
    const { activePoint } = this.state;
    const point = activePoint ?
      <VictoryScatter data={[activePoint]} style={{data: {size: 100} }}/>
      : null;
    return (
      <View>
        <View style={styles.container} onLayout={ event => this._onLayout(event) }>
          <VictoryChart
            width={winSize.width}
            theme={VictoryTheme.material}
            scale={{x: "time", y: "linear"}}
            containerComponent={
              <ChartContainer
                dimension="x"
                cursorDimension="x"
                zoomDomain={{y: [this.yMin, this.yMax]}}
                zoomDimension="x"
                onCursorChange={(value, props)=>this.handleCursorChange(value, props)}
                cursorLabel={() => this.formatLabel()}
              />
            }>
            <VictoryLine
              interpolation="basis"
              style={{
                data: { stroke: "#406a80" },
                parent: { border: "1px solid #ccc"}
              }} data={data.data} />
              {point}
          </VictoryChart>
        </View>
      </View>
    )
  }
}

const styles = StyleSheet.create({
  scrollView:{
    height:400,
    width: winSize.width
  },
  container: {
    justifyContent: "center",
    alignItems: "center",
    backgroundColor: "#f5fcff",
    width: winSize.width
  },
  welcome: {
    fontSize: 20,
    textAlign: 'center',
    margin: 10,
  }
})
If you have any ideas please let me know heh
@vlimag Can you the format of the data or data itself. for the purpose to see how it looks like.
rajatgng
on 16 Jun 2019
@vlimag have you managed to make it to work? I need to implement same functionality as you are showing on your video and I am curious how you achieved the final result with zoom and cursor container
 t4dek
on 29 Sep 2020
t4dek
on 29 Sep 2020
Hey there @boygirl :)
I am trying to achieve functionality which is described in this thread I would say. Essentially it is 'Apple Stocks' app functionality. Here I have a small video recording showing what I want to achieve with library.
Side note here is that I am using victory-native :)
So I need a tooltip which will be enabled by user touching any area on chart but the tooltip itself will 'stick' to VictoryLine and only to that places where the data point is. So If user touched screen where is no data for the touched coordinates, tooltip should jump over to the closest data point on the chart.
I saw that you recommended to use voronoi container for this, but the thing is that I need zoom container as well in my app.
so i combined zoom and cursor container.
https://codesandbox.io/s/pensive-hill-p2p3t?file=/index.js
Maybe there is better solution to achieve 'Apple Stocks' app functionality with victory native you can suggest?
Right now I ended up using cursor container and my tooltip is VictoryScatter.
When I touch the screen and cursor appears I am able to get X coordinates.
I have a function that by that coordinates finding closest data point.
And I am able to set X to my tooltip (scatter) but I dont know how to get Y coordinate for data point if I have x.
In he sandbox it is not working as expected, for some reason. On the phone it kinda works, but it jumps randomly from point to point nad making it super slow, I guess because of calculation made on each cursor change.
t4dek
on 30 Sep 2020
Hi guys, can we re-open this issue?
- When I don't specify
cursorDimension, I'm able to get point value ononCursorChangebut the cursor renders both xAsis and yAsis. - When I specify
cursorDimension = x, I can only get x value ononCursorChange
Can I have an option to get both x and y on onCursorChange when cursorDimension = x? @boygirl
 hmtri1011
on 30 Mar 2021
hmtri1011
on 30 Mar 2021
Related issues
 hwaterke
·
6Comments
hwaterke
·
6Comments
 matejkriz
·
3Comments
matejkriz
·
3Comments
 safaiyeh
·
6Comments
safaiyeh
·
6Comments
 ChrisGatzo
·
3Comments
ChrisGatzo
·
3Comments
 phunkren
·
5Comments
phunkren
·
5Comments
Most helpful comment
Hi guys, sorry if I step in, but it seems we are talking about the same thing. Do you know a way to get the Y interpolated value? I am not interested in getting the nearest, but just the Y interpolated value provided X.