Victory-native: Using dates as x axis for VictoryChart?
How can I display dates with VictoryChart and VictoryLine?
 safaiyeh
All 6 comments
Here's an example: https://formidable.com/open-source/victory/gallery/brush-zoom
Make sure that your data is formatted as date objects, and your scale is set to scale={{ x: "time" }} on VictoryChart
 boygirl
on 21 Jul 2017
boygirl
on 21 Jul 2017
Make sure that your data is formatted as date objects, and your scale is set to scale={{ x: "time" }} on VictoryChart
Thanks, @boygirl. This really helped me! Is this in the documentation anywhere? I may have missed it.
 frankalbenesius
on 11 May 2018
frankalbenesius
on 11 May 2018
@boygirl This example you sent is fantastic. Exactly what I need. I played a lot on the preview, to edit the chart the way I need. I am trying to edit it, replacing the component "VictoryLine" with the "VictoryScatter", because I want to use the "dataComponent" to show images on top of the chart. Is it possible? So far, I am testing with emojis, like in this example (https://formidable.com/open-source/victory/docs/victory-scatter/), but they are not being showed on my app.
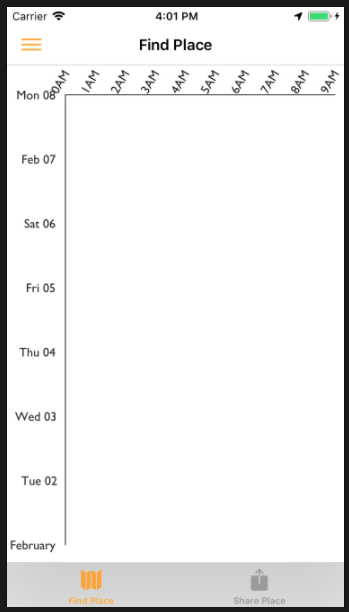
Here is my code. Could you give me a help?
import React, { Component } from 'react';
import ReactDOM, { Text, View, Dimensions, StyleSheet, Image } from 'react-native';
import * as V from 'victory';
import { VictoryZoomContainer, VictoryBrushContainer, VictoryChart, VictoryAxis, VictoryScatter, VictoryLine } from 'victory-native';
import Svg, { Polygon, Circle, G, Path, Line, Rect } from "react-native-svg";
import Picture from "../../assets/borabora.jpg";
class CatPoint extends Component {
render() {
  const {x, y, datum} = this.props; // VictoryScatter supplies x, y and datum
  const cat = datum._y >= 0 ?  "😻" : "😹"; // <Image source={Picture} style={{height: 20, width: 20}} />;
  return (
    <Text x={x} y={y} fontSize={20}>
     {cat}
    </Text>

  );
}
}
class Chart3 extends Component {
constructor() {
super();
this.state = {
zoomDomain: {
y: [new Date(1982, 1, 1), new Date(1982, 1, 8)]
}
};
}
handleZoom(domain) {
  this.setState({ zoomDomain: domain });
}

render() {
  return (
padding={{ left: 65, top: 50, right: 10, bottom: 50 }}
domainPadding={{x: 1, y: 5}}
responsive={true}
containerComponent={
zoomDomain={this.state.zoomDomain}
onZoomDomainChange={this.handleZoom.bind(this)}
/>
}
>
scale={{ y: "time" }}
/>
domain={{ x: [0, 24] }}
style={{ tickLabels: { angle: -60 } }}
tickFormat={[
"0AM",
"1AM",
"2AM",
"3AM",
"4AM",
"5AM",
"6AM",
"7AM",
"8AM",
"9AM",
"10AM",
"11AM",
"12AM",
"1PM",
"2PM",
"3PM",
"4PM",
"5PM",
"6PM",
"7PM",
"8PM",
"9PM",
"10PM",
"11PM"
]}
/>
data: { stroke: "tomato" }
}}
dataComponent={
data={[
{ a: 8.10, b: new Date(1982, 1, 1) },
{ a: 10.50, b: new Date(1982, 1, 1) },
{ a: 12.45, b: new Date(1982, 1, 1) },
{ a: 15.30, b: new Date(1982, 1, 1) },
{ a: 17.22, b: new Date(1982, 1, 1) },
{ a: 19.12, b: new Date(1982, 1, 1) }
]}
x="a"
y="b"
/>
data: { stroke: "tomato" }
}}
dataComponent={
data={[
{ a: 8.30, b: new Date(1982, 1, 1) },
{ a: 11.50, b: new Date(1982, 1, 1) },
{ a: 13.45, b: new Date(1982, 1, 1) },
{ a: 16.30, b: new Date(1982, 1, 1) },
{ a: 17.32, b: new Date(1982, 1, 1) },
{ a: 18.12, b: new Date(1982, 1, 1) }
]}
x="a"
y="b"
/>
data: { stroke: "tomato" }
}}
dataComponent={
data={[
{ a: 8.10, b: new Date(1982, 1, 4) },
{ a: 10.50, b: new Date(1982, 1, 4) },
{ a: 12.45, b: new Date(1982, 1, 4) },
{ a: 15.30, b: new Date(1982, 1, 4) },
{ a: 17.22, b: new Date(1982, 1, 4) },
{ a: 19.12, b: new Date(1982, 1, 4) }
]}
x="a"
y="b"
/>
const styles = StyleSheet.create({
container: {
display: "flex",
flexWrap: "wrap",
width: Dimensions.get("window").width,
height: Dimensions.get("window").height,
paddingLeft: 0,
paddingRight: 0
}
})
export default Chart3;
 barbararcbf12
on 23 Oct 2018
barbararcbf12
on 23 Oct 2018
@barbararcbf12 There was an issue with emoji support recently in react-native-svg. You might want to check to be sure you are using the latest version.
boygirl
on 30 Oct 2018
Here's an example: https://formidable.com/open-source/victory/gallery/brush-zoom
Make sure that your data is formatted as date objects, and your scale is set to
scale={{ x: "time" }}onVictoryChart
this link doesn't exist any more, would you please edit link?
 FatemeMirzaeii
on 13 Sep 2020
FatemeMirzaeii
on 13 Sep 2020
Found it @FatemeMirzaeii ... https://formidable.com/open-source/victory/guides/brush-and-zoom/
 cafesanu
on 3 Oct 2020
cafesanu
on 3 Oct 2020
Related issues
 ChrisGatzo
·
3Comments
ChrisGatzo
·
3Comments
 yvonne6344
·
4Comments
yvonne6344
·
4Comments
 UtkarshPramodGupta
·
5Comments
UtkarshPramodGupta
·
5Comments
 ericschaal
·
4Comments
ericschaal
·
4Comments
 ghost
·
6Comments
ghost
·
6Comments
Most helpful comment
Here's an example: https://formidable.com/open-source/victory/gallery/brush-zoom
Make sure that your data is formatted as date objects, and your scale is set to
scale={{ x: "time" }}onVictoryChart