Victory-native: Drag too slow(lags) on VictoryVoronoiContainer with big dataset
I was trying to implement a chart and I wanted to activate the current active point by show showing a marker and a crosshair by using label component. Something like 
i was able to achieve this using following code:-
import {VictoryLine,VictoryVoronoiContainer,VictoryGroup,Point} from "victory-native";
import React from "react";
import {G,Line} from "react-native-svg";
import {View,Text} from "react-native";

class ChartPoint extends React.Component {
  state = {

  };

  render () {
    const {
      x,
      y,
      datum,
      activeX
    } = this.props;
    let size = 0;
    let lineContent = null;
    if (datum.x === activeX) {
      size = 10;
      lineContent = (
        <Line
          stroke="grey"
          strokeWidth="1"
          x1={x}
          x2={x}
          y1={y-200}
          y2={y+200}
        />
      );
    }
    return (
      <G>
        {lineContent}
        <Point
          datum={datum}
          size={size}
          symbol={"circle"}
          x={x}
          y={y}
        />
      </G>
    );
  }
}


export default class CustomDataComponent extends React.Component {
  state = {
    "x": 1
  };

  setActiveIndex = (points)  => {
    this.setState({"x": points[1].x});
  }

  render () {
    return (
      <View style={{"flex":1}}>
        <View style={{"marginVertical":20,"alignItems": "center","flex":0.2}}>
          <Text style={{"fontSize": 14}}>Date</Text>
          <Text style={{"fontSize": 16}}>{this.state.x}</Text>
        </View>
        <View style={{"flex":1}}>
          <VictoryGroup
            containerComponent={<VictoryVoronoiContainer
             labels={(d) => (d.y)}
             labelComponent={<ChartPoint />}
            />}
            data={[
              {"x": 1, "y": 2},
              {"x": 2, "y": 3},
              {"x": 3, "y": 5},
              {"x": 4, "y": 4},
              {"x": 5, "y": 7},
              {"x": 6, "y": 8}
            ]}
          >
            <VictoryLine
              style={{
                "data": {"stroke": "#c43a31"},
                "parent": {"border": "1px solid #ccc"}
              }}
            />
          </VictoryGroup>
        </View>
      </View>

    );
  }
}

ChartPoint.propTypes = {
  "activeX": React.PropTypes.number.isRequired,
  "datum": React.PropTypes.object.isRequired,
  "x": React.PropTypes.number.isRequired,
  "y": React.PropTypes.number.isRequired
};
Now this works fine if number of points are less. But if number of points increase say > 200 the mouseTouch event really lags. It takes lot of time to scroll to current point. Attaching a sample video

Can someone please help me on this?
 jinxac
All 39 comments
@jinxac It looks like you're using VictoryVoronoiContainer as expected. The only thing I can think of would be moving your labels to VictoryLine rather than VictoryVoronoiContainer, as some extra positioning calculations are carried out for the container. You might also add dimension="x" to VictoryVoronoiContainer to prevent extra work.
if you drop the marker and just use the cursor, you may get better performance with VictoryCursorContainer.
 boygirl
on 13 Jul 2017
boygirl
on 13 Jul 2017
@boygirl really thanks for responding... it works fine with <VictoryCursorContainer />. I somehow had missed this but this fits exactly my use case. with defaultCursorValue I can even show the current position.
P.S: I was using high charts in web view earlier for rendering charts because no other charts were working with the interactions we needed. Because of that configurations became really huge. And then I land up on VictoryNative. Amazing work guys :D
jinxac
on 14 Jul 2017
@jinxac thanks for the kind words! and I'm so glad the new VictoryCursorContainer worked well :D
 chrisbolin
on 14 Jul 2017
chrisbolin
on 14 Jul 2017
@chrisbolin is there any way i can i put marker(point on active index) using CursorContainer ?
jinxac
on 14 Jul 2017
Hey @jinxac you might be looking for the VictoryVoronoiContainer instead of VictoryCursorContainer. from the VCC docs:
Note that the cursor allows you to inspect the entire domain, not just the data points. If you would like to instead highlight only the data points, consider using VictoryVoronoiContainer.
chrisbolin
on 14 Jul 2017
to expound on that: if you want to inspect the data closes to the mouse, not just where the mouse happens to be, the VoronoiContainer is for you. if you want to have a vertical line on the closest data point, you could use a different labelComponent with VoronoiContainer.
chrisbolin
on 14 Jul 2017
I tried that, but it becomes VoronoiContainer becomes very slow with huge
data set. Can u please check the gif attached for this bug?
On Fri, 14 Jul 2017 at 7:34 PM, Chris Bolin notifications@github.com
wrote:
to expound on that: if you want to inspect the data closes to the mouse,
not just where the mouse happens to be, the VoronoiContainer is for you. if
you want to have a vertical line on the closest data point, you could use a
different labelComponent
https://formidable.com/open-source/victory/docs/victory-voronoi-container/#labelcomponent
with VoronoiContainer.—
You are receiving this because you were mentioned.
Reply to this email directly, view it on GitHub
https://github.com/FormidableLabs/victory-native/issues/120#issuecomment-315367514,
or mute the thread
https://github.com/notifications/unsubscribe-auth/AOXrwHq57ddDB0W3fsaDhxQ4zrFTmWYcks5sN3U1gaJpZM4OWue9
.
jinxac
on 14 Jul 2017
I think I would need VoronoiContainer because i need to get the active points(x and y values) to show in the different view. Will it be possible to get current active point in CursorContainer?
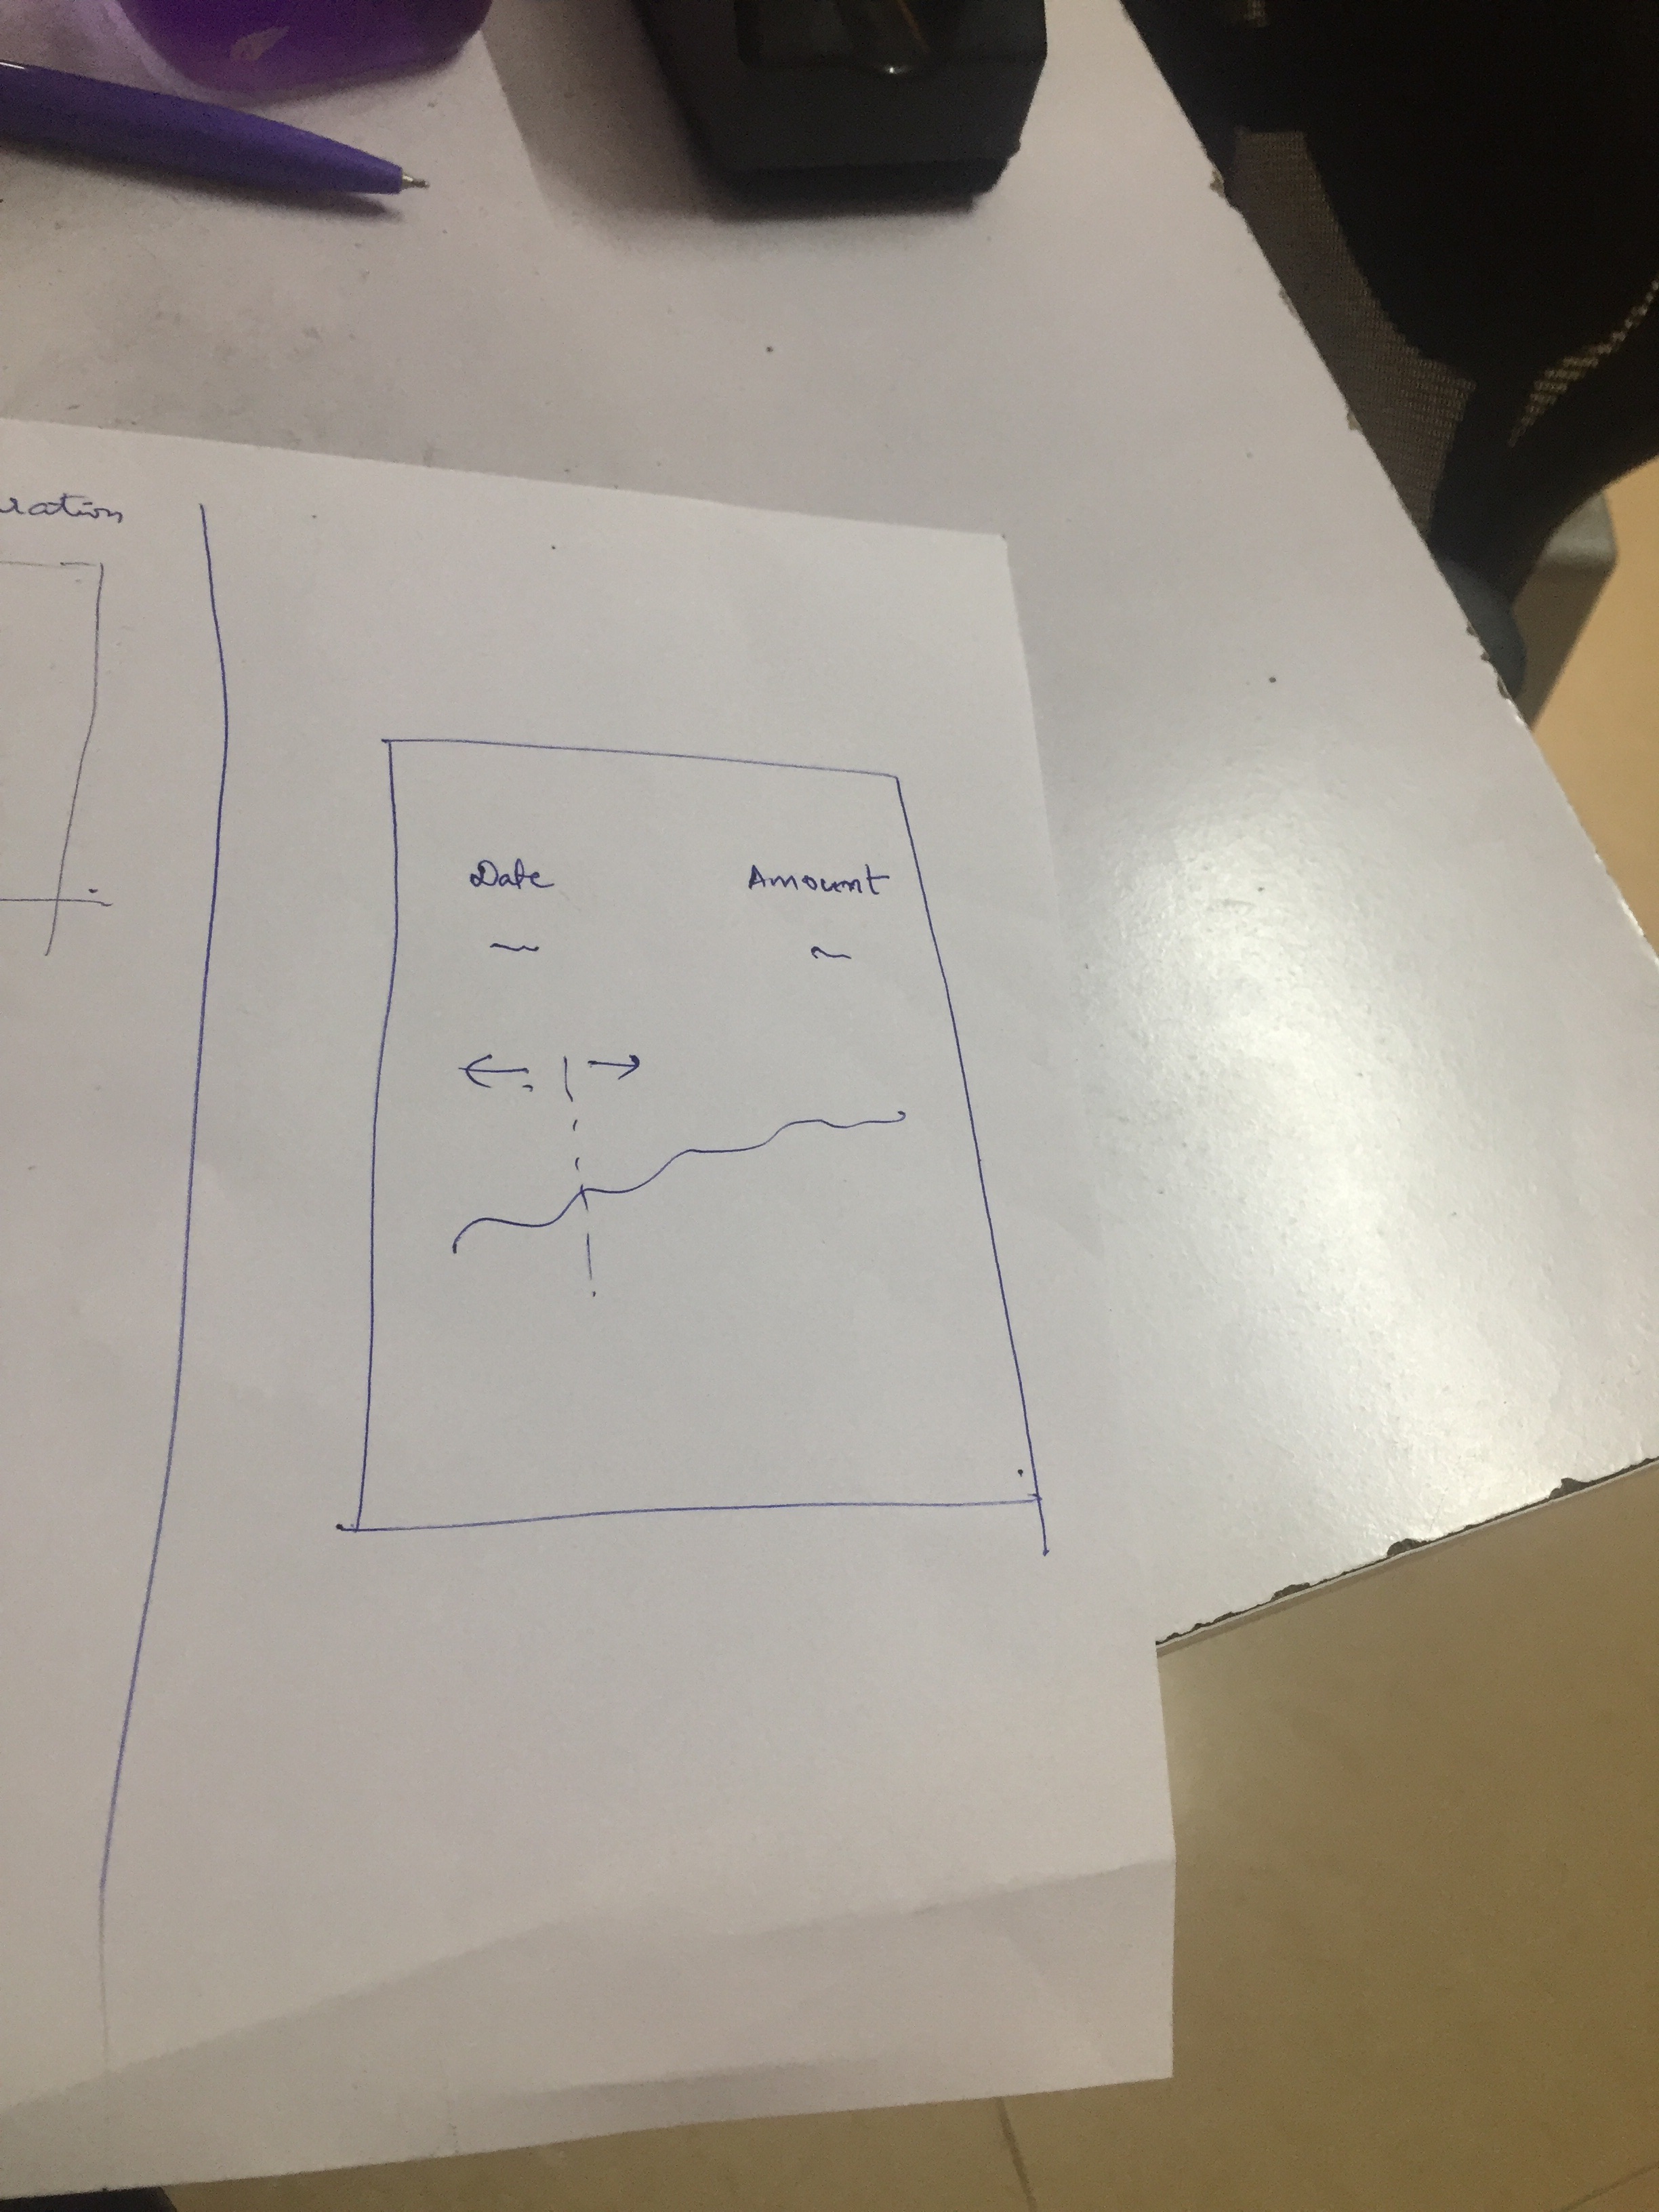
If you see the attached image I want show the current date(my x axis value) and amount(my y axis value) above the chart. On touch move I need to update the above view with current date and amount. I tried using VoronoiContainer as mentioned earlier but it gets really laggy as can be seen the gif above.
Following is my code I was trying with VoronoiContainer :-
import {VictoryLine,VictoryVoronoiContainer,VictoryScatter,VictoryGroup,Point} from "victory-native";
import React from "react";
import {G,Line} from "react-native-svg";
import {View,Text} from "react-native";


class ChartPoint extends React.Component {
  state = {

  };

  render () {
    const {
      x,
      y,
      datum,
      activeX
    } = this.props;
    let size = 0;
    let lineContent = null;
    if (datum.x === activeX) {
      size = 10;
      lineContent = (
        <Line
          stroke="grey"
          strokeWidth="1"
          x1={x}
          x2={x}
          y1={y-200}
          y2={y+200}
        />
      );
    }
    return (
      <G>
        {lineContent}
        <Point
          datum={datum}
          size={size}
          symbol={"circle"}
          x={x}
          y={y}
        />
      </G>
    );
  }
}


export default class CustomDataComponent extends React.Component {
  state = {
    "x": 1,
     "y": 1
  };

  setActiveIndex = (points)  => {
    this.setState({
        "x": points[1].x,
        "y": points[1].y
    });
  }

  render () {
    return (
      <View style={{"flex":1}}>
        <View style={{"marginVertical":20,"alignItems": "center","flex":0.2}}>
          <Text style={{"fontSize": 14}}>Date</Text>
          <Text style={{"fontSize": 16}}>{this.state.x}</Text>
        </View>
        <View style={{"flex":1}}>
          <VictoryGroup
            containerComponent={<VictoryVoronoiContainer
              onActivated={(points) => this.setActiveIndex(points)}
            />}
            data={this.props.data}
          >
            <VictoryLine
              style={{
                "data": {"stroke": "#c43a31"},
                "parent": {"border": "1px solid #ccc"}
              }}
            />
            <VictoryScatter
              dataComponent={<ChartPoint activeX={this.state.x} />}
            />
          </VictoryGroup>
        </View>
      </View>

    );
  }
}

ChartPoint.propTypes = {
  "activeX": React.PropTypes.number.isRequired,
  "datum": React.PropTypes.object.isRequired,
  "x": React.PropTypes.number.isRequired,
  "y": React.PropTypes.number.isRequired
};
Can you please suggest how to approach this case? @boygirl @chrisbolin
jinxac
on 15 Jul 2017
@jinxac sorry for the confusion!
Here's how I would summarize:
If you're interested in highlighting the position of the mouse, use Cursor.
If you're interested in highlighting the data point closest to the mouse, use Voronoi.
chrisbolin
on 15 Jul 2017
@chrisbolin thanks for the reply
I got this
If you're interested in highlighting the position of the mouse, use Cursor.
If you're interested in highlighting the data point closest to the mouse, use Voronoi.
But Voronoi works really slow when number of data points increase. Can you please tell how should i handle this?
jinxac
on 15 Jul 2017
@jinxac sorry for the delay - hit me on weekend :P
We use d3 for the Voronoi logic, so I don't know if we'll be able to eke out too much more performance there. Of course, if you have suggestions on the improving the implementation I am definitely open to it!
I know it can feel like an ugly solution, but decreasing the number of data points - in a smart way, of course - could be your best approach. We have an new guide on this topic here. (It hasn't even been published yet). The guide doesn't directly apply to you, as you aren't using Zoom, but you could use the principals of the getData function's logic (from if (filtered.length > maxPoints ) onwards).
chrisbolin
on 17 Jul 2017
a few more things...
- i'm assuming that this is slow without the custom
labelComponent={<ChartPoint />}. Is that correct? - in your example code
VictoryGroupisn't necessary; VictoryLine can take acontainerComponentprop directly. But I don't think that should improve perf much.
chrisbolin
on 17 Jul 2017
@chrisbolin
I went through this documentation but in our case user can interact with chart anywhere and we need to get the active points. If i filter data then user wont be able to interact with all the points. Please correct me if I am wrong.
i'm assuming that this is slow without the custom labelComponent={
}. Is that correct?
-Yes
in your example code VictoryGroup isn't necessary; VictoryLine can take a containerComponent prop directly. But I don't think that should improve perf much.
-I tried that already but still the lag.
jinxac
on 18 Jul 2017
@jinxac i bet we can make this work!
is your data always ordered by x? (it looked like it might be, as your mockup said "Date") If it is always ordered, then we could probably use VictoryCursorContainer's onChange callback to find the closest data point very efficiently using a binary search - kinda like lodash.sortedIndexBy, or an even closer example in python.
chrisbolin
on 18 Jul 2017
the reason i'm suggesting not using Voronoi is that from your GIF I am deducing that the closest point search is just taking too long.
chrisbolin
on 18 Jul 2017
I tried using onChange on CursorContainer. From what i understood it gives
me current cursor position. So i if drag on y axis my y value keeps on
changing. If i slide exactly on line it gives me correct value.
On Tue, 18 Jul 2017 at 7:04 PM, Chris Bolin notifications@github.com
wrote:
the reason i'm suggesting not using Voronoi is that from your GIF I am
deducing that the closest point search is just taking too long.—
You are receiving this because you were mentioned.
Reply to this email directly, view it on GitHub
https://github.com/FormidableLabs/victory-native/issues/120#issuecomment-316065178,
or mute the thread
https://github.com/notifications/unsubscribe-auth/AOXrwDrF1jMrH-akUf9Pm7H5rNsvPTs8ks5sPLRfgaJpZM4OWue9
.
jinxac
on 18 Jul 2017
for sure, you are absolutely right. I was talking about putting some logic on top of that. Let me whip up a demo. But is it safe to say that your data is sorted? Or you could make it sorted relatively efficiently?
chrisbolin
on 18 Jul 2017
Yes data is in increasing order of dates. We show data from past 5 years.
On Tue, 18 Jul 2017 at 7:36 PM, Chris Bolin notifications@github.com
wrote:
for sure, you are absolutely right. I was talking about putting some logic
on top of that. Let me whip up a demo. But is it safe to say that your data
is sorted? Or you could make it sorted relatively efficiently?—
You are receiving this because you were mentioned.
Reply to this email directly, view it on GitHub
https://github.com/FormidableLabs/victory-native/issues/120#issuecomment-316074022,
or mute the thread
https://github.com/notifications/unsubscribe-auth/AOXrwL3RnOgTPCtl1PNGa1ZZk2l5PIkoks5sPLuDgaJpZM4OWue9
.
jinxac
on 18 Jul 2017
perfect - and what is the rough size of the data set? 100 points, 1000 points?
chrisbolin
on 18 Jul 2017
Yes max to max 3000
On Tue, 18 Jul 2017 at 7:44 PM, Chris Bolin notifications@github.com
wrote:
perfect - and what is the rough size of the data set? 100 points, 1000
points?—
You are receiving this because you were mentioned.
Reply to this email directly, view it on GitHub
https://github.com/FormidableLabs/victory-native/issues/120#issuecomment-316076903,
or mute the thread
https://github.com/notifications/unsubscribe-auth/AOXrwGvOxLcaSmXnunk7gLIEVlUkYWpzks5sPL2wgaJpZM4OWue9
.
jinxac
on 18 Jul 2017
alright, sorry for the delay. check out https://jsfiddle.net/chrisbolin/rz0rwdh2/
The demo relies on a simple function for efficiently finding the closest data point to the cursor (note the comment on assumptions)...
const findClosestPointSorted = (data, value) => {
    // assumes 3 things:
  // 1. data is sorted by x
  // 2. data points are equally spaced
  // 3. the search is 1-dimentional (x, not x and y)
  if (value === null) return null;
    const start = first(data).x;
    const range = (last(data).x - start);
  const index = Math.round((value - start)/range * (data.length - 1));
  return data[index];
};
Also, a few notes on data size:
- I think there is a limitation in Victory that slows all events (Cursor, Voronoi, etc) when data size gets in the thousands. I'll file a bug on this and link it to this issue
- From a practical point of view, there is almost no use to
datasizes over ~400; if the device only has an effective pixel width of ~375 pixels, you can't hope to have the cursor interact with more than ~375.
chrisbolin
on 18 Jul 2017
to summarize, i think that above example is an efficient way of answering your question from 4 days ago:
is there any way i can i put marker(point on active index) using CursorContainer ?
chrisbolin
on 18 Jul 2017
First of all thanks for creating a demo and sharing it :) . This example works fine with less points but as you said with large number of points it becomes slow.
From a practical point of view, there is almost no use to data sizes over ~400; if the device only has an effective pixel width of ~375 pixels, you can't hope to have the cursor interact with more than ~375.
- We have in a use case in which were working on charts for stocks for we need to show data for past 10 years(data of each data comprising one point) . So it would come close to 365 *10 points.
To sum it up we have 5 different variations of charts which would range from 1Month(30 points) to 10 years(3650 points).
jinxac
on 18 Jul 2017
Oh, i totally understand why your underlying dataset would be in the thousands. But many of those individual points will get lost. Here's what I mean by data reduction: http://jsfiddle.net/chrisbolin/ufn9xtub/
chrisbolin
on 18 Jul 2017
This might be related https://github.com/facebook/react-native/issues/7221
 esco
on 20 Dec 2017
esco
on 20 Dec 2017
Is VictoryCursorContainer supposed to have some kind of PanResponder API? Docs don't mention anything about it, but I can't get a vertical line to show up when swiping on a VictoryScatter.
 MiLeung
on 27 Dec 2017
MiLeung
on 27 Dec 2017
I'm experiencing the same lag (especially Android, but also iOS) when not working with large datasets (8 datapoints per dataset, but when I put several (12) datasets in VictoryLine components in a VictoryGroup parent, like below:
render() {
    const { datasets, onCursorChange } = this.props

    return (
      <VictoryChart
        width={360}
        height={400}
        containerComponent={
          <VictoryCursorContainer
            cursorDimension="x"
            onCursorChange={onCursorChange}
            cursorComponent={<Line style={{ stroke: 'red', strokeWidth: 2 }} />}
          />
                }
      >
        <VictoryGroup>
          {datasets.map(dataset => (
            <VictoryLine
              key={dataset.label}
              data={dataset.data}
              alignment="middle"
              style={{
                        data: {
                          stroke: dataset.color,
                          strokeWidth: 2
                        }
                      }}
              interpolation="natural"
            />
                  ))}
        </VictoryGroup>
      </VictoryChart>
    )
  }
With only one dataset, performance is very good!
I there a way to do this performantly for multiple VictoryLine or VictoryScatter components in a VictoryGroup component?
One dataset looks like:
const dataset = {
  label: 'Serie1',
  color: '#a83a62',
  data: [
    {
      x: 1,
      y: 28.52
    },
    {
      x: 2,
      y: 25.37
    },
    {
      x: 3,
      y: 25.6
    },
    {
      x: 4,
      y: 25.16
    },
    {
      x: 5,
      y: 27.78
    },
    {
      x: 6,
      y: 24.39
    },
    {
      x: 7,
      y: 25.84
    },
    {
      x: 8,
      y: 27.27
    }
  ]
}
The datasets prop would be an array of 12 of these datasets.
 karaoak
on 6 Jun 2018
karaoak
on 6 Jun 2018
@karaoak that is unexpectedly slow for such a small number of datasets. Based on your code above, I don't think you need the VictoryGroup wrapper around your 12 lines. You might get better performance if you remove it.
boygirl
on 7 Jun 2018
@boygirl Thank you for your quick answer and suggestion. I just tested. Unfortunately removing the VictoryGroup does not result in a better performance 😥
With less Line components, performance is very good.
I think of investigating to only onTouchMove add an eventHandler and draw the vertical cursor line outside of my VictoryChart component.
Would that be a good direction to investigate upon?
karaoak
on 7 Jun 2018
I was following this issue, because initially I had the problem as described in issue #244
Because of issue #28 the alternative solution as I saw is unfortunately not possible.
Because of these issues that result in not being able to set up performant chart interactions on device, we are moving to implement: https://github.com/wuxudong/react-native-charts-wrapper
This wrapper and these native iOS + Android libraries facilitate in our chart interaction needs.
karaoak
on 12 Jun 2018
@chrisbolin I need help here,
VictoryCursorContainer cursorLabel x-Axis data doesn't control it and cursorComponent Line color doesn't change. in React-native
"react-native": "0.55.4",
"victory-native": "0.18.0",
"react-native-svg": "^6.4.1",
when i give cursorComponent Line color
 yogeshR5
on 12 Jul 2018
yogeshR5
on 12 Jul 2018
@yogeshR5 your question is unrelated to this issue. I have answered your question here: https://github.com/FormidableLabs/victory/issues/1044 and in gitter.
boygirl
on 13 Jul 2018
Performance related issues are all now being tracked here: https://github.com/FormidableLabs/victory-native/issues/369
boygirl
on 22 Aug 2018
@chrisbolin how did you get to this way of finding how to reduce the amount of points? Not totally sure I understand the mathematical basis for this.
Thanks so much for the help. This was a life-saver.
https://jsfiddle.net/ufn9xtub/23/
      const k = Math.pow(2, Math.ceil(Math.log2(filtered.length / maxPoints)));
      let optimizedPoints = filtered.filter(
        (d, i) => (((i + startIndex) % k) === 0)
      );
via https://github.com/FormidableLabs/victory-native/issues/120#issuecomment-316154918
 JackHowa
on 28 Aug 2018
JackHowa
on 28 Aug 2018
@JackHowa the constant k is calculated this way so that the same points are reliably chosen as the sample size changes. This reduces flicker for things like zoom where the sample size is changing rapidly.
boygirl
on 28 Aug 2018
gotcha yep, thanks this is definitely helpful. I'm wondering what the benefit of const k = Math.pow(2, Math.ceil(Math.log2(filtered.length / maxPoints))); is over const k = Math.ceil(filtered.length / maxPoints)));?
As a whole, this is a super useful suggestion that's saved my team tons of time. The mathematical basis for the Math.pow(2, Math.log2(x / y)) was what I was trying to get at.
JackHowa
on 29 Aug 2018
@JackHowa sorry I wasn't clear. const k = Math.pow(2, Math.ceil(Math.log2(filtered.length / maxPoints))); makes is so that the k values is always a power of two. The k value is used to pick points (i + startIndex) % k) === 0, so if it is always a power of two, you can ensure that the same points are chosen even as the number of points you're selecting from changes (especially noticeable when zooming out).
boygirl
on 30 Aug 2018
Oh, I see. So the same values are picked -- not just same amount. That's really brilliant. Nice work. Since I didn't understand its importance, I did Math.ceil(filtered.length / maxPoints). Thanks for explaining. VictoryNative has been a life-saver
JackHowa
on 31 Aug 2018
Related issues
 WhyX
·
6Comments
WhyX
·
6Comments
 aszheng
·
5Comments
aszheng
·
5Comments
 ericschaal
·
4Comments
ericschaal
·
4Comments
 jzhw0130
·
3Comments
jzhw0130
·
3Comments
 ararog
·
4Comments
ararog
·
4Comments