Victoriametrics: Datapoints disapear after a long shutdown
Describe the bug
Datapoints disapear after a ~12h+ shutdown. They reapear after a restart.
To Reproduce
Stop Victoria Metrics, wait, start again. Most of the data points are missing.
Expected behavior
See the same data points in the first start that was there before shutting down or after a new start.
Screenshots
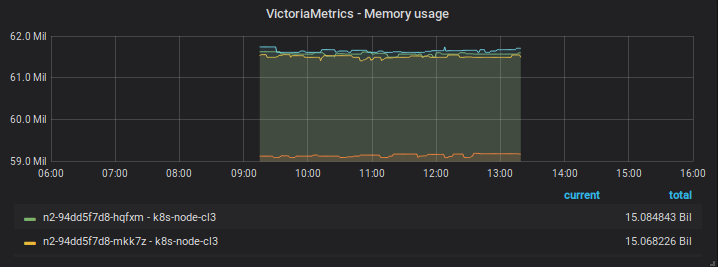
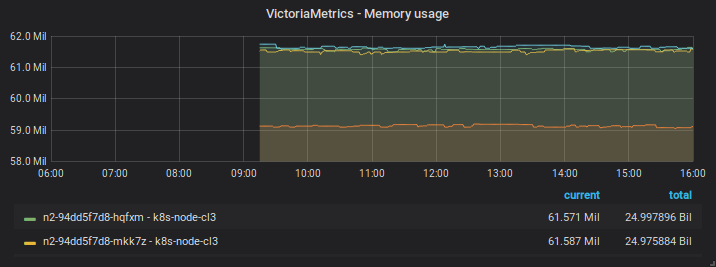
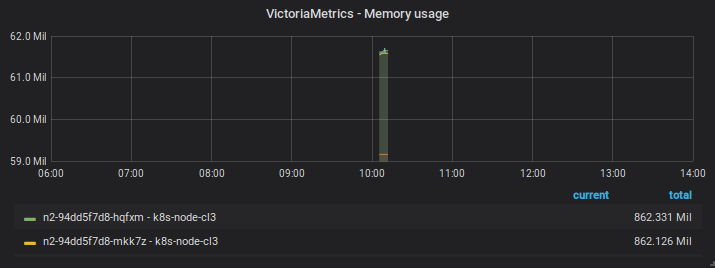
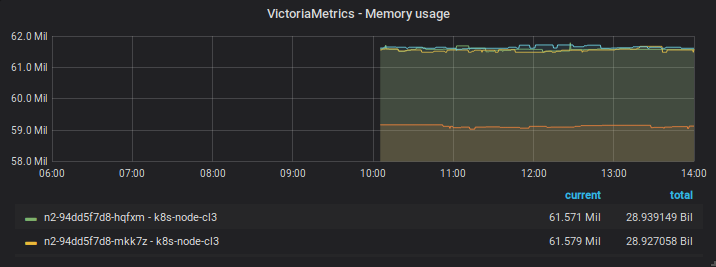
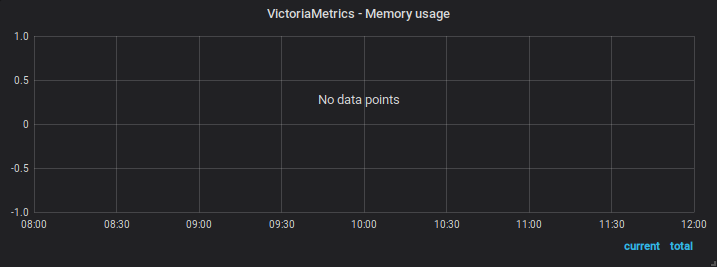
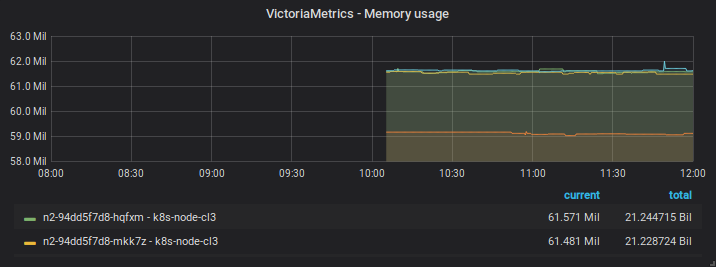
Note that the captures of the same day has distinct zoom/time range over the same data points - in the first start they disapear when using an intermediate zoom and reapear after zooming in or out.
07/08 06h00-16h00
Before restart
After restart
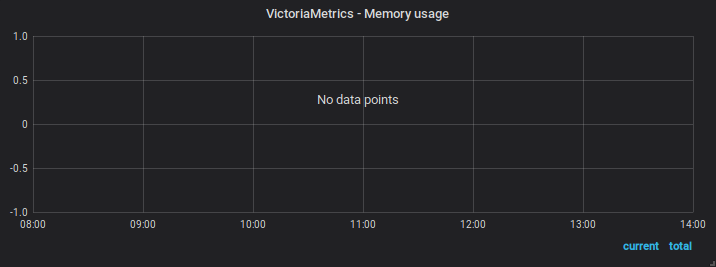
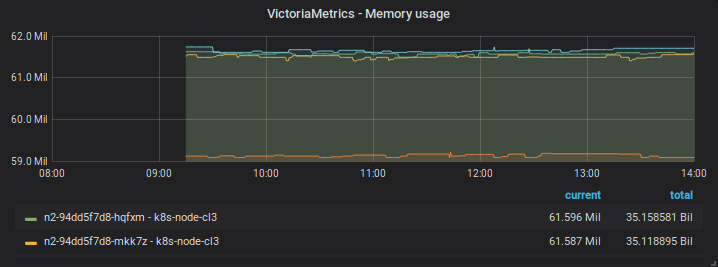
07/08 08h00-14h00
Before restart
After restart
08/08 06h00-14h00
Before restart
After restart
08/08 08h00-12h00
Before restart
After restart
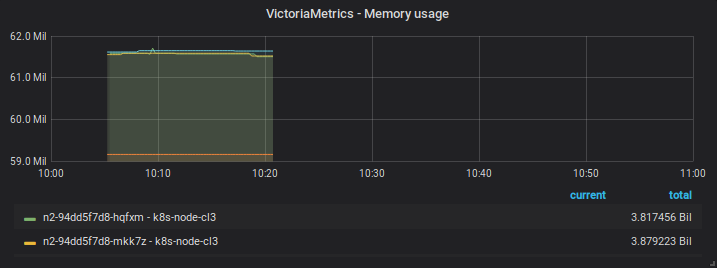
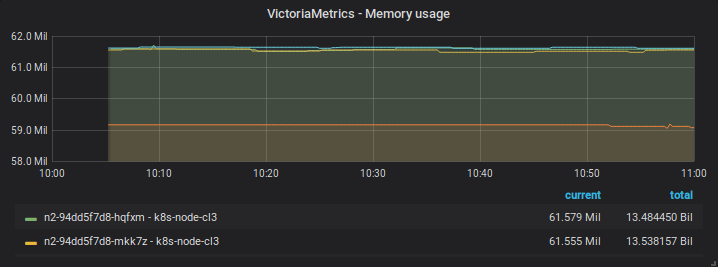
08/08 10h00-11h00
Before restart
After restart
Version
1.24.1, container version.
Additional context
I did nothing but restart the container. This happened twice with 1.24.1 which was also the number of starts I did in this version. Logs here, maybe it's of some help.
From the logs - note that logs are UTC and dashboards are GMT-0300:
- start
2019-08-08T13:04:24.222+0000has missing points - start
2019-08-08T13:17:01.996+0000apparently solved - start
2019-08-12T13:09:38.788+0000has missing points - start
2019-08-12T13:18:05.555+0000apparently solved - start
2019-08-12T13:22:08.187+0000doesn't have any visible problem as well
 jcmoraisjr
All 6 comments
The bug report mentions that different zoom levels can show different results. This suggests that the issue can be related to response caching briefly described below:
- VictoriaMetrics caches responses with time ranges ending with the current time minus 5 minutes.
- Response cache key is constructed from the query plus time range plus zoom level. These are
query,start,stopandstepargs from the query_range API. - If time range of the new request overlaps with time range of the cached response, then the
startarg is adjusted to select only new data, while old data is obtained from the cache.
Response caching can go nuts if data is back-filled, i.e. is written into the VictoriaMetrics with timestamps older than 5 minutes from the current timestamp. In this case response cache will contain partial data similar to the data shown on the attached screenshots. Make sure clients send data to VictoriaMetrics have synchronized time with VictoriaMetrics.
There are the following workarounds for bad interaction of response cache with backfilling:
- to disable response caching for all the incoming requests by passing
-search.disableCachecommand-line arg when starting VictoriaMetrics. - to disable response caching for a particular request by passing
nocache=1arg to the request to/api/v1/query_range.
@jcmoraisjr , could you try running VictoriaMetrics for a few hours with disabled response cache and verify whether the issue still persists?
 valyala
on 12 Aug 2019
valyala
on 12 Aug 2019
Hi,
Make sure clients send data to VictoriaMetrics have synchronized time with VictoriaMetrics.
Both Prometheus and VictoriaMetrics are containers running in the same host. Clocks are synchronized.
could you try running VictoriaMetrics for a few hours with disabled response cache and verify whether the issue still persists?
Before trying some strategy I'd like to see a consistent behavior ... but I couldn't reproduce the problem today without changing anything. So I cannot say what could help because, at this moment, I cannot say what's causing the issue.
I'll continue the monitoring, collecting new data, looking for old data after a long shutdown, I'll let you know if anything changes.
jcmoraisjr
on 13 Aug 2019
@jcmoraisjr , could you try reproducing the issue on v1.26.0?
valyala
on 23 Aug 2019
@jcmoraisjr , any updates on this issue?
valyala
on 31 Oct 2019
Hi, couldn't back to this poc anymore, which explain the lack of feedback. Sorry about the long delay.
We're using the same 1.24.1 on a staging env which grows about 30GiB/month, browsing some load balancer metrics without a single issue - zooming in and out, moving back to the past. It sounds to me the issue described here happens on a very specific use case - I was running VictoriaMetrics a few hours per day without cleaning up the db.
I'm planning to continue that poc within a few weeks from now and I'll let you know if I have any problem, no doubt about that. Perhaps in the mean time we can consider this fixed, I'll reopen if I can find this same problem again. Btw I'll let you know about numbers compared with m3db as I said elsewhere. Tks for the great job.
jcmoraisjr
on 1 Nov 2019
@jcmoraisjr , thanks for the update.
I'd recommend upgrading to v1.28.2 - it should use less CPU and RAM comparing to v1.24.1, especially when working with high number of active time series (i.e. time series with recently added data points or recently queried data). The only thing is that v1.28.* changes on-disk format for inverted index in the background on the first run, so it is impossible downgrading to the previous versions after the first run. The background conversion could take some time - during this time VictoriaMetrics continue working, but its' performance could be degrated.
Upgrade procedure is quite simple - see https://github.com/VictoriaMetrics/VictoriaMetrics/blob/master/README.md#how-to-upgrade-victoriametrics .
valyala
on 1 Nov 2019
Related issues
 oOHenry
·
4Comments
oOHenry
·
4Comments
 WilliamDahlen
·
3Comments
WilliamDahlen
·
3Comments
 localpref
·
3Comments
localpref
·
3Comments
 jelmd
·
3Comments
jelmd
·
3Comments
 genericgithubuser
·
4Comments
genericgithubuser
·
4Comments
Most helpful comment
Hi, couldn't back to this poc anymore, which explain the lack of feedback. Sorry about the long delay.
We're using the same
1.24.1on a staging env which grows about 30GiB/month, browsing some load balancer metrics without a single issue - zooming in and out, moving back to the past. It sounds to me the issue described here happens on a very specific use case - I was running VictoriaMetrics a few hours per day without cleaning up the db.I'm planning to continue that poc within a few weeks from now and I'll let you know if I have any problem, no doubt about that. Perhaps in the mean time we can consider this fixed, I'll reopen if I can find this same problem again. Btw I'll let you know about numbers compared with m3db as I said elsewhere. Tks for the great job.