Victoriametrics: rate() on long-running counter doesn't ignore the first reading, causing a huge spike
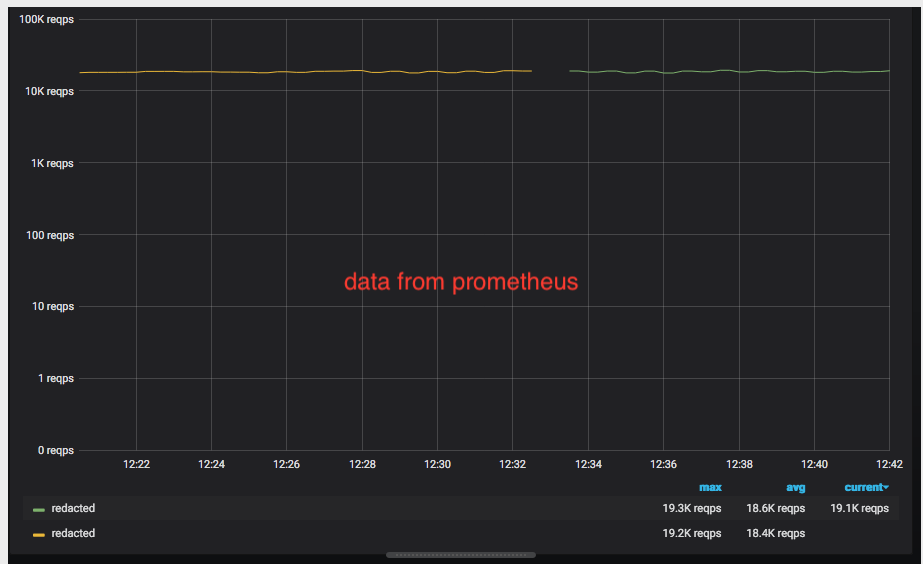
I've observed a stark difference in displaying a graph from the same data set in prometheus vs victoriametrics. I had changed some automation regarding scraping from bind_exporter which caused some of the labels to change, thus creating new time series. bind_exporter has been running for a while, and when the new scrapes came in, I observed this:
rate(bind_incoming_queries_total{instance="192.0.2.1:9119",type="A"}[1m])
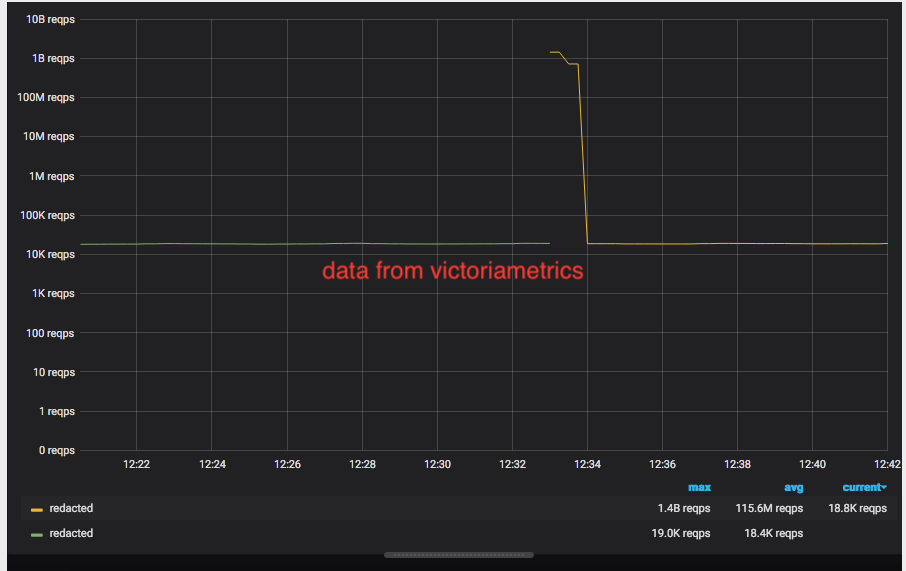
I've read #279, which seems related but not exactly the same issue. I suspect the same root cause, though. As this is a new series, the very first reading needs to be treated like a counter reset but apparently isn't - bind_exporter will give me a counter of approx 1.3G for the new series, VM displays the rate of (1.3G - 0) for the first data point. After the wrongly calculated first point, the rate is correct.
VM needs to make sure that new series treat the first value as a counter reset.
I've restarted VM with disableCache as suggested in #279 to no effect.
 localpref
All 3 comments
I've just seen that 1.32.1 was released yesterday and https://github.com/VictoriaMetrics/VictoriaMetrics/commit/d5aeda0e1a7ef40985f2a8efcc562e583ec6e36e fixes this bug. :)
localpref
on 10 Jan 2020
I've upgraded to 1.32.1 and this behaviour disappeared.
localpref
on 10 Jan 2020
@localpref thanks for confirmation
 tenmozes
on 10 Jan 2020
tenmozes
on 10 Jan 2020
Related issues
 valyala
·
4Comments
valyala
·
4Comments
 n4mine
·
3Comments
n4mine
·
3Comments
 abualy
·
3Comments
abualy
·
3Comments
 oOHenry
·
4Comments
oOHenry
·
4Comments
 v98765
·
3Comments
v98765
·
3Comments
Most helpful comment
I've just seen that 1.32.1 was released yesterday and https://github.com/VictoriaMetrics/VictoriaMetrics/commit/d5aeda0e1a7ef40985f2a8efcc562e583ec6e36e fixes this bug. :)