Victoriametrics: Differences in responses from VM and Prometheus
Describe the bug
It seems random, but at times when we query for a metric from a target, i get diffs in the responses from VM compered to prometheus, where the target is scraped . I dont really experience this if i choose time ranges (from grafana) like "last 5 minutes" and "last 15 minutes", but at "last 2 days" it gets quite evident. Not all target metrics are like this. I have tried with several queries and found that at times only 2 - 6 values are different, but suddenly i get over 800 diffs in a response with 5000 lines.
When i input the same queries in Grafana, the graphs are not visibly affected (using "last 2 days"). So the values that are "wrong" or different does not amount to much, but i would not think it is supposed to be like this.
I will continue to test this and update the issue if i find anything confirming the issue further or anything that might solve or explain the behaviour.
To Reproduce
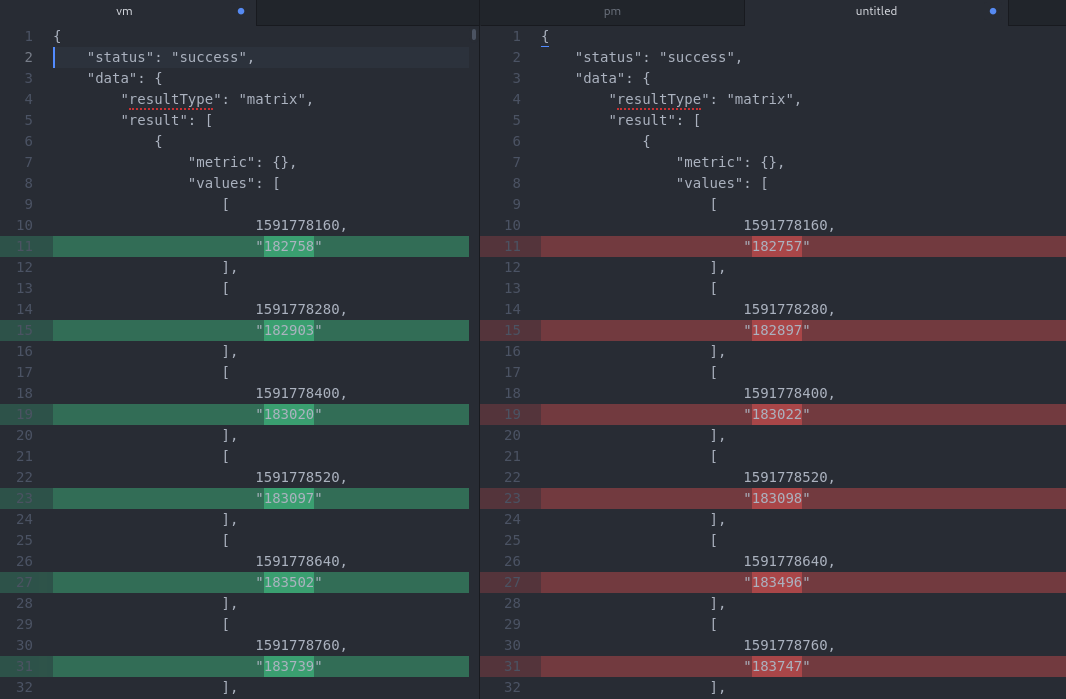
The way i found out was by taking the api string from the url in a grafana panel via the query inspector. I used postman to get the responses from VM and Prometheus. I diffed the results with a texteditor.
The query i got over 800 diffs from looks something like this;
https://victoriametrics.domain.com/api/v1/query_range?query=sum(rabbitmq_queue_messages_ready%20*%20on(instance)%20group_left(rabbitmq_cluster)%20rabbitmq_identity_info%7Brabbitmq_cluster%3D%22bridge%40server.domain.com%22%7D)&start=1591778160&end=1591950960&step=120
I used the same string starting from /api to query the prometheus instance.
Expected behavior
I expect to get served the same metrics (epoch-unix-timestamp and value) from VM's response as i get from the prometheus instance that feeds our VM installation.
Screenshots
Diff from responses, this particular one had 877.
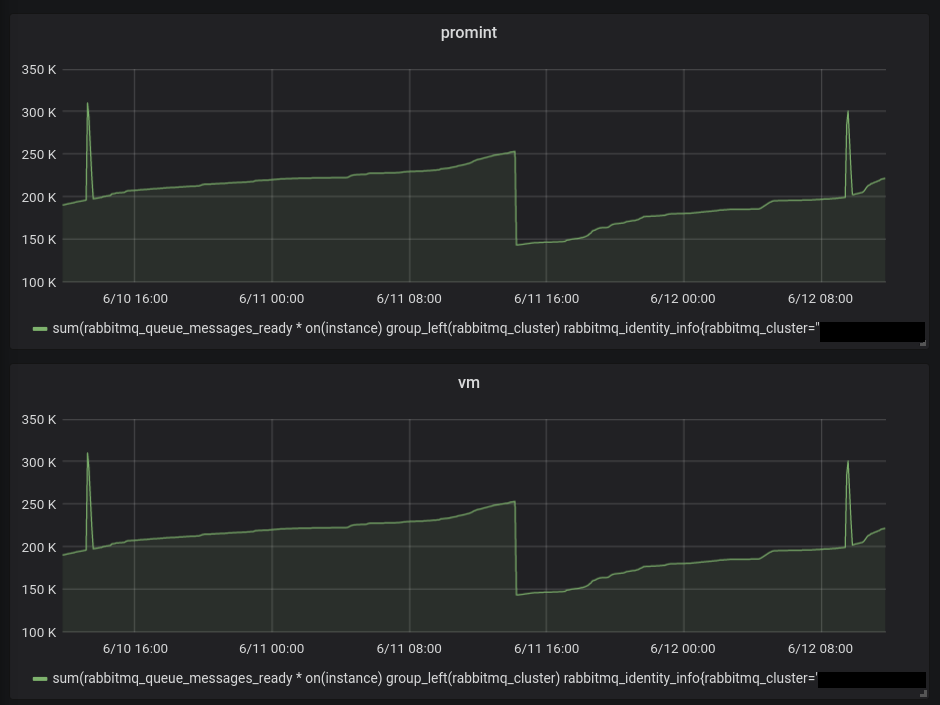
Grafana panel of the same query.
Version - _Coming as soon as possible_
The line returned when passing --version command line flag to binary. For example:
$ ./victoria-metrics-prod --version
victoria-metrics-20190730-121249-heads-single-node-0-g671d9e55
Used command-line flags
-selfScrapeInterval=10s
(left out flags for storage and usd&psw)
 WilliamDahlen
All 3 comments
Hi, i have tested my proposed bug further today and it seems like the bug is not with Victoria Metrics serving up the "wrong" metrics but rather a combination of two identical prometheus pods behind a single service in the k8s deployment that remote-write to VictoriaMetrics and which of these "datasets" i get served from Prometheus when i do the diffs.
Victoria Metrics seems to give me the same metrics every time i query for a response using postman. When i use the same query against our Prometheus service the response switches between the two running pods. One of the datasets i get in response from prometheus matches the response from VM, the other response i get from prometheus is completely different. That is why it appeared as random when i submitted the bug-report.
It seems like i need to research more about how mutiple prometheus pods behind a single service in k8s is managed by VM, but i would appriciate any response guiding me to the right resources or tips to understand what is happening and how we would go forward with fixing this. I can provide more details about what i am experiencing if needed.
WilliamDahlen
on 15 Jun 2020
The discrepancy in results between Prometheus and VictoriaMetrics may be related to slightly different data model described in the beginning of MetricsQL docs. This difference is aimed toward fixing longstanding issues in Prometheus data model.
it seems like the bug is not with Victoria Metrics serving up the "wrong" metrics but rather a combination of two identical prometheus pods behind a single service in the k8s deployment that remote-write to VictoriaMetrics and which of these "datasets" i get served from Prometheus when i do the diffs.
If two identically configured Prometheus instances write data to the same VictoriaMetrics instance, then it is recommended enabling data deduplication on VictoriaMetrics side - see these docs for details. Otherwise VictoriaMetrics would store and query all the samples obtained from both Prometheus instances.
 valyala
on 18 Jun 2020
valyala
on 18 Jun 2020
Thanks for getting back to me. It seems like deduplication is the way to go.
WilliamDahlen
on 3 Jul 2020
Related issues
 faceair
·
3Comments
valyala
·
4Comments
faceair
·
3Comments
valyala
·
4Comments
 pmitra43
·
3Comments
valyala
·
4Comments
pmitra43
·
3Comments
valyala
·
4Comments
 EricAntoni
·
3Comments
EricAntoni
·
3Comments