Vedo: Assign colors to arrows in network graphs
Hi @marcomusy
This is a follow up to my previous post here
https://github.com/marcomusy/vedo/issues/182#issuecomment-667694798
I could color the edges based on edge weights
edg.cellColors(vals, cmap='viridis', vmin=vmin, vmax=vmax)  #Blues_r
        edg.addScalarBar3D(
            title=' title',
            titleFont='VictorMono',
            labelFont='VictorMono',
            c='k',
            # titleXOffset=-1.5,
            # titleYOffset=0
        )

arrsv=[]
for i, j in G.edges():
    dv = nodes[j]-nodes[i]
    cn = (nodes[j]+nodes[i]) /2
    v = dv/mag(dv)*1.5
    ar = Arrow(cn-v, cn+v, s=.02, c='k')
    arrsv.append(ar)

show(pts, graph, labs1, labs2, arrsv)
This assigns colors to the edges and the arrows are colored black. Instead, I'd like to assign colors to arrows (something like
arrsv.cellColors inplace of edg.cellColors/ cmap) instead of edges and also generate scalarbar for the colors assigned to the arrows (e.g. arrsv.addScalarBar3D() ).
Could you please offer suggestions on how to do this?
 DeepaMahm
All 7 comments
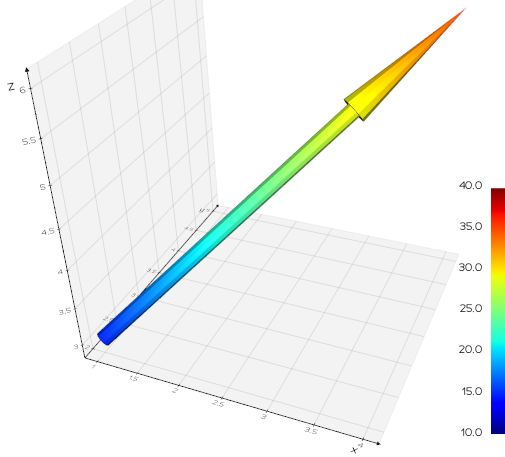
An Arrow is a Mesh object - so there is no easy way to achieve that unless by manually defining an array to the arrow and color that. Then position the arrow, again manually with stretch(). E.g.
from vedo import *

p1 = [1,2,3]
p2 = [4,5,6]
value1 = 15
value2 = 35

ar = Arrow([0,0,0],[0,0,1], s=0.01).addElevationScalars(vrange=(value1,value2))
ar.cmap('jet', vmin=10, vmax=40).stretch(p1,p2)
ar.addScalarBar()

show(ar, axes=1)
 marcomusy
on 21 Dec 2020
marcomusy
on 21 Dec 2020
Hi @marcomusy
Thank you, I tried something like the below to assign a single color to each arrow without interpolating the value of the color for each edge.
import networkx as nx
from collections import OrderedDict
from vedo.pyplot import DirectedGraph
from vedo import *


G = nx.gnm_random_graph(n=5, m=10)
nxpos = nx.spring_layout(G, dim=3, seed=1)

nxpts = [nxpos[pt] for pt in sorted(nxpos)]
nx_lines = [(nxpts[i], nxpts[j]) for i, j in G.edges()]
pts = Points(nxpts, r=10).lighting('off')
edg = Lines(nx_lines).lw(5)

weights = [1, .30, .10, .79, .70, .60, .75, .78, .65, .90]
color = colorMap(weights, name="viridis")
edge_w = OrderedDict(zip(G.edges, weights))
nx.set_edge_attributes(G, edge_w, 'weight')
edge_c = OrderedDict(zip(G.edges, color))
nx.set_edge_attributes(G, edge_c, 'color')

# print(color)
# print(G.edges())
# print(nx.get_edge_attributes(G, 'weight'))
nodes = pts.points()
arrsv = []
for i, j, attr in G.edges(data=True):
    dv = nodes[j] - nodes[i]
    cn = (nodes[j] + nodes[i]) / 2
    v = dv / mag(dv) * .35
    ar = Arrow(cn - v, cn + v, s=.01, c=G[i][j]["color"])
    arrsv.append(ar)

# manually build a lookup table for mapping colors
edg.cellColors(weights, cmap='viridis')  #Blues_r
edg.addScalarBar3D(
    title='title',
    titleFont='VictorMono',
    labelFont='VictorMono',
    c='k',
)
edg.scalarbar.addPos(0.1, 0, 0).useBounds()

show(pts,
     edg,
     arrsv,
     axes=True,
     sharecam=True,
     bg2="white",
     at=0,
     zoom=1.2,
     )
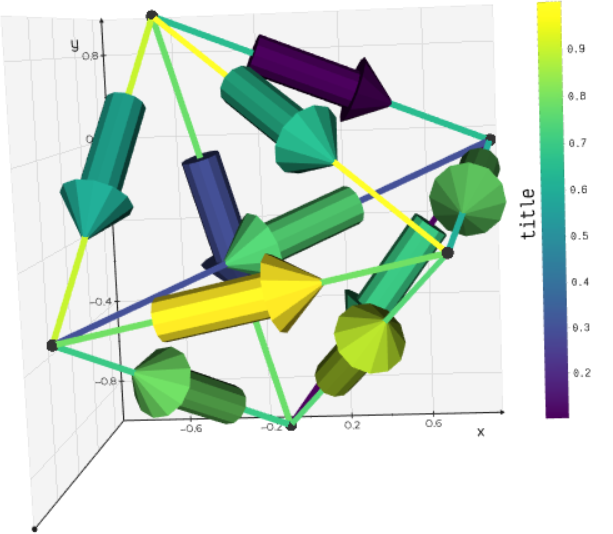
Right now the color assigned to arrow and edge is mismatched. Could you please suggest how to obtain the colors assigned to the edges from here edg.cellColors(weights, cmap='viridis') ? I think this would be easier and one could assign the edge color to arrows directly and display the same scalarbar in the legend.
Thanks so much
Deepa
DeepaMahm
on 23 Dec 2020
See: https://vedo.embl.es/content/vedo/colors.html#colormap
e.g.:
print( colorMap(0.3, name="jet", vmin=0, vmax=1) )
(0.0, 0.692156862745098, 1.0)
marcomusy
on 23 Dec 2020
Hi @marcomusy
I could generate this successfully
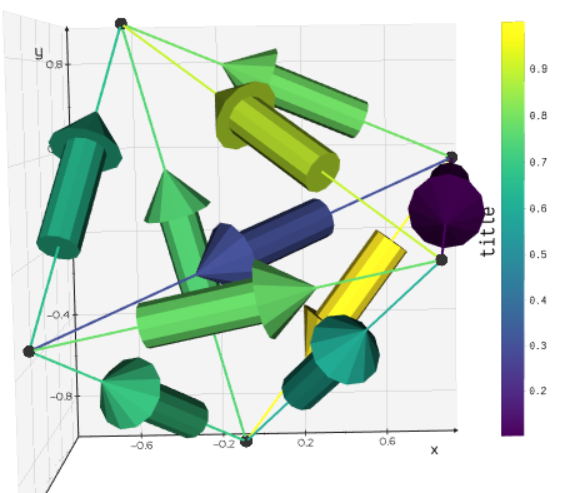
Now the arrows and the edges are assigned the same color. I would like to know if there is a way to retain the scalarbar and not color the edges. If the remove the colormap assigned for the edges edg.cellColors(weights, cmap='viridis')
the scalar bar that is associated with the edge color disappears.
DeepaMahm
on 24 Dec 2020
Just specify the color right after the cmap:
# manually build a lookup table for mapping colors
settings.defaultFont = 'VictorMono'  # set this as default if you like it, so it'll be used for axes too
edg.cmap('viridis', weights, on='cells').c('grey')

marcomusy
on 25 Dec 2020
Hi @marcomusy
While using look up table
```
lut = buildLUT([
(vmin, 'dg',),
(vmax, 'red'),
],
vmin=vmin, vmax=vmax,
interpolate=False,
aboveColor='yellow',
)
edg.cmap(lut, weights, on='cells').c('grey')
```
works for generating the colorbar. Now, I'm not sure how to obtain the colormap colorMap(0.3, name="jet", vmin=0, vmax=1)
like we did before to set the colors for arrows. Could you please suggest what has to be done?
DeepaMahm
on 26 Dec 2020
E.g.
from vedo import *
lut = buildLUT([
          (10, 'dg',),
          (40, 'red'),
      ],
          vmin=10, vmax=40,
          interpolate=False,
          aboveColor='yellow',
      )

rgb = [0,0,0]
lut.GetColor(58, rgb)
print(getColorName(rgb))
yellow
marcomusy
on 26 Dec 2020
Related issues
 drew-parsons
·
7Comments
drew-parsons
·
7Comments
 FedeClaudi
·
6Comments
FedeClaudi
·
6Comments
 jrdkr
·
7Comments
jrdkr
·
7Comments
 hmralavi
·
7Comments
hmralavi
·
7Comments
 kemo993
·
6Comments
kemo993
·
6Comments