Vedo: Invert Axis and Other Axis Options
Vedo seems to lack many of the axis options that make it optimal for publication figures, which is sad because it is far more intuitive for their creation than Matplotlib or Matlab. Some of these options are.
Invert Axis: The ability to have an axis direction follow numerical decrease rather than increase. Matplotlib equivalent: https://matplotlib.org/3.1.1/gallery/subplots_axes_and_figures/invert_axes.html
Placing 3D Axis in other locations like the front of the plotting area (see figures)
Placing Axis Planes in other locations (currently the only other option is a second zx grid I believe)
Having Axis Titles follow the camera (this may be an option I couldn't find)
For reference, I have included a figure I created both in Matlab and Vedo. In Vedo, I had to rotate my data from its natural z-down, y-left, x-forward frame (shown in Matlab figure) to get it to not be behind the axis planes. I can rotate the X-Axis title, but it is then upside down. I cannot rotate any of the axis number labels. Ideally, Vedo would be able to produce the same axes as Matlab. Also below, are my axes code options.
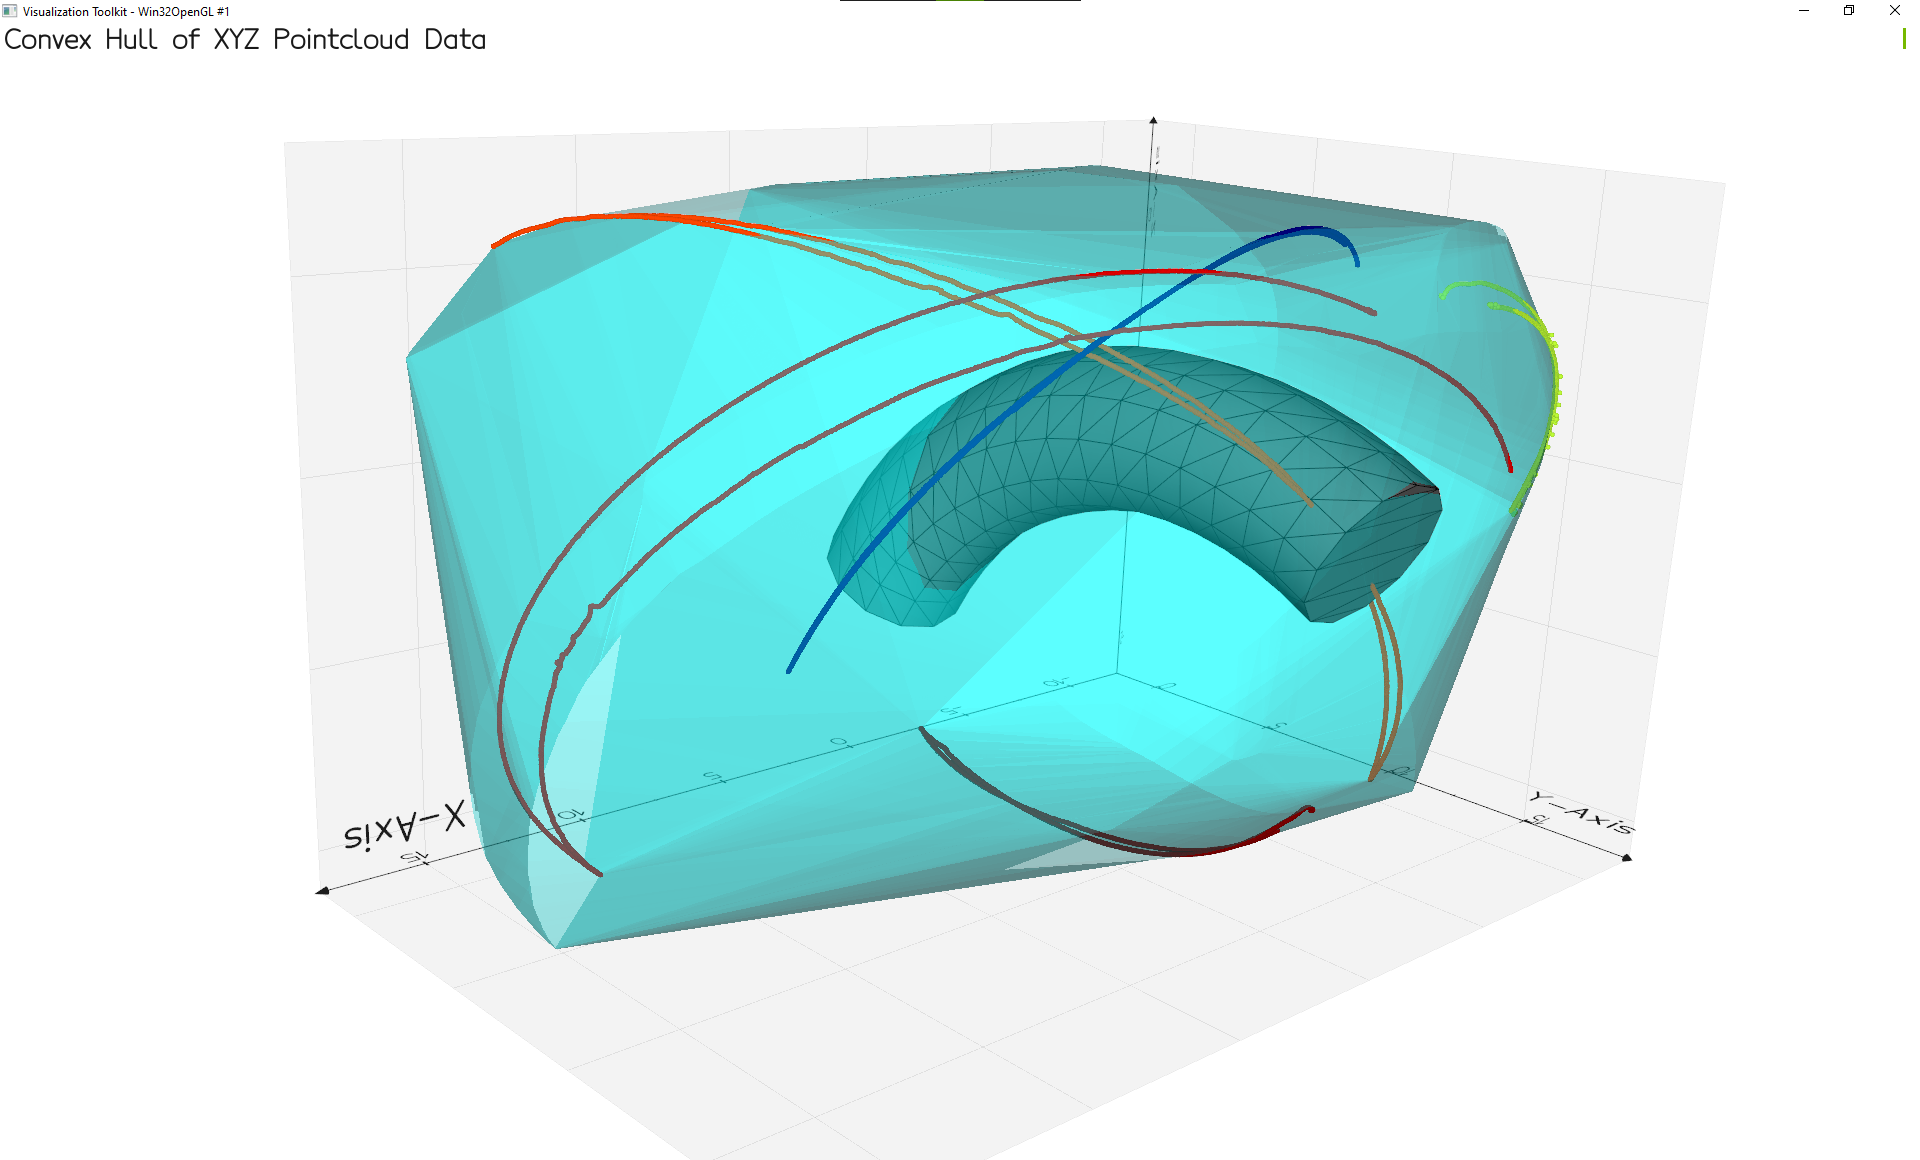

vp.show(interactive=True, axes={'zxGrid': True, 'xtitle': 'X-Axis', 'ytitle': 'Y-Axis', 'ztitle': 'Z-Axis','xTitleRotation': 270, 'xTitleOffset': 0.05, 'yLabelRotation': 90})
 JGarrett7
All 2 comments
Thanks @GeneralGarrett for your suggestions for improvement.
This seem related to issue #250 and #255 maybe something there can be of help.
About the raised points:
that should be fairly easy to add as a flag. At present one can have access at all the elements of the axes and move them around as in #250 , but it's probably not too intuitive. One can also specify order and position of each label and tick with
xValuesAndLabels(see here and here).I need to think if this is possible.. but i guess it should.
Should also be easy to implement. We could set a variable to define at what fraction (or absolute position?) along the axis the grid should sit.
Not doable. This is only possible in
axes=8mode (which I almost never use as I find it spoils the feeling of spatial orientation).
 marcomusy
on 13 Dec 2020
marcomusy
on 13 Dec 2020
- implemented via
xInvertkeyword or by inverting the range as in matplotlib - implemented via
xyShiftas a fractional position along the axis - the axis is shifted along with the plane(s) it belongs to
https://github.com/marcomusy/vedo/blob/master/docs/changes.md
marcomusy
on 7 Jan 2021
Related issues
 jrdkr
·
7Comments
jrdkr
·
7Comments
 drew-parsons
·
7Comments
drew-parsons
·
7Comments
 kemo993
·
6Comments
kemo993
·
6Comments
 FedeClaudi
·
7Comments
FedeClaudi
·
7Comments
 DeepaMahm
·
5Comments
DeepaMahm
·
5Comments
Most helpful comment
Thanks @GeneralGarrett for your suggestions for improvement.
This seem related to issue #250 and #255 maybe something there can be of help.
About the raised points:
that should be fairly easy to add as a flag. At present one can have access at all the elements of the axes and move them around as in #250 , but it's probably not too intuitive. One can also specify order and position of each label and tick with
xValuesAndLabels(see here and here).I need to think if this is possible.. but i guess it should.
Should also be easy to implement. We could set a variable to define at what fraction (or absolute position?) along the axis the grid should sit.
Not doable. This is only possible in
axes=8mode (which I almost never use as I find it spoils the feeling of spatial orientation).