Vedo: Coloring isosurfaces and voxels in numpy array
Hey
i have been using vtkplotter and its really awesome how you can do so much with so little code. I have been using it visualize volumetric data of the mouse brain and i have some doubts. My input data is a list of brain structures with associated voxels. I create a volume object and then use isosurfaces to extract the mesh. Now i want to color the different structures whose voxels i know according to different colors in the isosurfaces as well (if i can get a mesh i can smooth it and make it look prettier)
Once i have this i have a list of gene expression values for the voxels. I want to then color the voxels with the intensity of the gene expression values. We can think of this as some list of values for each voxel in a structure and then i want the color to have a gradient that follows these provided values.
I havent been able to do the visualization of the voxel values according to gene expression values. I feel that if i change the labels according to the gene expression values then i can see the colors but i dont know if perceptually it will look good. Also it would be nice to figure out how to set the colors of the different voxels in isosurface.
Thanks once again for this amazing tool
vol = Volume(rg, c = colors_)
    labels = list(label_dic.values())
    ts = [i for i in range(0, np.amax(labels), 5)]
    vol = Volume(rg, c=colors_)
    isos = vol.isosurface(threshold=ts)
    isos = isos.opacity(alpha = 0.3)
 anorak94
All 11 comments
Uhmm.. the quetion sounds a bit complicated... Let me see if I understand it correctly:
- You have a volume with multiple scalars associated to each voxel
- You want to color the isosurface of one of the voxel scalars with the values that correspond to the position of such surface of another of the voxel scalars
(note that _isosurface_ means by definition that all its points have the same value of a scalar)
If this is correct there is a possible solution using point probing and interpolation (dont worry I can work out an example for you if you need it)
it would be nice to figure out how to set the colors of the different voxels in isosurface.
You cannot! An isosurface is a 2D polygonal mesh it doesn't have voxels :)
i have been using vtkplotter and its really awesome how you can do so much with so little code.
Thanks for your feedback with using the package!
 marcomusy
on 15 May 2020
marcomusy
on 15 May 2020
I have a volume. That volume has multiple structures inside it. Each of these structures has a distinct label associated with it. So say volume is A. It has structures inside it a, b, c etc all voxels which belong to "a" are labelled i. all voxels which belong to "b" is labelled j and so on.
I want to color each of these structures differently(in the mesh and in the volume object in vtkplotter).
Also I have multiple variables that take different values in these voxels. I want to pass the value of these variables and color the voxels or the mesh i get from the voxels with a intensity value proportional to the value of the variable in these voxels. So say structure "a" has voxel i, j, k etc and variable x takes values xa, xb, xc in these voxels. I want to color the voxel i, j, k with the same color say k and the intensity of this color k is proportional to xa, xb, xc so that i can see the gradient or the hue of this variable x in these voxels. Also it will be nice to have a blending of colors so that i can visualize multiple variables at the same time in the volume.
It would be nice if i could transfer the coloring of the voxels in the volume object to the generated mesh although that is not a priority and simply having this volumetric colored view would be great as well
In the k3d embedded window, when i convert to a mesh. there is a checkbox which is labelled mesh 1. It would be great if i could generate checkboxes for each of the different structures in my volumetric data and toggle them on or off to see the value of these variables in different structures
This is the link to the data and the python notebook i have so far. The visualizations look amazing and its really intuitive for my use case. Some of the other papers which try to do this kind of thing restrict themselves to just viewing 2d slices of the volumetric data and that is just so clunky whereas with vtkplotter it looks much better and is more intuitive so im kind of thankful i discovered it. I was going through the issues section and i found something which i think might work for me its called i think (RGB(A) from numpy data or something but i still dont know how to do the mesh part and it would be great to know what you think would be the right way to go about doing this kind of thing)
Thanks
Anurag
anorak94
on 16 May 2020
Hi Anurag, I see a couple of issues, probably in the terminology..
A Volume cannot have an "internal structure" unless you're calling "volume" a set of elementary Volume objects.
Think of a Volume as sort of cubic grid of voxels (analogous to the pixels of a 2D image).
Infact your load_volume() function should be called load_surface() because it doesnt return the volume (it actually returns it as second argument but you dont use it)
I could not run your notebook because I miss imports:
from brainmap import ...
from mapper.ish_utils import *
I think it would be easier if you attach some snapshot of the images you have as output .
You can also send one of these volumes as vti - you can save it with
vtkplotter.write(vol, 'filename.vti')
Also have a look at these examples to see if anything fits your purpose.
Cheers, M.
marcomusy
on 16 May 2020
hey marco
so should i split my volume object into elementary volumes each containing only one structure and then display all the volumes together. Can an isosurface have interenal structure.
The imports are not needed. i provide the final data file you would get after usiing functions that use those imports so you dont need to run those imports but i think theres a way to do it ill try and let you know
thanks
anorak94
on 16 May 2020
so should i split my volume object into elementary volumes each containing only one structure and then display all the volumes together. Can an isosurface have interenal structure.
it all depends on what you mean by "internal structure".. and how these are positioned in space.
An isosurface is nothing but a polygonal mesh, made of vertices and faces. Both verts and faces can hold any number of vectorial or scalar properties.
The imports are not needed. i provide the final data file you would get after usiing functions that use those imports so you dont need to run those imports but i think theres a way to do it ill try and let you know
ok!
marcomusy
on 16 May 2020
isos_list = []
vol_list = []
ts = [i for i in range(0, 100, 1)]
for k, v in vol_dic.items():
    vol_i = Volume(v, shape=(w,h,z), mode=0)
    isos_i = vol_i.isosurface(threshold=ts)
    isos_i = isos_i.opacity(alpha = 0.3)
    isos_i = isos_i.smoothWSinc(niter=200, passBand=0.1, edgeAngle=15, featureAngle=100)
    isos_list.append(isos_i)
    vol_list.append(vol_i)
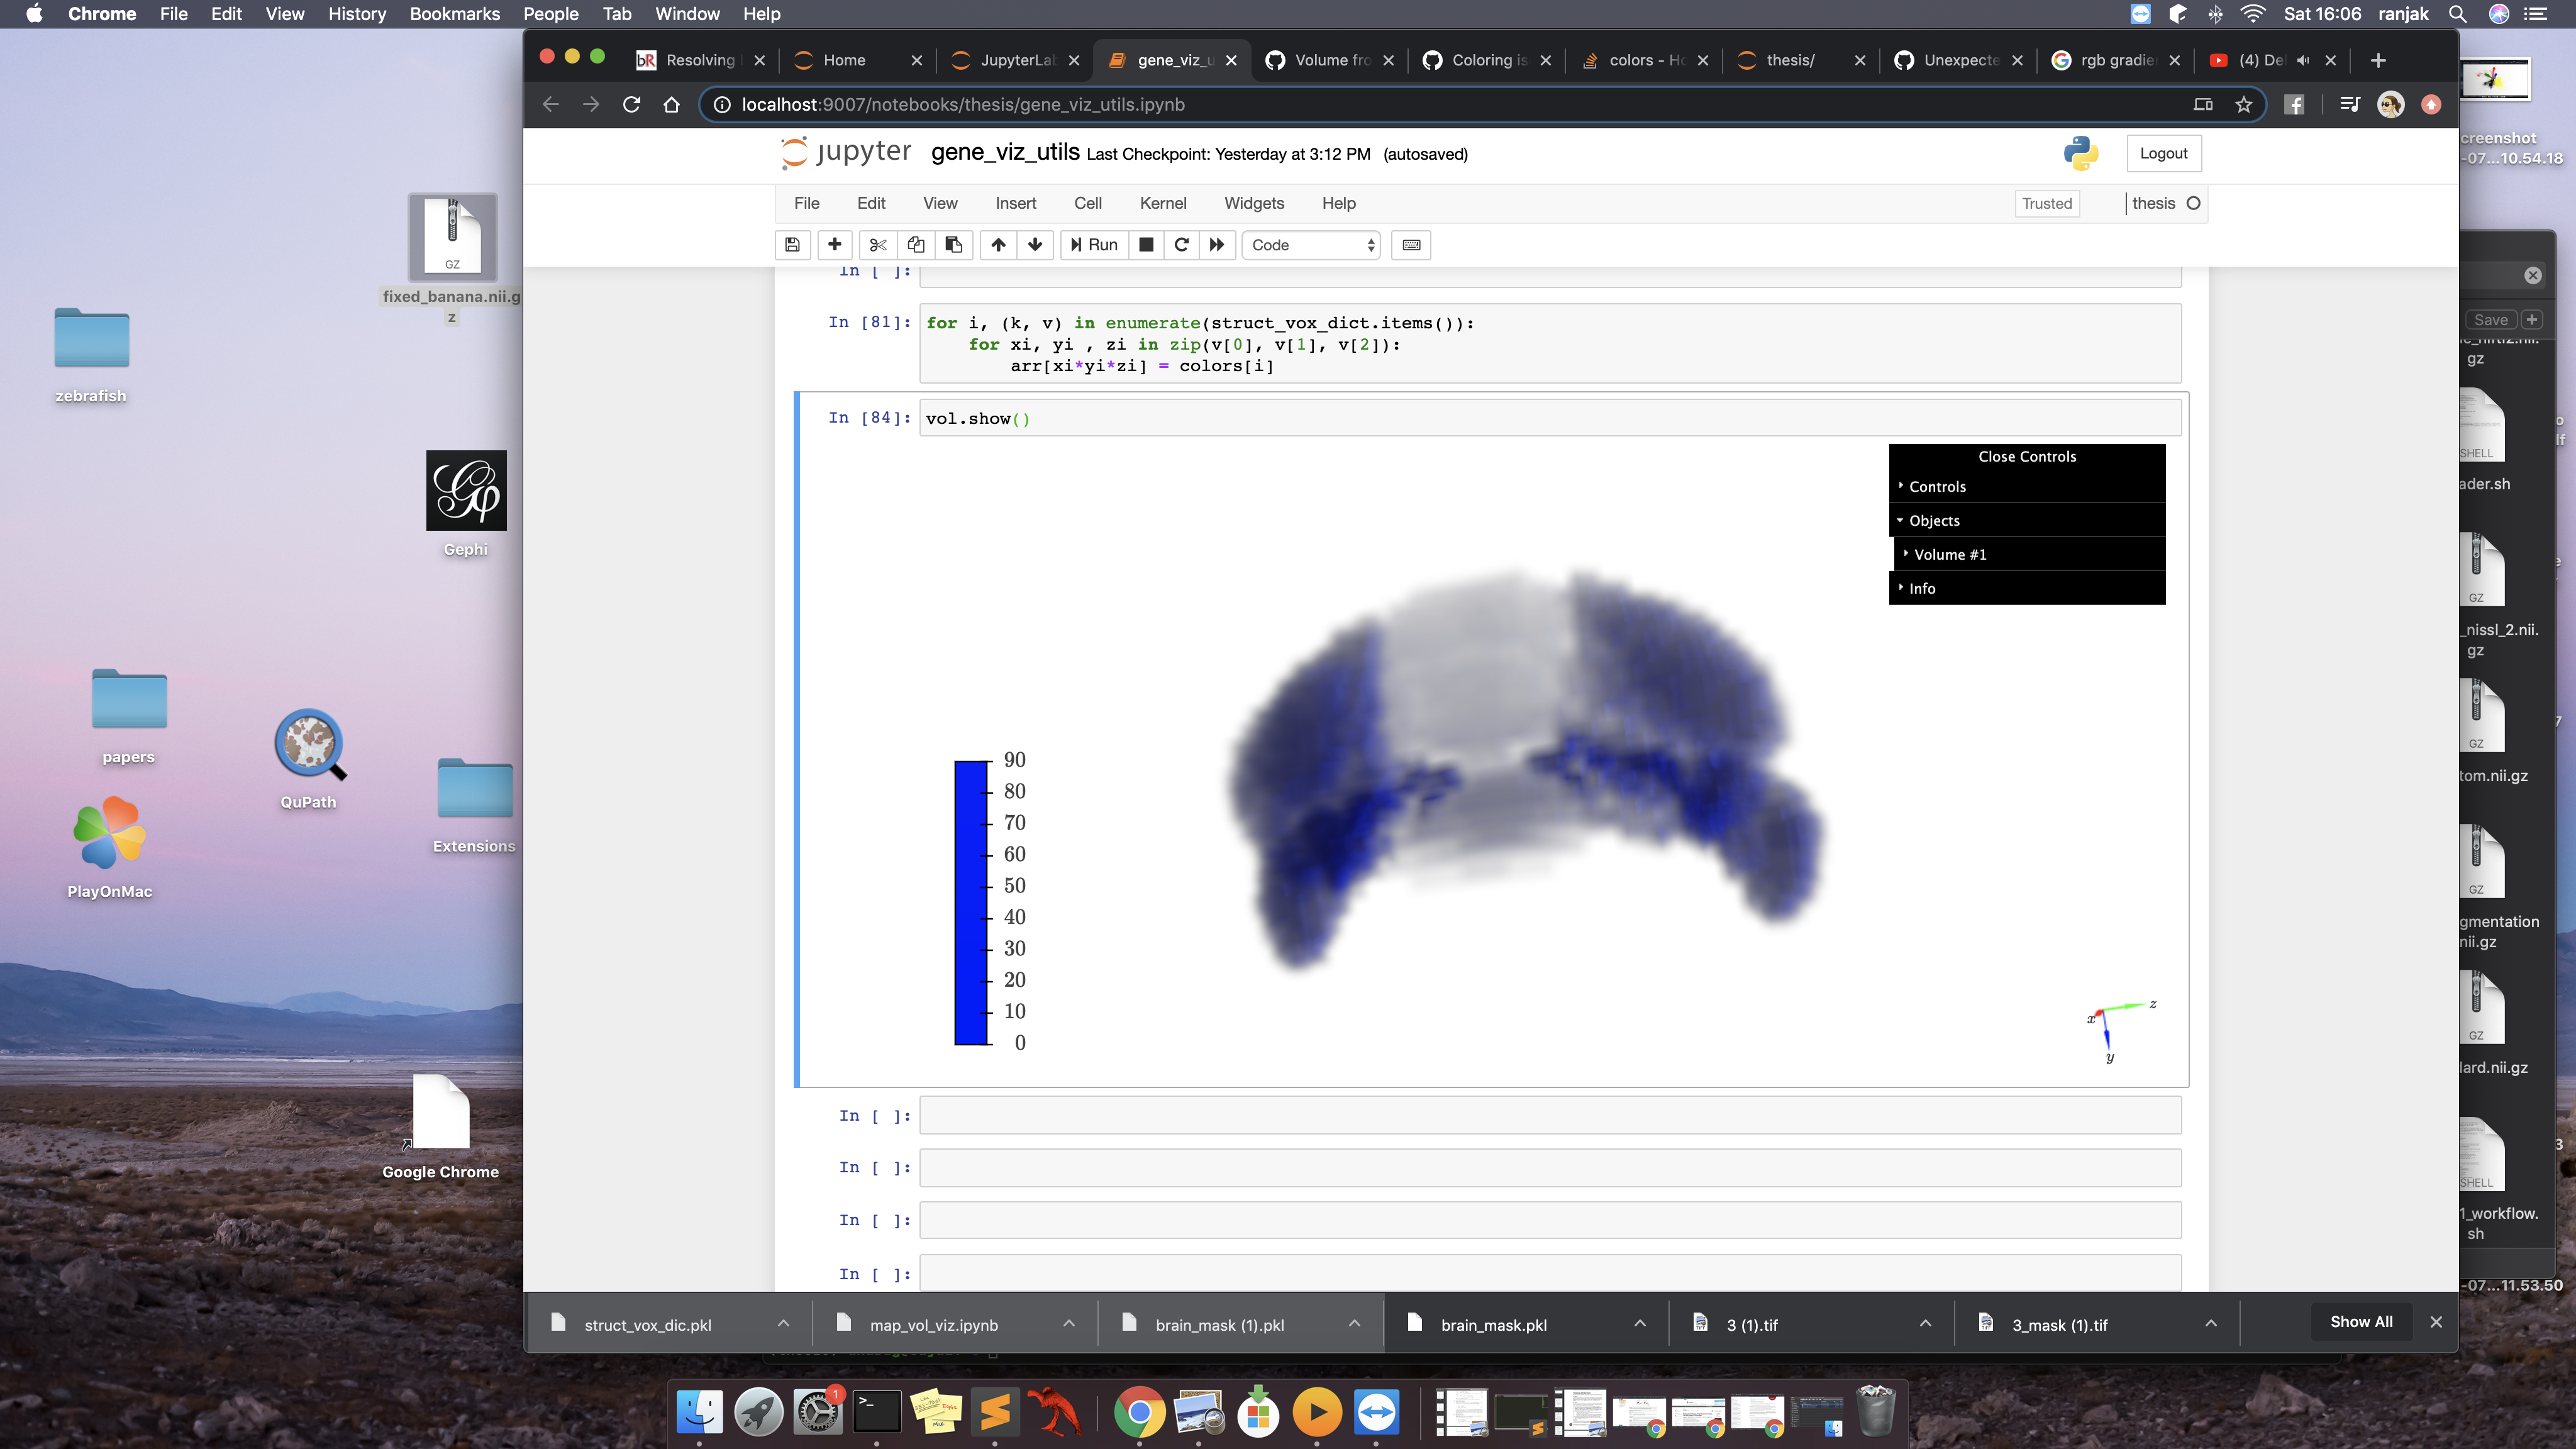
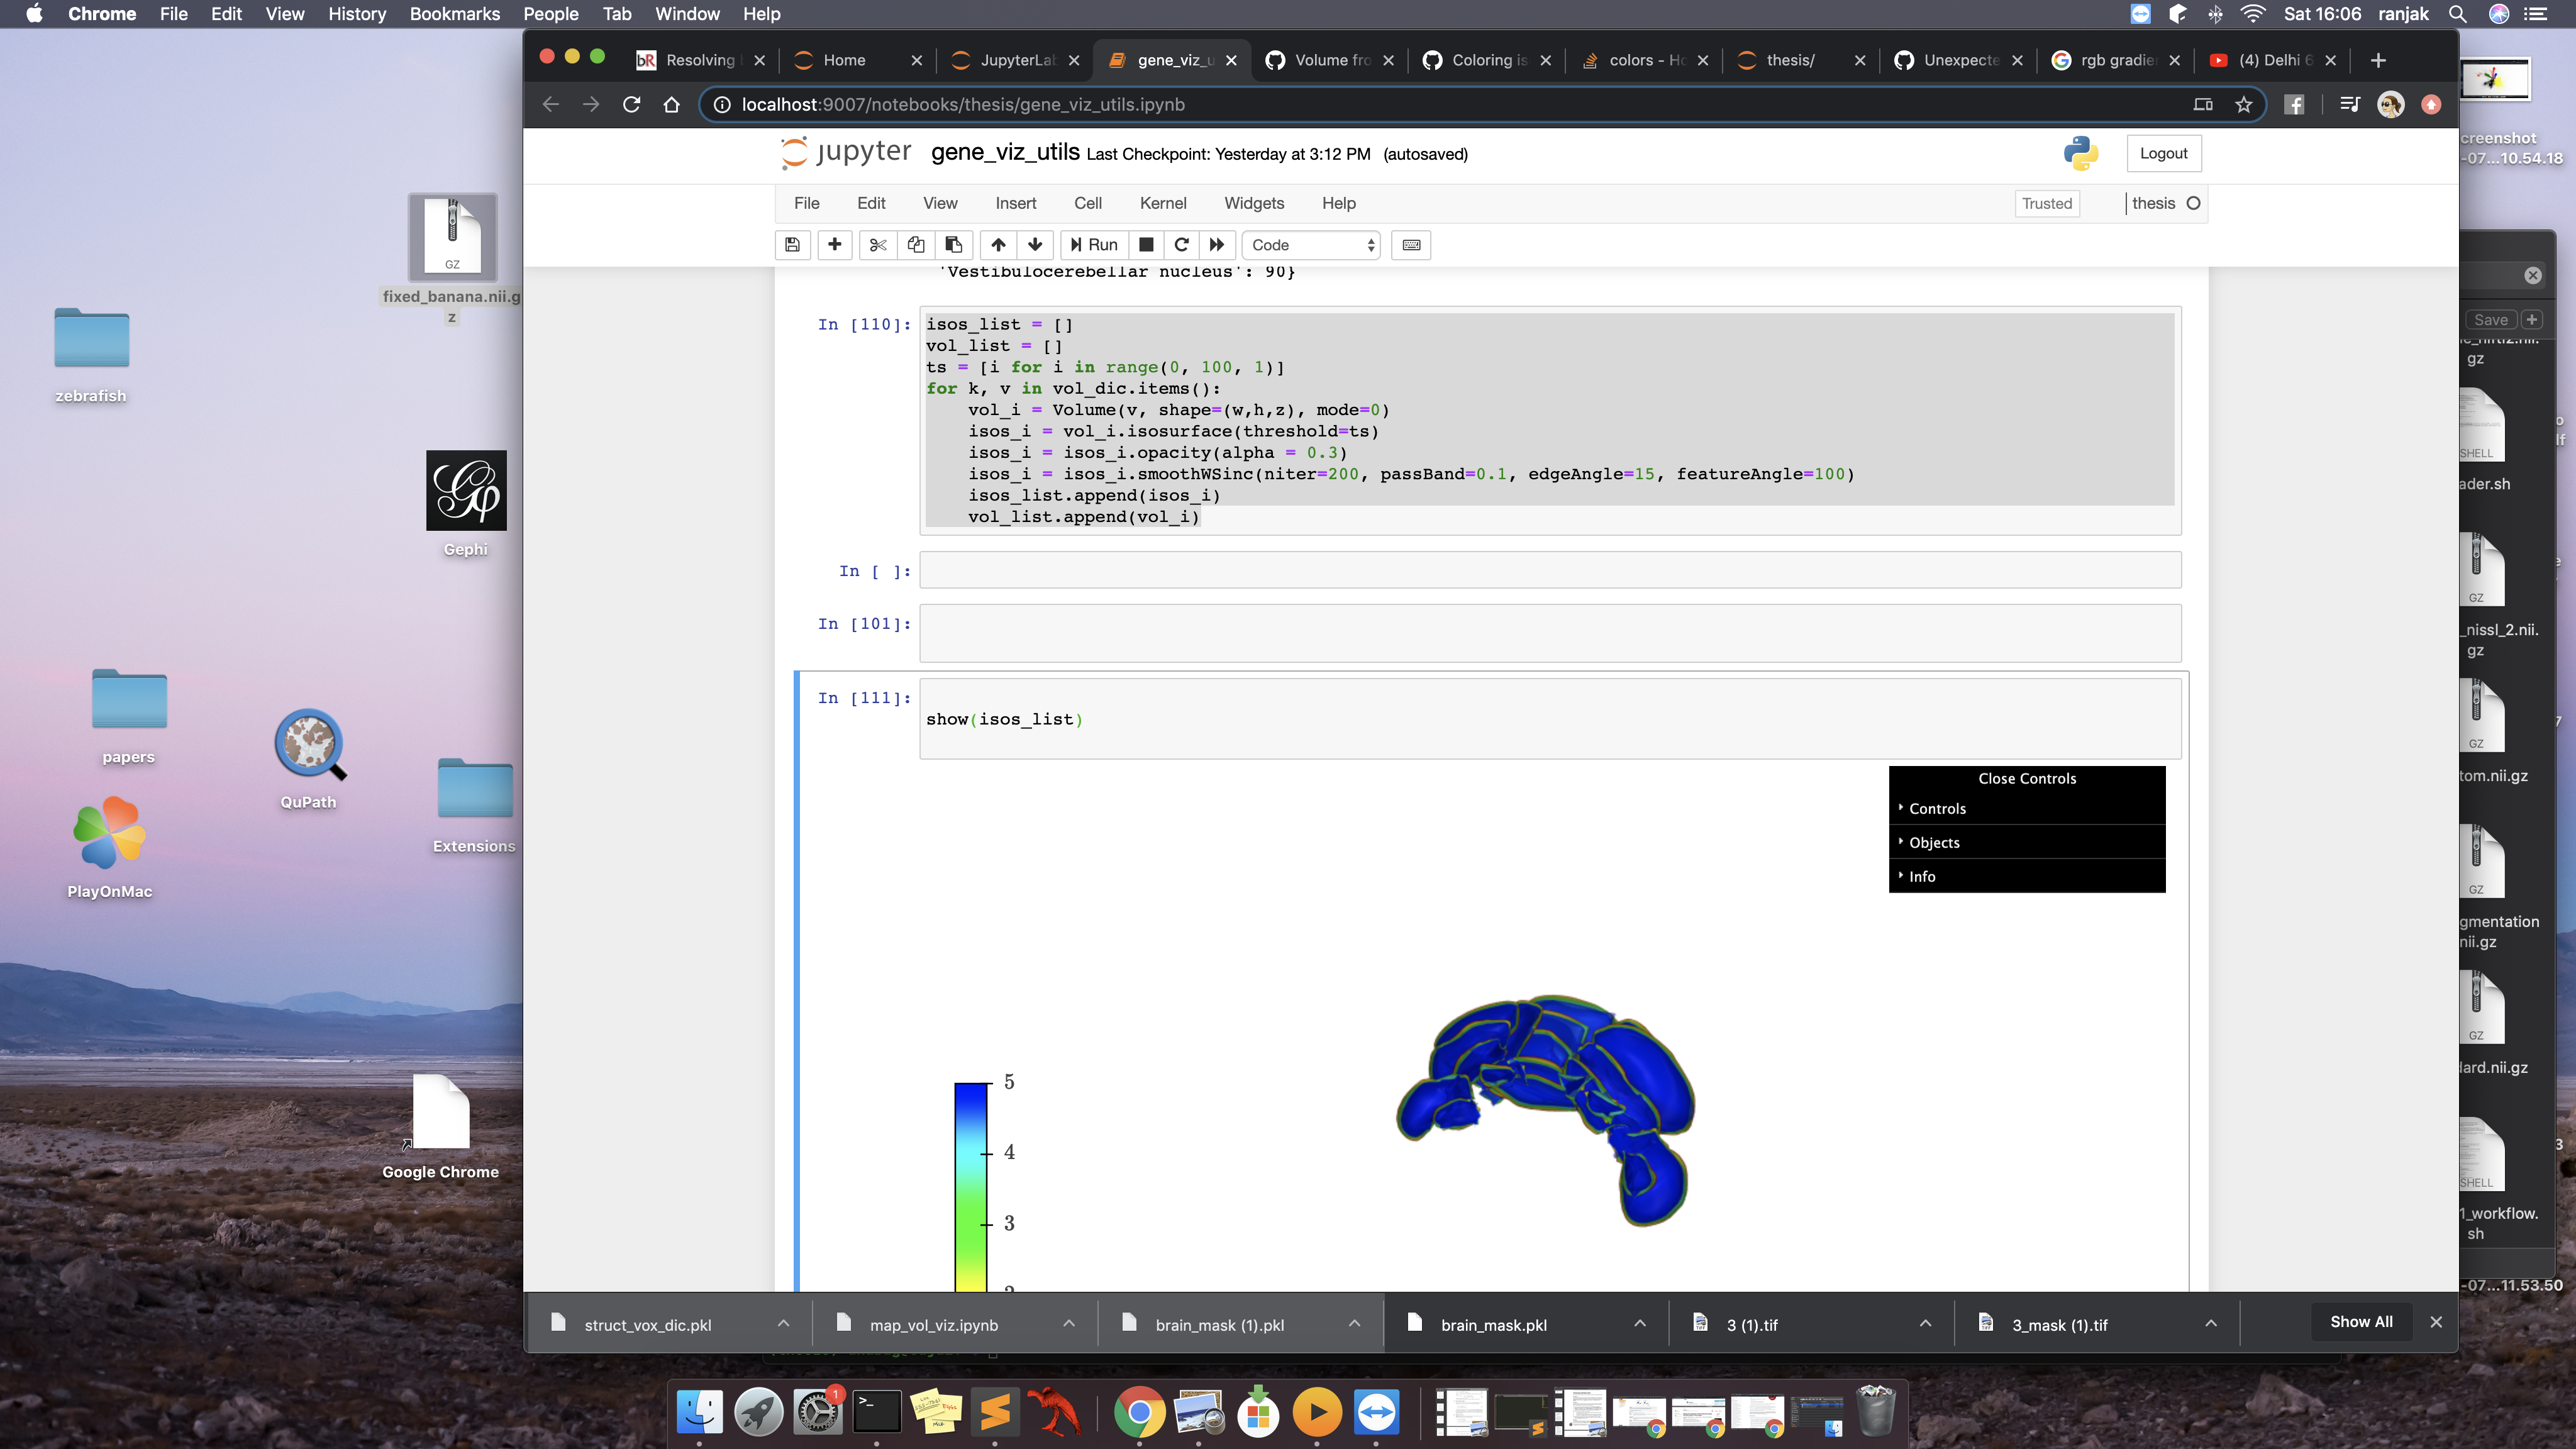
I split up my volume into multiple volumes each containing different structures and then i display them together.
I understand that the mesh has vertices and faces and so there is no question of displaying voxel properties in the mesh. So i will have to display the values of these variables in the volume object.
This is what i get as mesh and volume when i display all structures together. Now im trying to color the voxels in the volume according to the value of the variables in these voxels. I want to set the same color but with intensity varying according to the value of these variables. i think this will help
https://github.com/marcomusy/vtkplotter/issues/106
anorak94
on 16 May 2020
I have a volumetric array rg_tmp with unique labels 0 - background, 1 - soft background which i want to be visible and 50 the object of interest.
When i display this volume i get something like
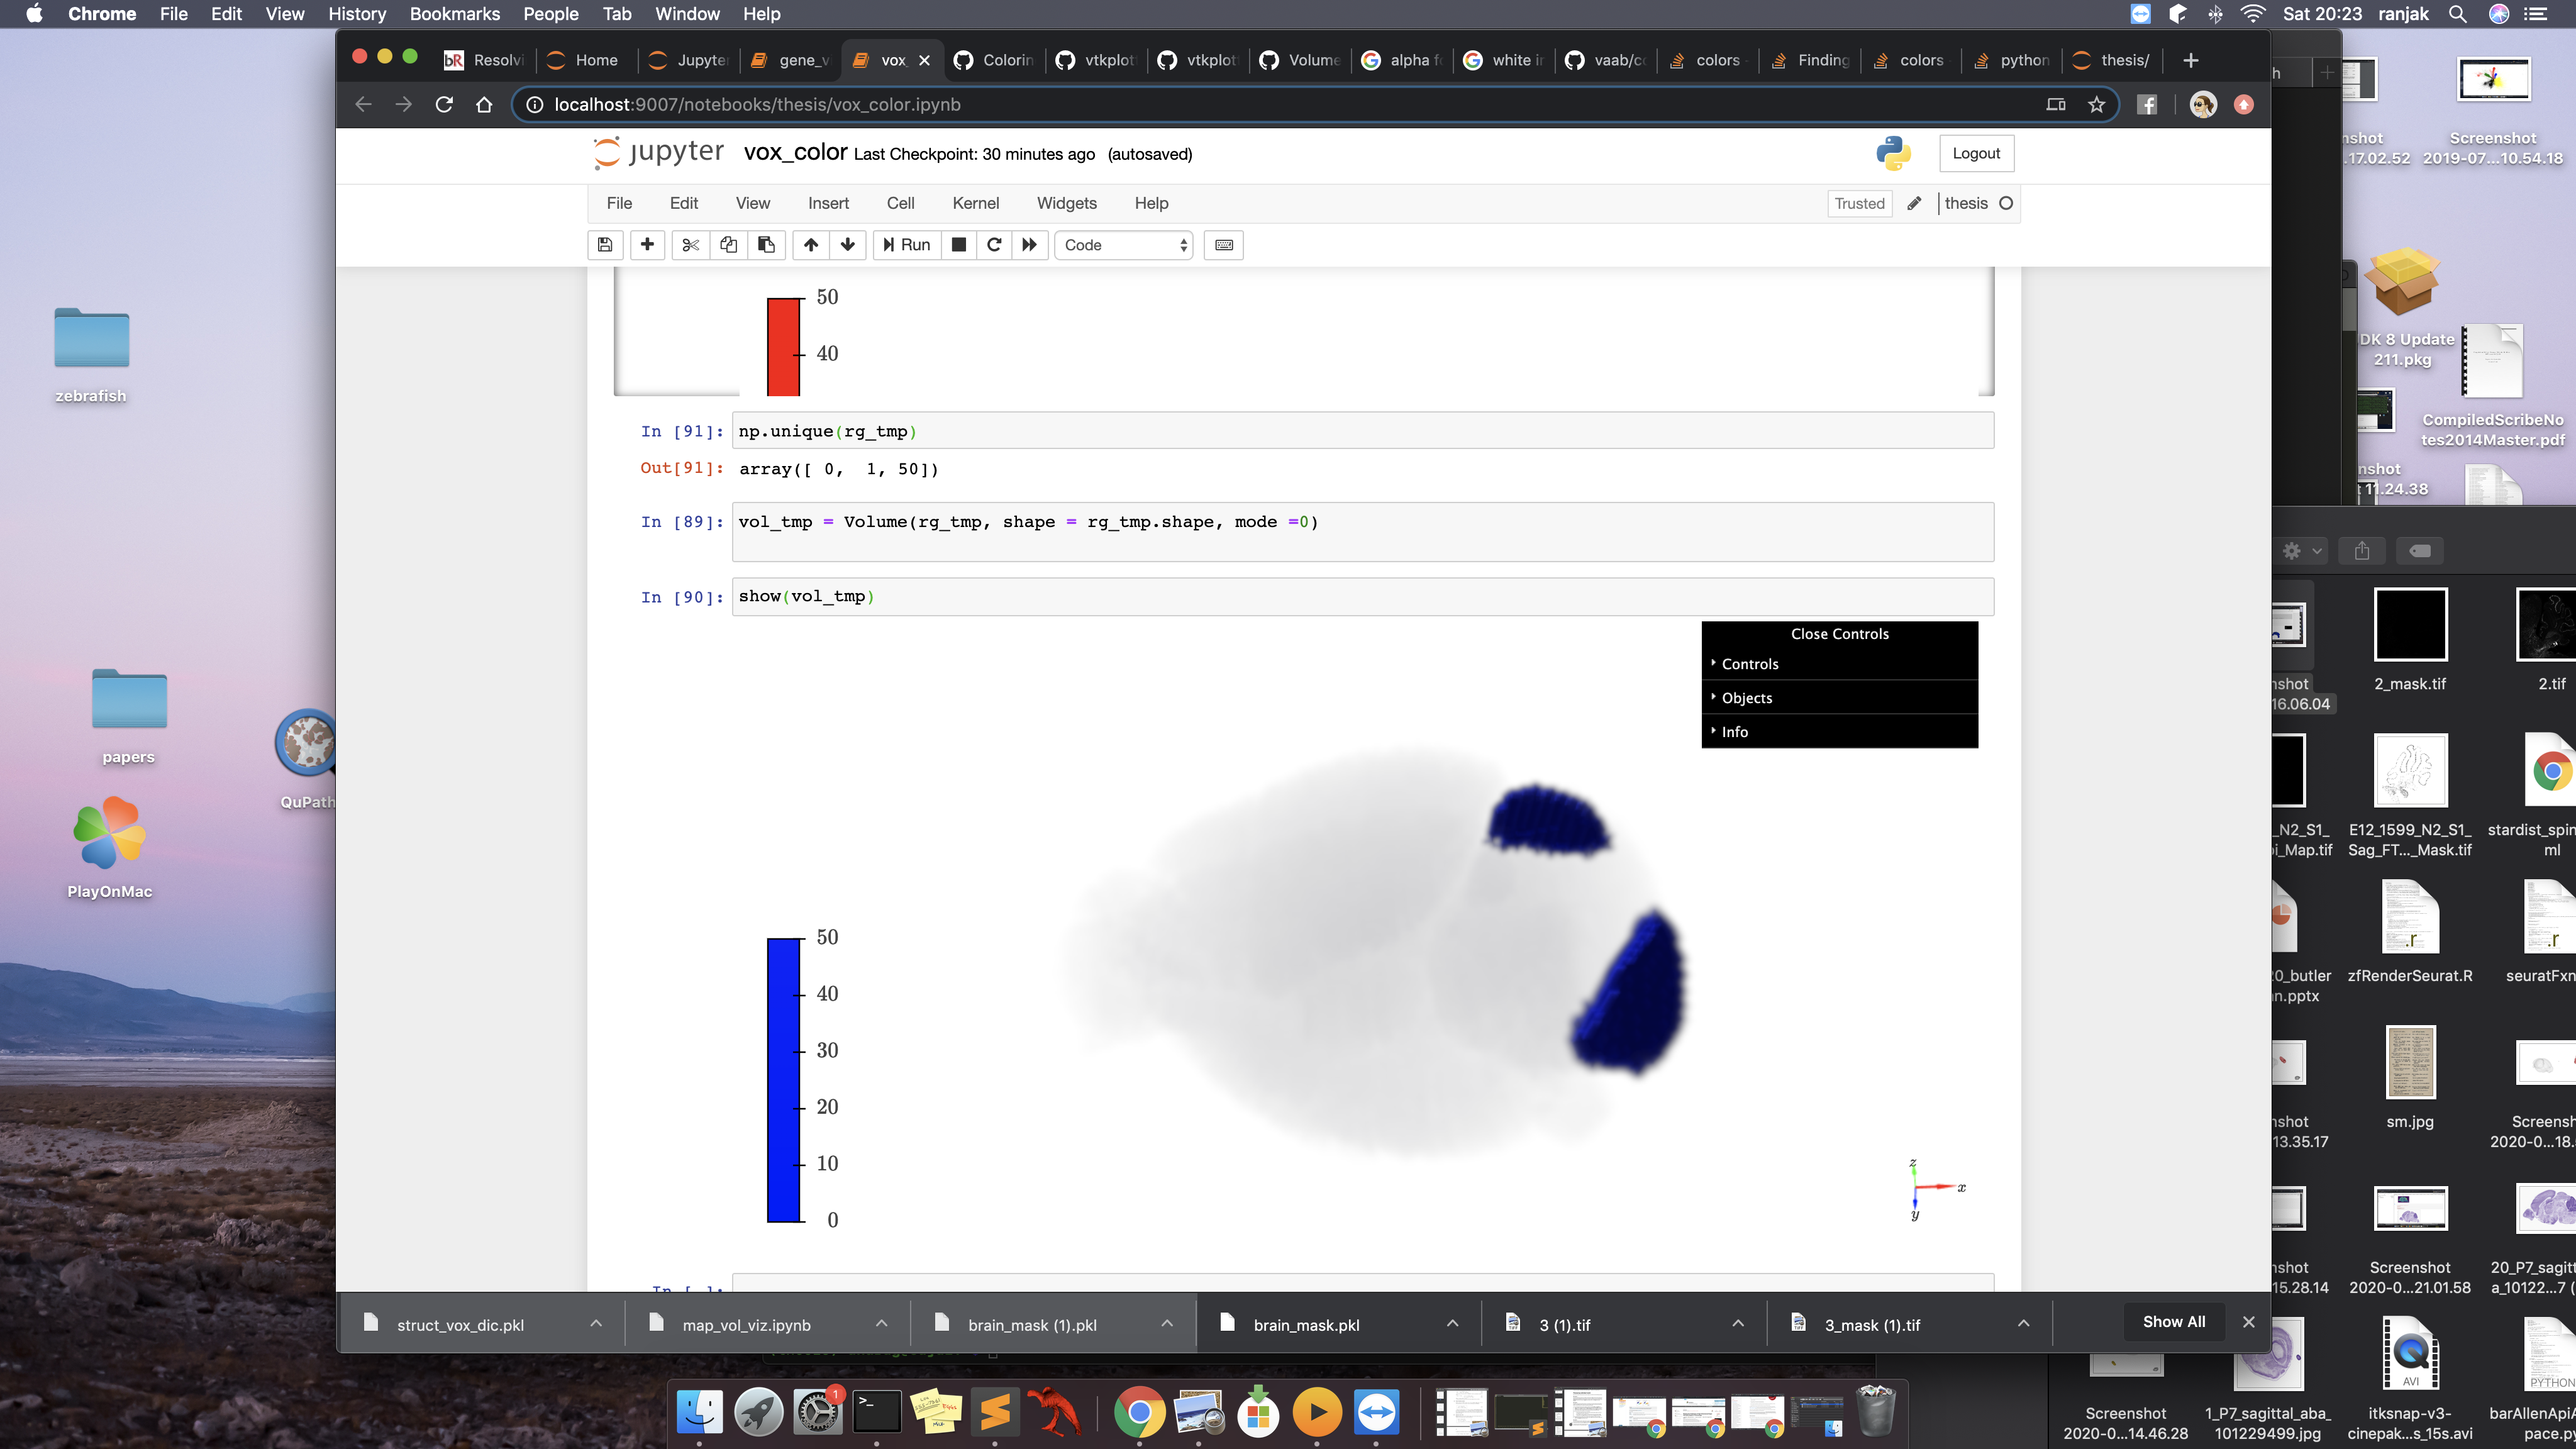
which is what i expect. Then i try to color the individual voxels follwoing the example in the issues section
ind_0 = np.where(rg_tmp == 0)
ind_1 = np.where(rg_tmp == 1)
ind_50 = np.where(rg_tmp == 50)

vol = Volume(None, shape=rg_tmp.shape, mode=0)
vol.GetProperty().IndependentComponentsOff()
vol.GetProperty().SetInterpolationTypeToNearest()


img = vol.imagedata()
img.AllocateScalars(vtk.VTK_DOUBLE,4)
for x, y, z in zip(ind_50[0], ind_50[1], ind_50[2]):
    img.SetScalarComponentFromDouble(x,y,z,0,255)
    img.SetScalarComponentFromDouble(x,y,z,1,0)
    img.SetScalarComponentFromDouble(x,y,z,2,0)
    img.SetScalarComponentFromDouble(x,y,z,3,1.5)

for x, y, z in zip(ind_0[0], ind_0[1], ind_0[2]):
    img.SetScalarComponentFromDouble(x,y,z,0,255)
    img.SetScalarComponentFromDouble(x,y,z,1,255)
    img.SetScalarComponentFromDouble(x,y,z,2,255)
    img.SetScalarComponentFromDouble(x,y,z,3,0.0)


for x, y, z in zip(ind_1[0], ind_1[1], ind_1[2]):
    img.SetScalarComponentFromDouble(x,y,z,0,150)
    img.SetScalarComponentFromDouble(x,y,z,1,0)
    img.SetScalarComponentFromDouble(x,y,z,2,0)
    img.SetScalarComponentFromDouble(x,y,z,3,0.3)

vol = vol._update(img)
show(vol)
and i get something like
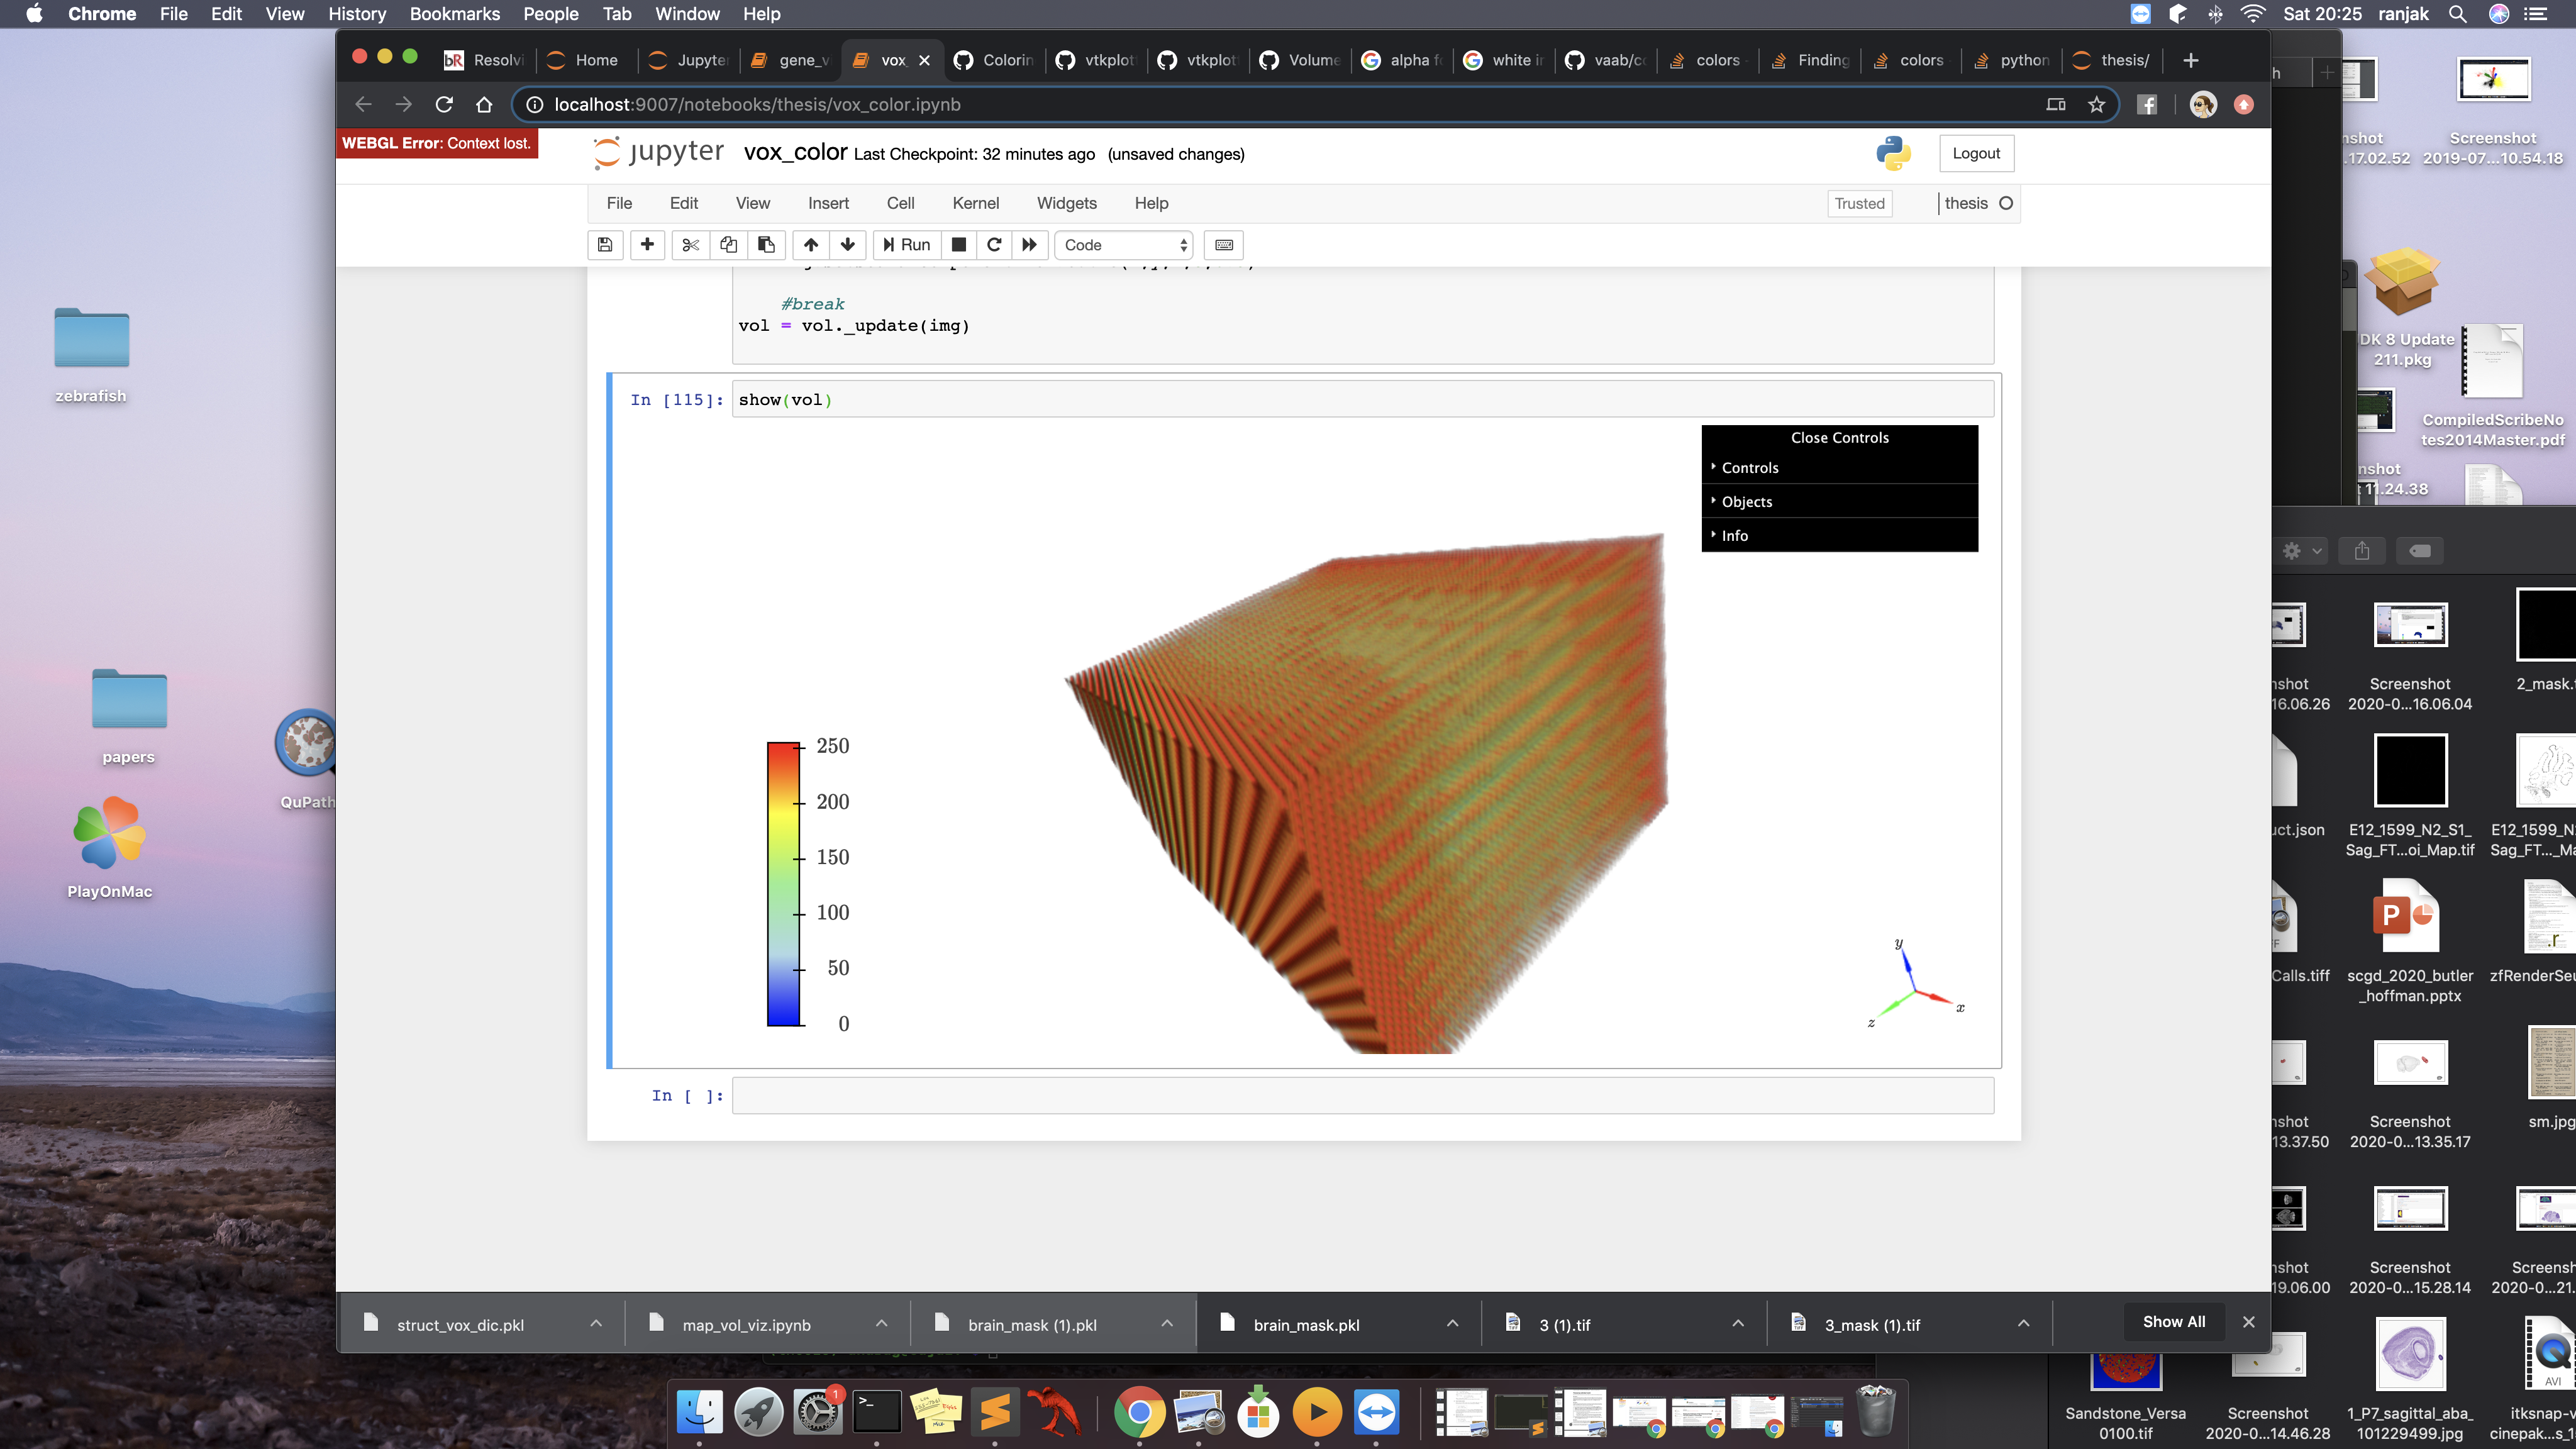
when the output i want is the blue structure in previous picture to be colored red and the background (0 as invisible) and the soft background(1) an intermediate shade of red. Can you help me with what might be going wrong
Best
Anurag
link to the data - https://we.tl/t-cxdjmHbRL2
anorak94
on 16 May 2020
Hi, I think I found a better solution that will not need you to split regions.
Do:
pip install -U git+https://github.com/marcomusy/vtkplotter.git
Then:
"""A Volume can have multiple
scalars associated to each voxel"""
from vtkplotter import *
import numpy as np
import pickle

with open('rg_tmp.pkl','rb') as f: arr = pickle.load(f)

vol = Volume(arr).printInfo()
nx, ny, nz = vol.dimensions()
r0,r1 = vol.scalarRange()
vol.addScalarBar3D(title='original voxel scalars')

# create a set of scalars and add it to the Volume
sc1 = np.linspace(r0,r1, num=nx*ny*nz)#.astype(np.uint8)
vol.addPointArray(sc1, "myscalars1")

# create another set of scalars and add it to the Volume
sc2 = np.random.randint(r0,r1, nx*ny*nz)
vol.addPointArray(sc2, "myscalars2")

# make input_scalars the active array (can set 0, to pick the first):
printc('Arrays in Volume are:\n', vol.getArrayNames(), invert=1)
vol.getPointArray('input_scalars')

# Build the isosurface of the active scalars,
# but use testscals1 to colorize this isosurface, and then smooth it
iso1 = vol.isosurface().pointColors('myscalars1').smoothWSinc().lw(0.1)
iso1.addScalarBar3D(title='myscalars1')

iso2 = vol.isosurface().pointColors('myscalars2', cmap='viridis')
iso2.addScalarBar3D(title='myscalars2')

show([(vol, __doc__),
      (iso1,"Colorize isosurface using\nmyscalars1"),
      (iso2,"Colorize isosurface using\nmyscalars2"),
     ], N=3, axes=1)

marcomusy
on 18 May 2020
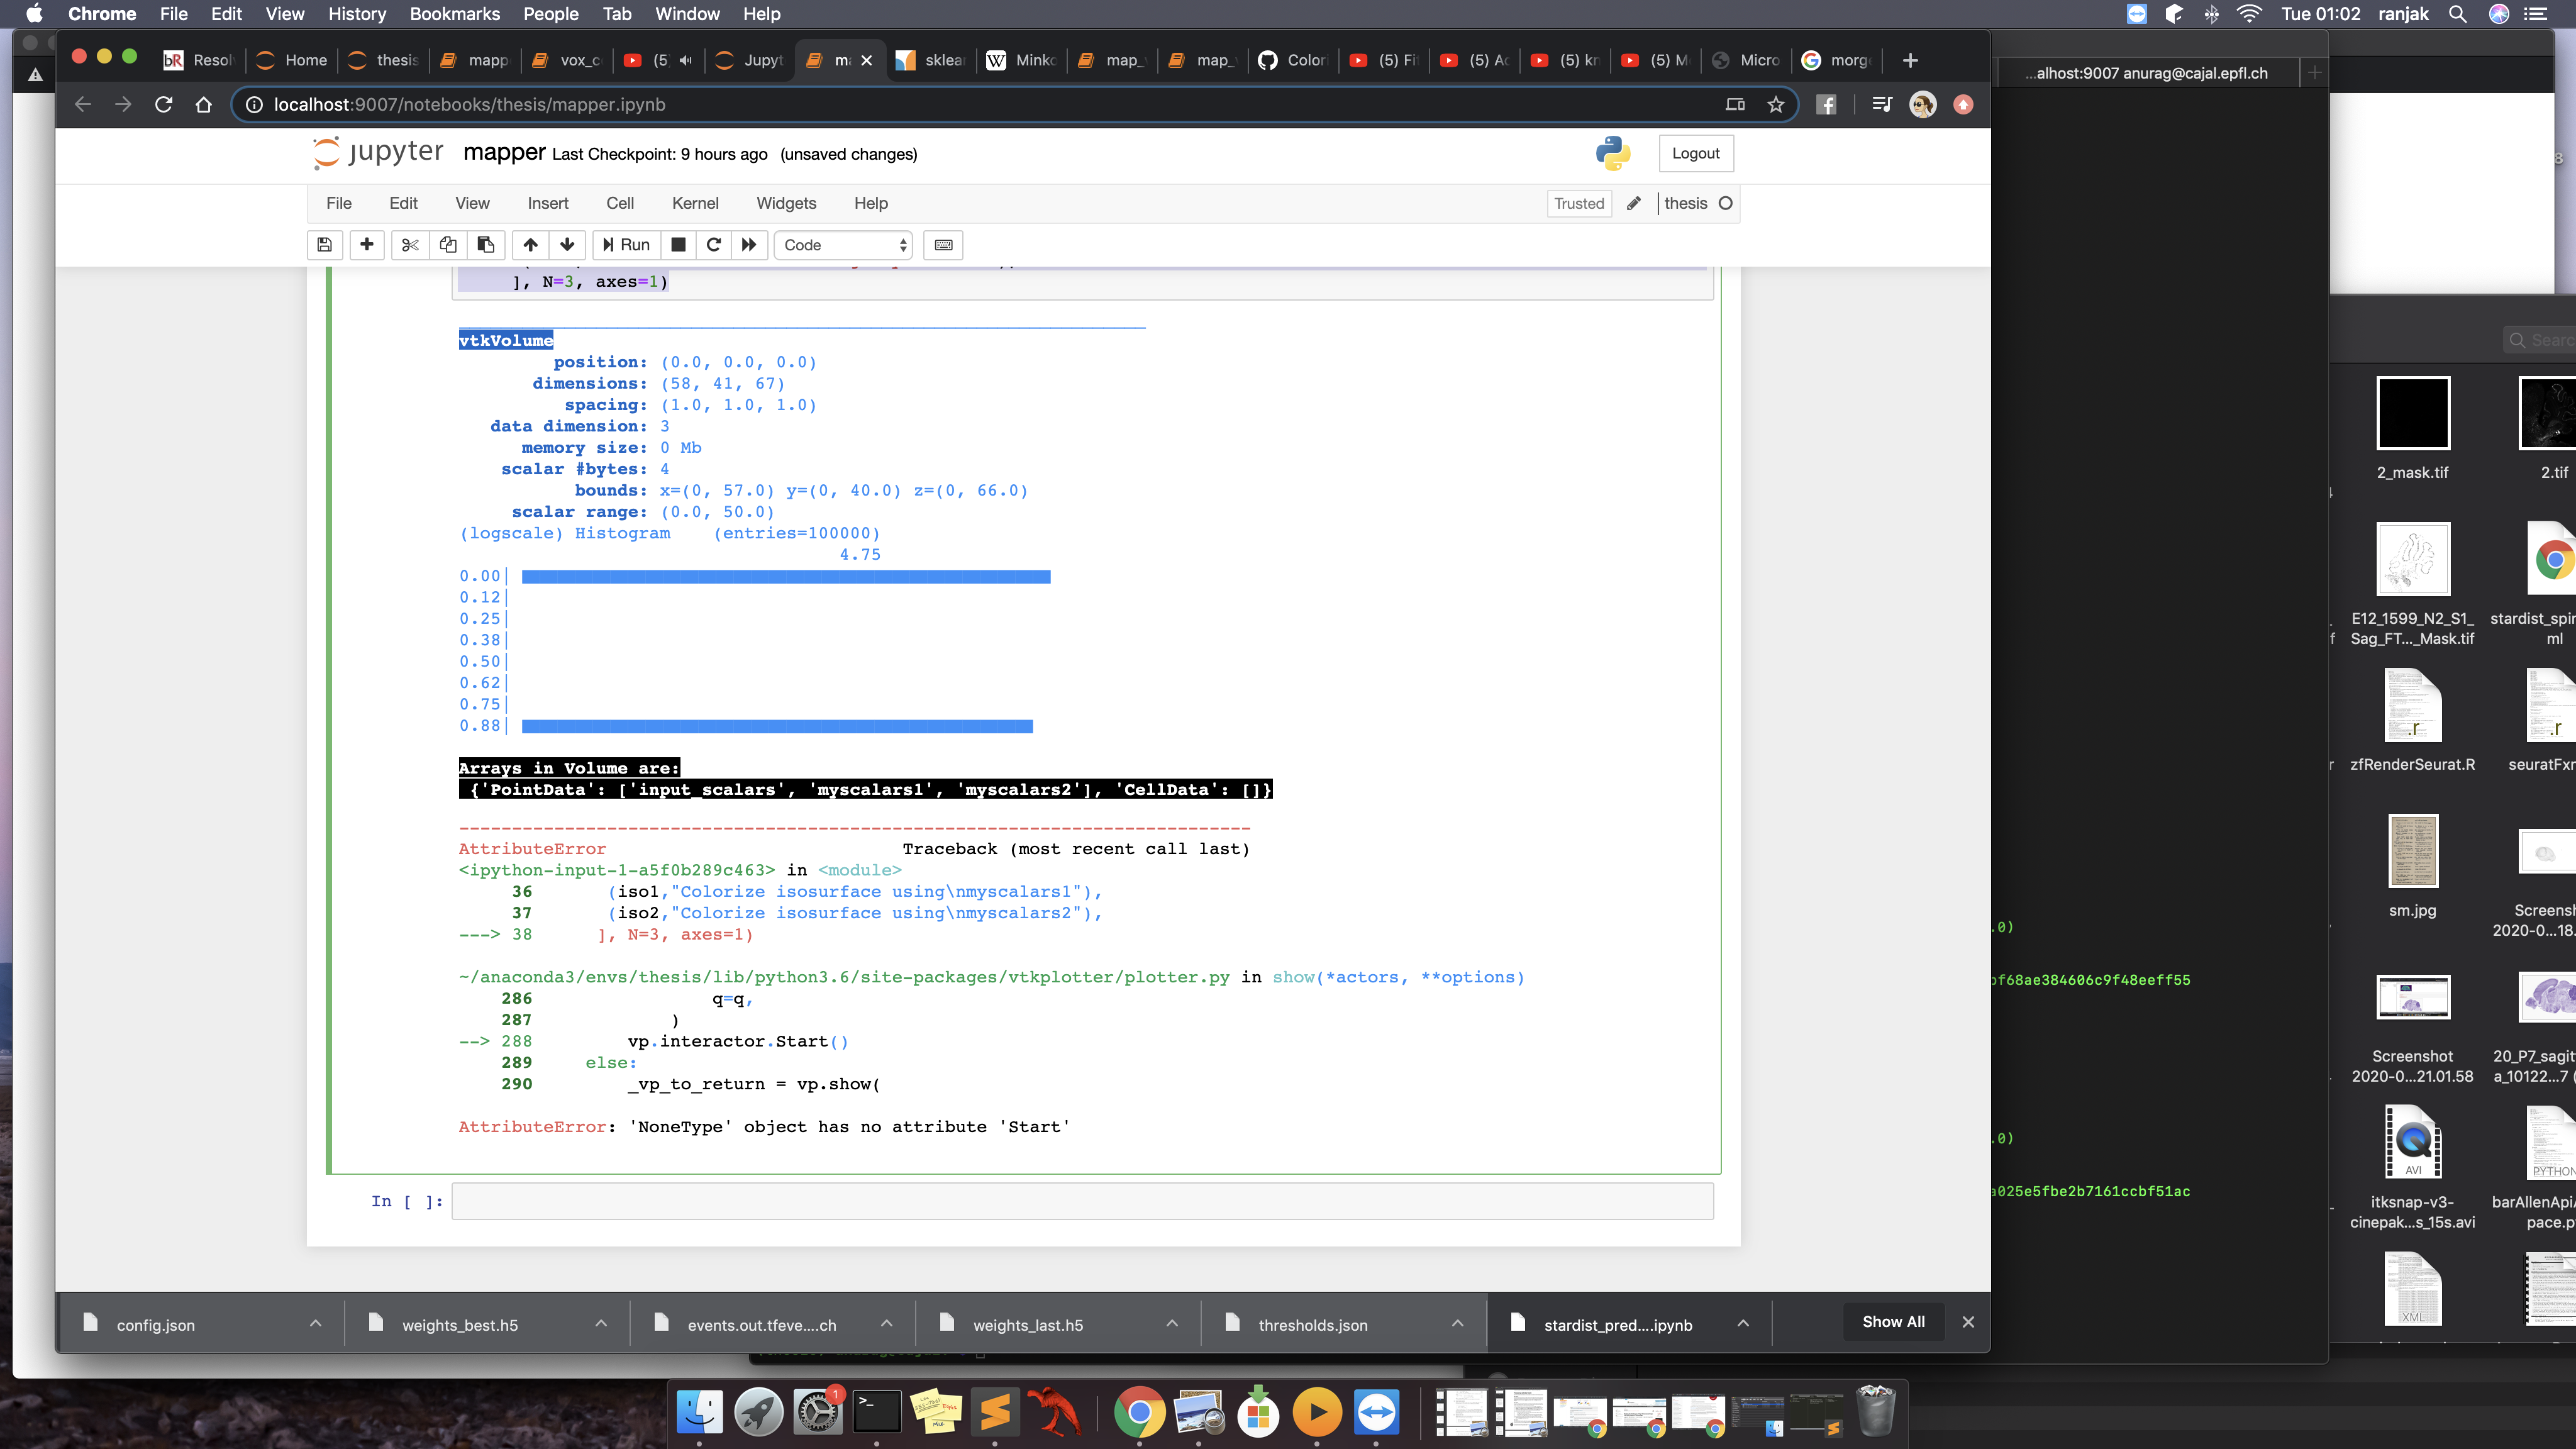
i get this error i add embedWindow("k3d") and run it in a jupyter notebook
anorak94
on 19 May 2020
show((vol, __doc__),(iso1,"Colorize isosurface using\nmyscalars1"))
doing it in this format helps also thanks for the passing __doc__ part argument that changes the name of the volume object
anorak94
on 19 May 2020
sorry the doc doesnt do anything but the name works now
anorak94
on 19 May 2020
Related issues
 Jesse0818
·
4Comments
Jesse0818
·
4Comments
 drew-parsons
·
7Comments
drew-parsons
·
7Comments
 bhaveshshrimali
·
6Comments
bhaveshshrimali
·
6Comments
 jby1993
·
6Comments
jby1993
·
6Comments
 vianamp
·
3Comments
vianamp
·
3Comments