Umap: Standardizing data before applying UMAP
Is standardization required before applying UMAP method on the dataset. I have gone through the notebooks provided, but the toy data used is from uniform distribution for which values are in [0,1).
If standardization is required, how critical is it when compared to standardization before applying PCA. PCA gives quite different results(rightly so) with/without standardization and with/without the presence of outliers.
 ravimulpuri
All 7 comments
I think the primary thing that is required is for distances (at least locally) to be meaningful. That may require standardisation -- e.g. if you are measuring weight in grams and height in meters then euclidean distance is going to look a little strange unless you do some standardisation. So the real question is what does distance mean for your data (including what distance metric you want to choose).
 lmcinnes
on 3 May 2018
lmcinnes
on 3 May 2018
Thanks for your prompt response. The dataset that I am using has lot of variables including temperature, pressure, and lot of other measurement data from sensors which measure varying things like, what is the vibration , what is the deviation from expected value etc. So I guess, standardization is important since the variables are distinct in their values(range) and interpretation.
ravimulpuri
on 3 May 2018
Given their independence yes, I would suggest that standardisation would make sense. Further, given the independence you might want to consider using l1 (manhattan) distance instead of euclidean distance.
lmcinnes
on 3 May 2018
Thanks for pointing that out. Manhattan distance makes sense after going through this paper on the behavior of distance metric in higher dimensions. https://bib.dbvis.de/uploadedFiles/155.pdf
ravimulpuri
on 3 May 2018
HI,
I have same issue. Currently, I am analyzing proteome expression data and trying to find subtypes by using UMAP.
Data shape is like RNAseq (raw:5000-10000 protein name, column: each sample name).
Protein raw expression value range from 0 to 1E12. Distribution is not gaussian. When I log-transformed the values, it is more closer to gaussian.
UMAP result with protein raw value (euclidean distance used as default) found clear subtypes.
The result was more clear than log transformed data.
Here, my question is "Do we have to input data whose distribution is gaussian to UMAP?"
Or can we input non-gausssian data to UMAP?
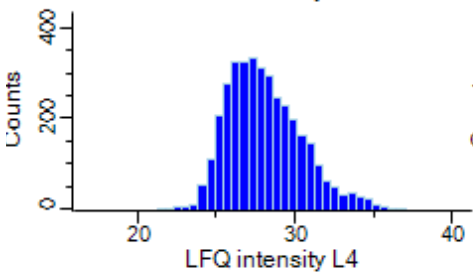
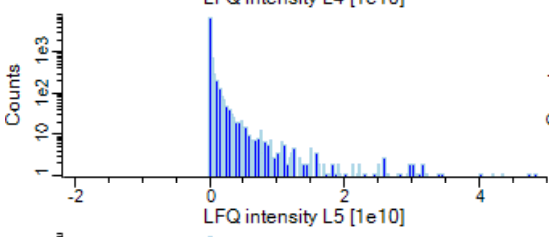
 TnakaNY
on 30 May 2020
TnakaNY
on 30 May 2020
Hi there,
There is definitely no gaussian assumption under UMAP so you can most
definitely input non-gaussian data into UMAP. The key thing to keep in
mind is that you need to have a good notion of what you want distance
between your data points to mean. If one of your axis (columns, variables,
...) has values that range from 0 to 10^5 and you think you should be
looking at L1 or Euclidean distance than any other protein that doesn't
match that extremely high value will be very, very far than your point,
even if it matches your expression levels perfectly on every other column
(or sample). Often times, folks don't want that to happen, in those cases
normalizing your columns can mitigate this effect. A log transform
essentially down weights extreme values. Saying that the difference
between 510^5 and 5.510^5 isn't that massive, while still allowing the
differences between 5 and 5.5 to be meaningful down at the other end of
your scale.
Normalizing via centering your data and dividing by the standard deviations
is an easy way to shift multiple columns that are on different scales to be
on a single comparable scale. All your data are now on the the scale of
standard deviations.
Applying a log transform is a method for down-weighting extreme values and
preventing them from swamping all your results.
A good rule of thumb is that if you plot all your column distributions on
the same (non-log) scale and one of them crushes all the others then it
will very likely dominate all your distance calculations and you might want
to mitigate that. It's all about what you decide is a meaningful distance
between your points.
Hopefully, this helps a bit.
On Sat, May 30, 2020 at 12:31 PM TnakaNY notifications@github.com wrote:
HI,
I have same issue. Currently, I am analyzing proteome expression data and
trying to find subtypes by using UMAP.Data shape is like RNAseq (raw:5000-10000 protein name, column: each
sample name).
Protein raw expression value range from 0 to 1E12. Distribution is not
gaussian. When I log-transformed the values, it is more closer to gaussian.UMAP result with protein raw value (euclidean distance used as default)
found clear subtypes.
The result was more clear than log transformed data.
Here, my question is "Do we have to input data whose distribution is
gaussian to UMAP?"
Or can we input non-gausssian data to UMAP?[image: ProteinExpressionLogvalue]
https://user-images.githubusercontent.com/40367441/83333968-60f69b80-a271-11ea-8206-bcf27c57664e.PNG
[image: ProteinExpressionRawvalue]
https://user-images.githubusercontent.com/40367441/83333971-6227c880-a271-11ea-831f-d7213724f6c9.PNG—
You are receiving this because you are subscribed to this thread.
Reply to this email directly, view it on GitHub
https://github.com/lmcinnes/umap/issues/66#issuecomment-636354367, or
unsubscribe
https://github.com/notifications/unsubscribe-auth/AC3IUWSQVXNIDMG6OVPKJGLRUEYHFANCNFSM4E6FNMKA
.
 jc-healy
on 1 Jun 2020
jc-healy
on 1 Jun 2020
Thank you very much for thoughtful comment. Let me check my data and try different ways.
If the range of my data over 10^5 (from 0 to >10^6), what kind of distance metrics would be applicable for my data?
Do you have any suggestion?
TnakaNY
on 4 Jun 2020
Related issues
 kinredon
·
7Comments
kinredon
·
7Comments
 JoOkuma
·
4Comments
JoOkuma
·
4Comments
 iicky
·
5Comments
iicky
·
5Comments
 gabritaglia
·
5Comments
gabritaglia
·
5Comments
 MattConflitti
·
6Comments
MattConflitti
·
6Comments
Most helpful comment
I think the primary thing that is required is for distances (at least locally) to be meaningful. That may require standardisation -- e.g. if you are measuring weight in grams and height in meters then euclidean distance is going to look a little strange unless you do some standardisation. So the real question is what does distance mean for your data (including what distance metric you want to choose).