Hello! First of all, this is an awesome project. I have been integrating this into a pipeline that clusters various datasets. I have been noticing that I am consistently getting streaks when projecting to 2 dimensions instead of round clusters like the common MNIST example. I would assume that the type of data I am using (customer-item sales matrix, customer data, etc) has a certain characteristic(s) that would cause this, but I wanted to make sure that it isn't due to some weird value I may or may not be setting a certain parameter to.

n_components=2, n_neighbors=30, min_dist = 0.0, n_epochs = 500
This occurs with 15 neighbors, min_dist up to 0.5 and combinations thereof. I haven't touched spread much.
Th data for this projection consists of a lot of binary features and is somewhat sparse. The clusters are detected by HDBSCAN (another awesome addition to the community).
I just wanted to reach out to see if others have seen this type of behavior instead of the more traditional thought of clusters (more circular).
Thanks!
 MattConflitti
All 6 comments
Looking at those results I would have to ask about the possibility that an index or identifier column slipped into your data somehow? The other possibility is that there is a single feature that is on a very different scale than all the rest, and hence dominates distance computation (if you are using euclidean distance). So, check for accidentally having the id column slip in (I've certainly done this more than once by accident), and consider doing some feature scaling (the RobustScaler from sklearn may be a reasonable option).
 lmcinnes
on 6 May 2019
lmcinnes
on 6 May 2019
Thank you for the suggestions. I double checked for index columns and there was one that hung around after preprocessing. I thought I had all of them accounted for. That seemed to do the trick for that dataset. I double checked the scaler in the preprocessing pipeline and I am using a MinMaxScaler with a feature range of (0,1), so they should be all on the same scale. I may throw a robust scaler in and just see how that effects it.
I have noticed streaking in other datasets that are smaller and definitely do not have any identifying columns and uses that same scaler. Every feature is a calculated continuous variable. If this is the case, could it just be that the data being used may not satisfy the initial assumptions of the UMAP algorithm?
MattConflitti
on 7 May 2019
It may be that the data just has a linear or one-dimensional structure underlying it.
lmcinnes
on 7 May 2019
Purely from anectodal evidence, it seems that we observe when there are multiple columns that do have an underlying explanatory variable (like time, for example), you get streaks. The more multicollinearity you have between features (i.e. multiple time-dependent features), the streakier it gets.
 dswalter
on 23 May 2019
dswalter
on 23 May 2019
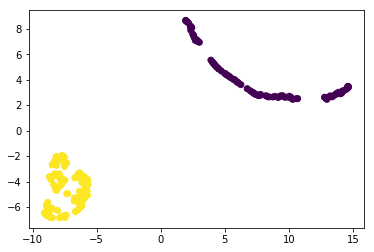
So basically, I can reproduce if the underlying dimensionality is just one
`import umap
import numpy as np
import matplotlib.pyplot as plt
--- Generate data - two gaussian clusters
mu_1 = 0
sd_1 = 1
mu_2 = 10
sd_2 = 1
n_1 = 100
n_2 = 100
x = np.empty((n_1 + n_2, 2))
for i in range(2):
x[:, i] = np.r_[np.random.normal(mu_1, sd_1, n_1), np.random.normal(mu_2, sd_2, n_2)]
--- Set one of the coords of the first cluster to 0
x[0:100, 0] = 0
mdl = umap.UMAP()
embedding = mdl.fit_transform(x)
plt.scatter(embedding[:, 0], embedding[:, 1], c=np.r_[np.zeros(100), np.ones(100)])`
This shows one of the clusters to be linearly distributed, as expected.
 paoloinglese
on 23 May 2019
paoloinglese
on 23 May 2019
That makes sense. Many thanks to the both of you for the explanation and example.
MattConflitti
on 29 May 2019
Related issues
 turnersr
·
3Comments
turnersr
·
3Comments
 kylemcdonald
·
5Comments
kylemcdonald
·
5Comments
 cupidio
·
7Comments
cupidio
·
7Comments
 ajkl
·
4Comments
ajkl
·
4Comments
 gabritaglia
·
5Comments
gabritaglia
·
5Comments
Most helpful comment
So basically, I can reproduce if the underlying dimensionality is just one
`import umap
import numpy as np
import matplotlib.pyplot as plt
--- Generate data - two gaussian clusters
mu_1 = 0
sd_1 = 1
mu_2 = 10
sd_2 = 1
n_1 = 100
n_2 = 100
x = np.empty((n_1 + n_2, 2))
for i in range(2):
x[:, i] = np.r_[np.random.normal(mu_1, sd_1, n_1), np.random.normal(mu_2, sd_2, n_2)]
--- Set one of the coords of the first cluster to 0
x[0:100, 0] = 0
mdl = umap.UMAP()
embedding = mdl.fit_transform(x)
plt.scatter(embedding[:, 0], embedding[:, 1], c=np.r_[np.zeros(100), np.ones(100)])`
This shows one of the clusters to be linearly distributed, as expected.