Thanos: Store: odd performance, while not using a lot of cpu/memory
Thanos, Prometheus and Golang version used:
thanos:v0.12.2
prometheus:v2.15.2
On Kubernetes
Object Storage Provider:
S3
What happened:
I have spikes in the store usage (delays, high Go Routine counts) , but this is not in line with actual cpu/memory usage from the thanos store.
What you expected to happen:
I would expect to see bottlenecks "somewhere" - especially in memory usage of the thanos store OR that it just runs stable. Not having massive spikes without seeing anything in memory/cpu usage (and IMO 0.2 increase in CPU is not much :) )
How to reproduce it (as minimally and precisely as possible):
No idea.
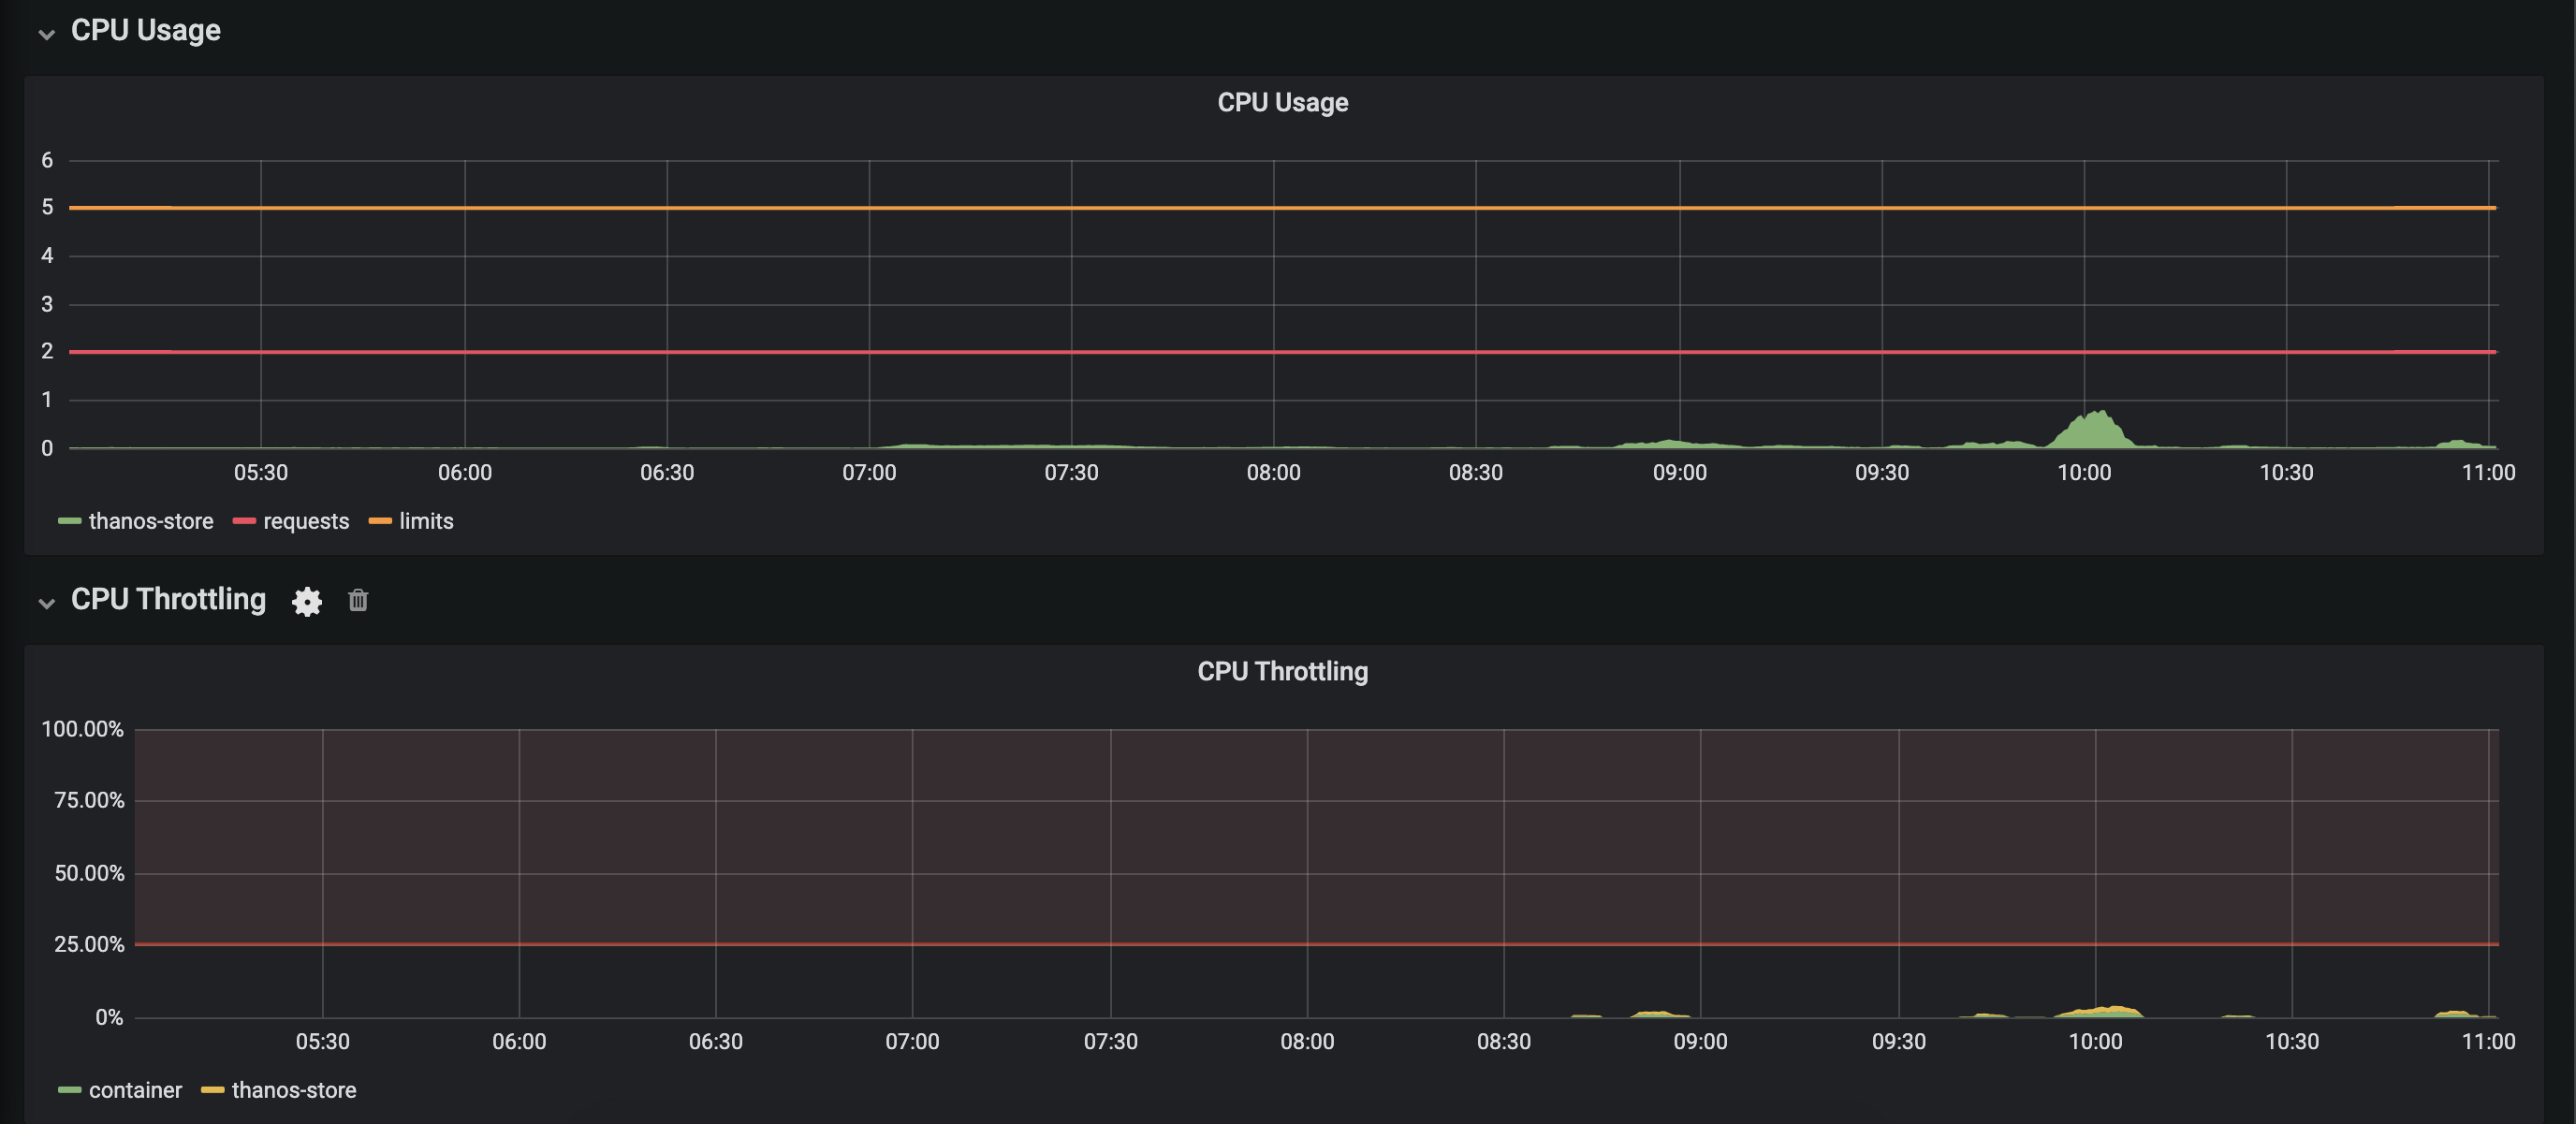
Cpu Usage at the time of the spike
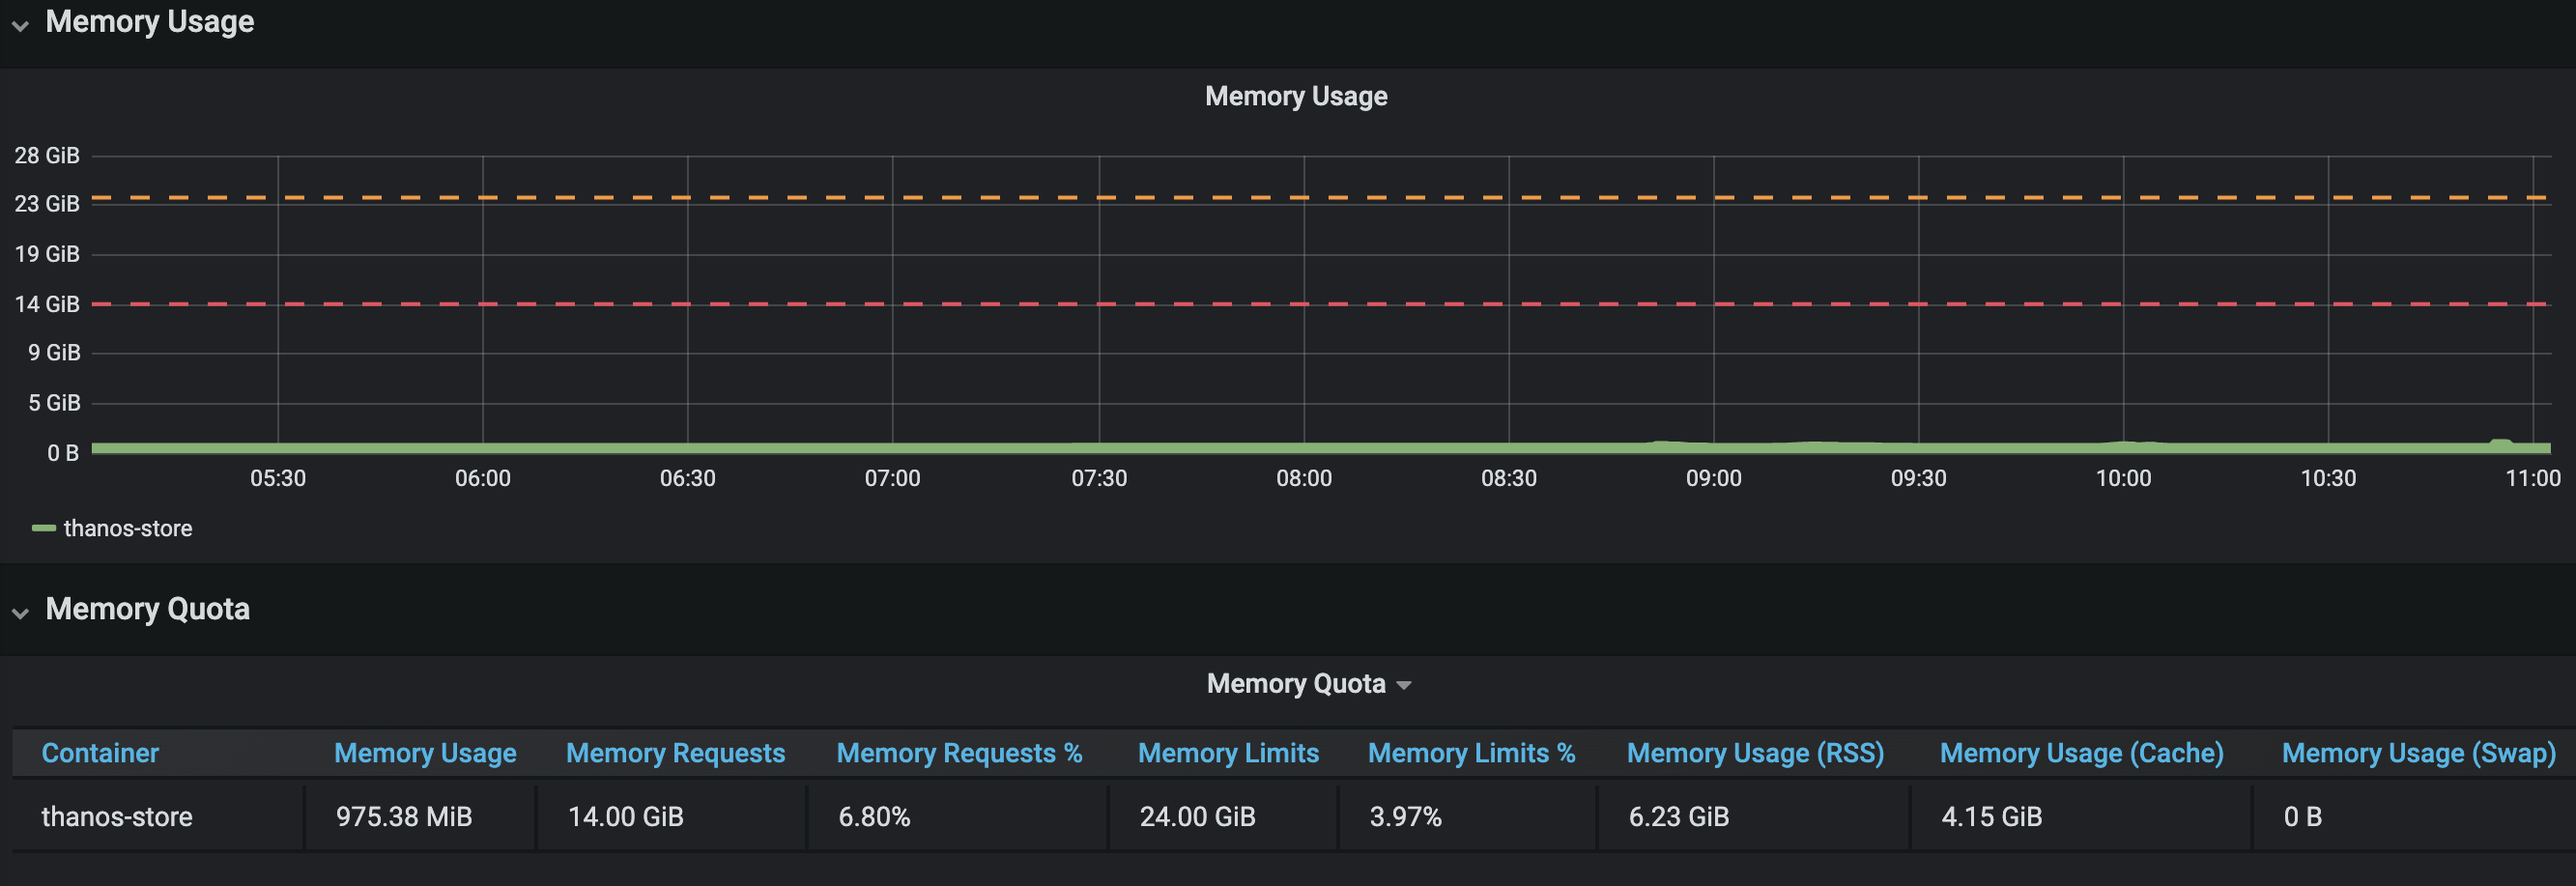
Memory usage at the time of the spike
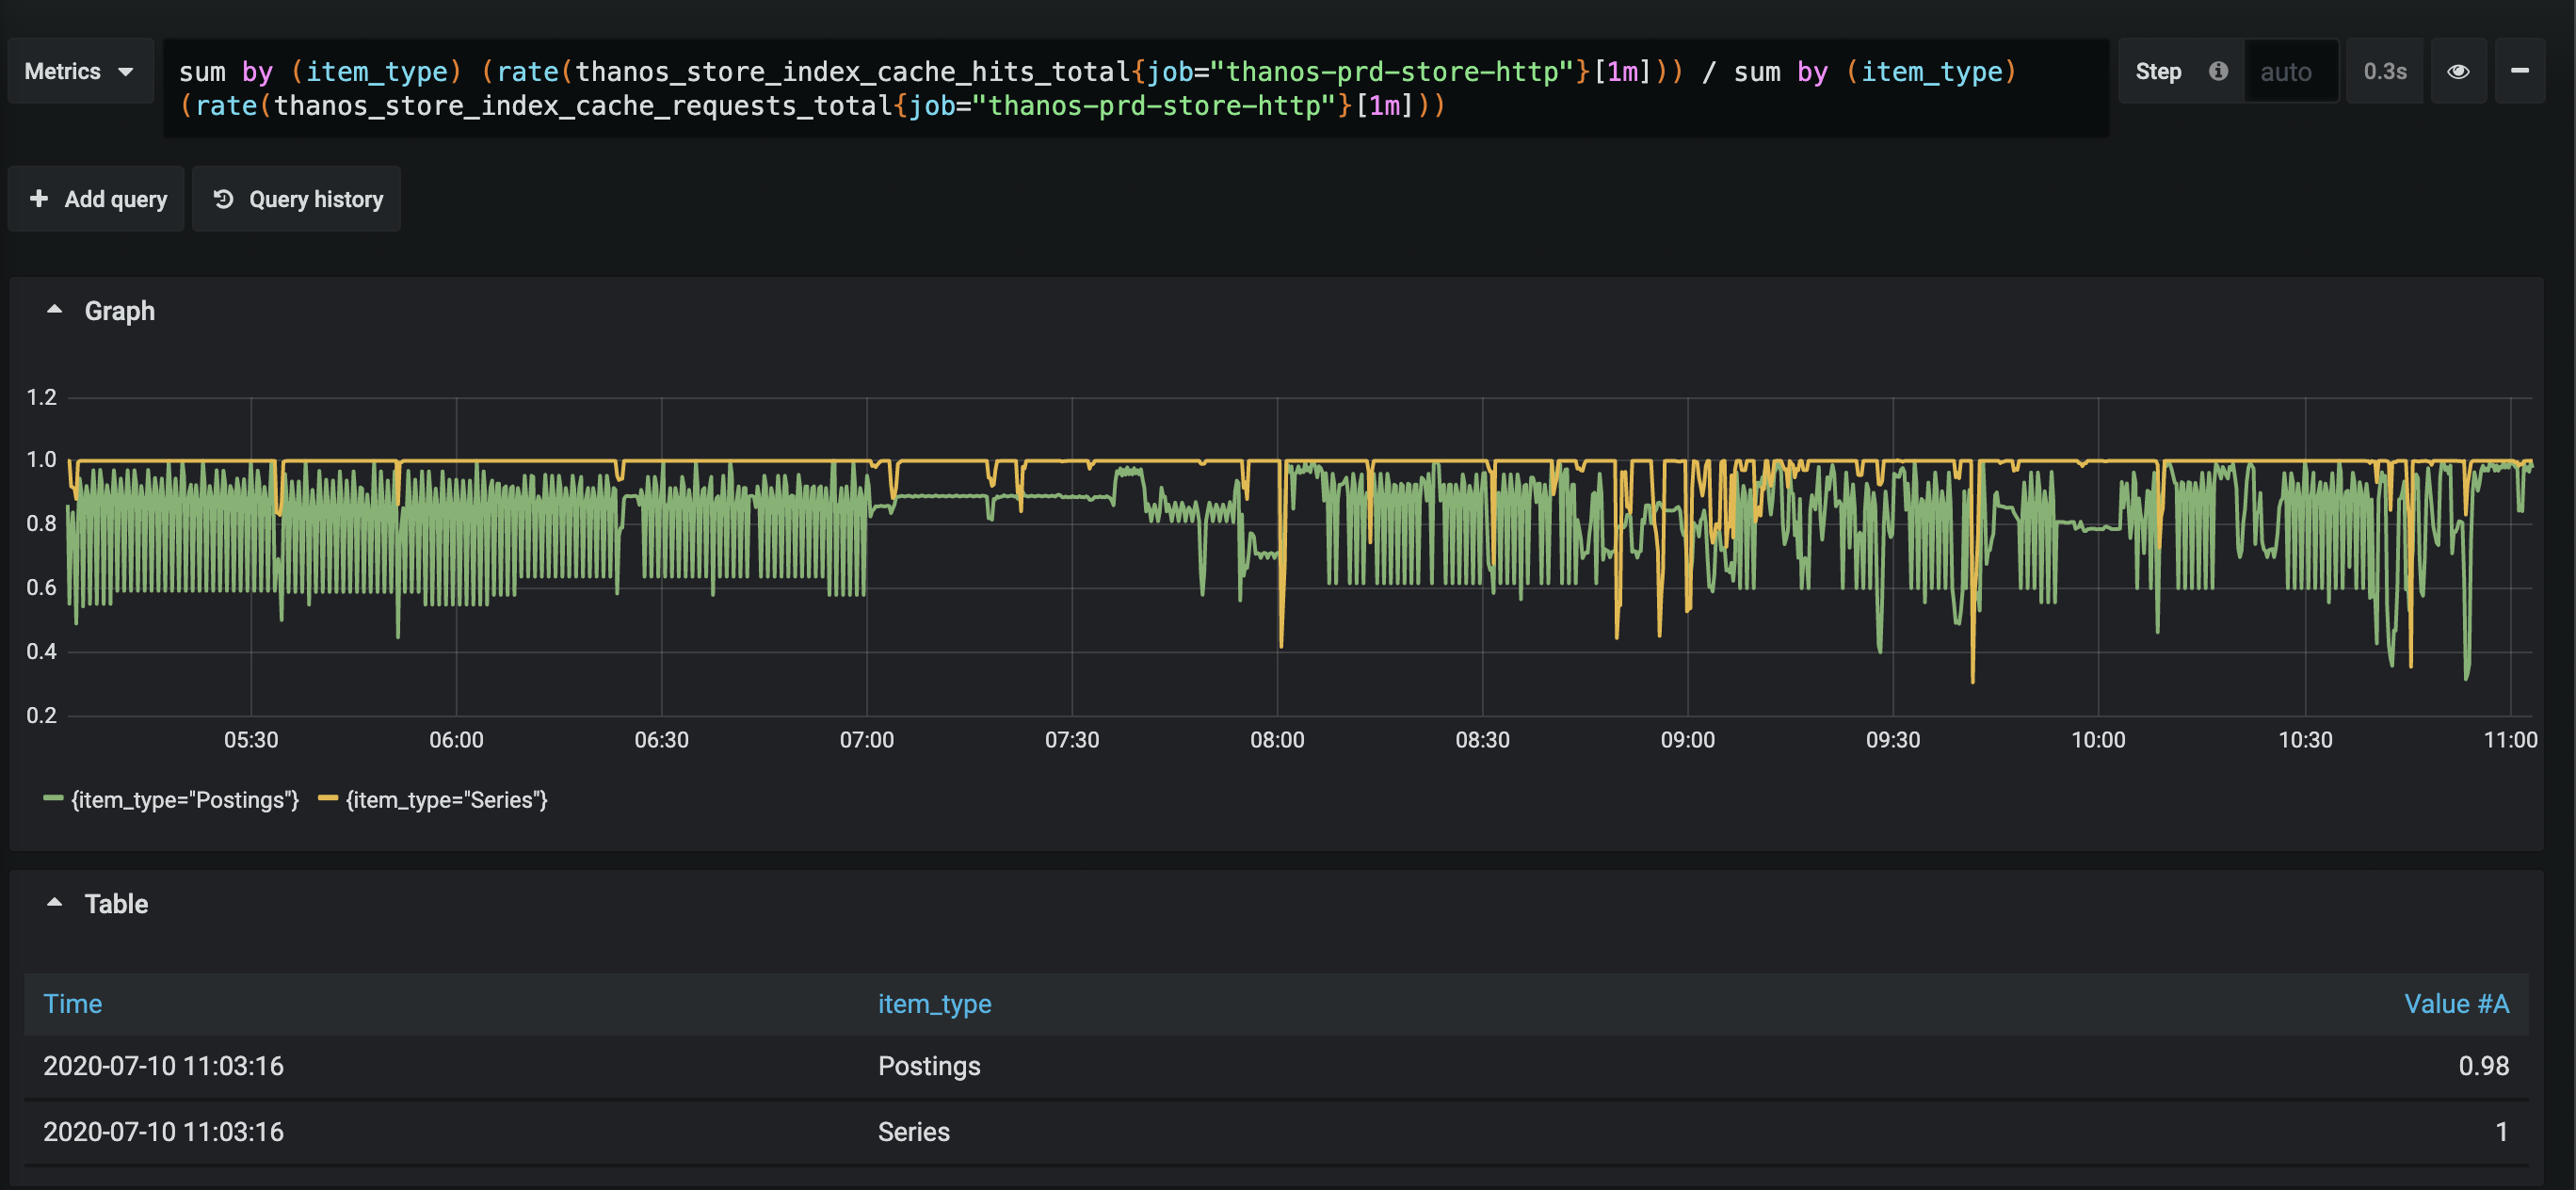
Cache hits
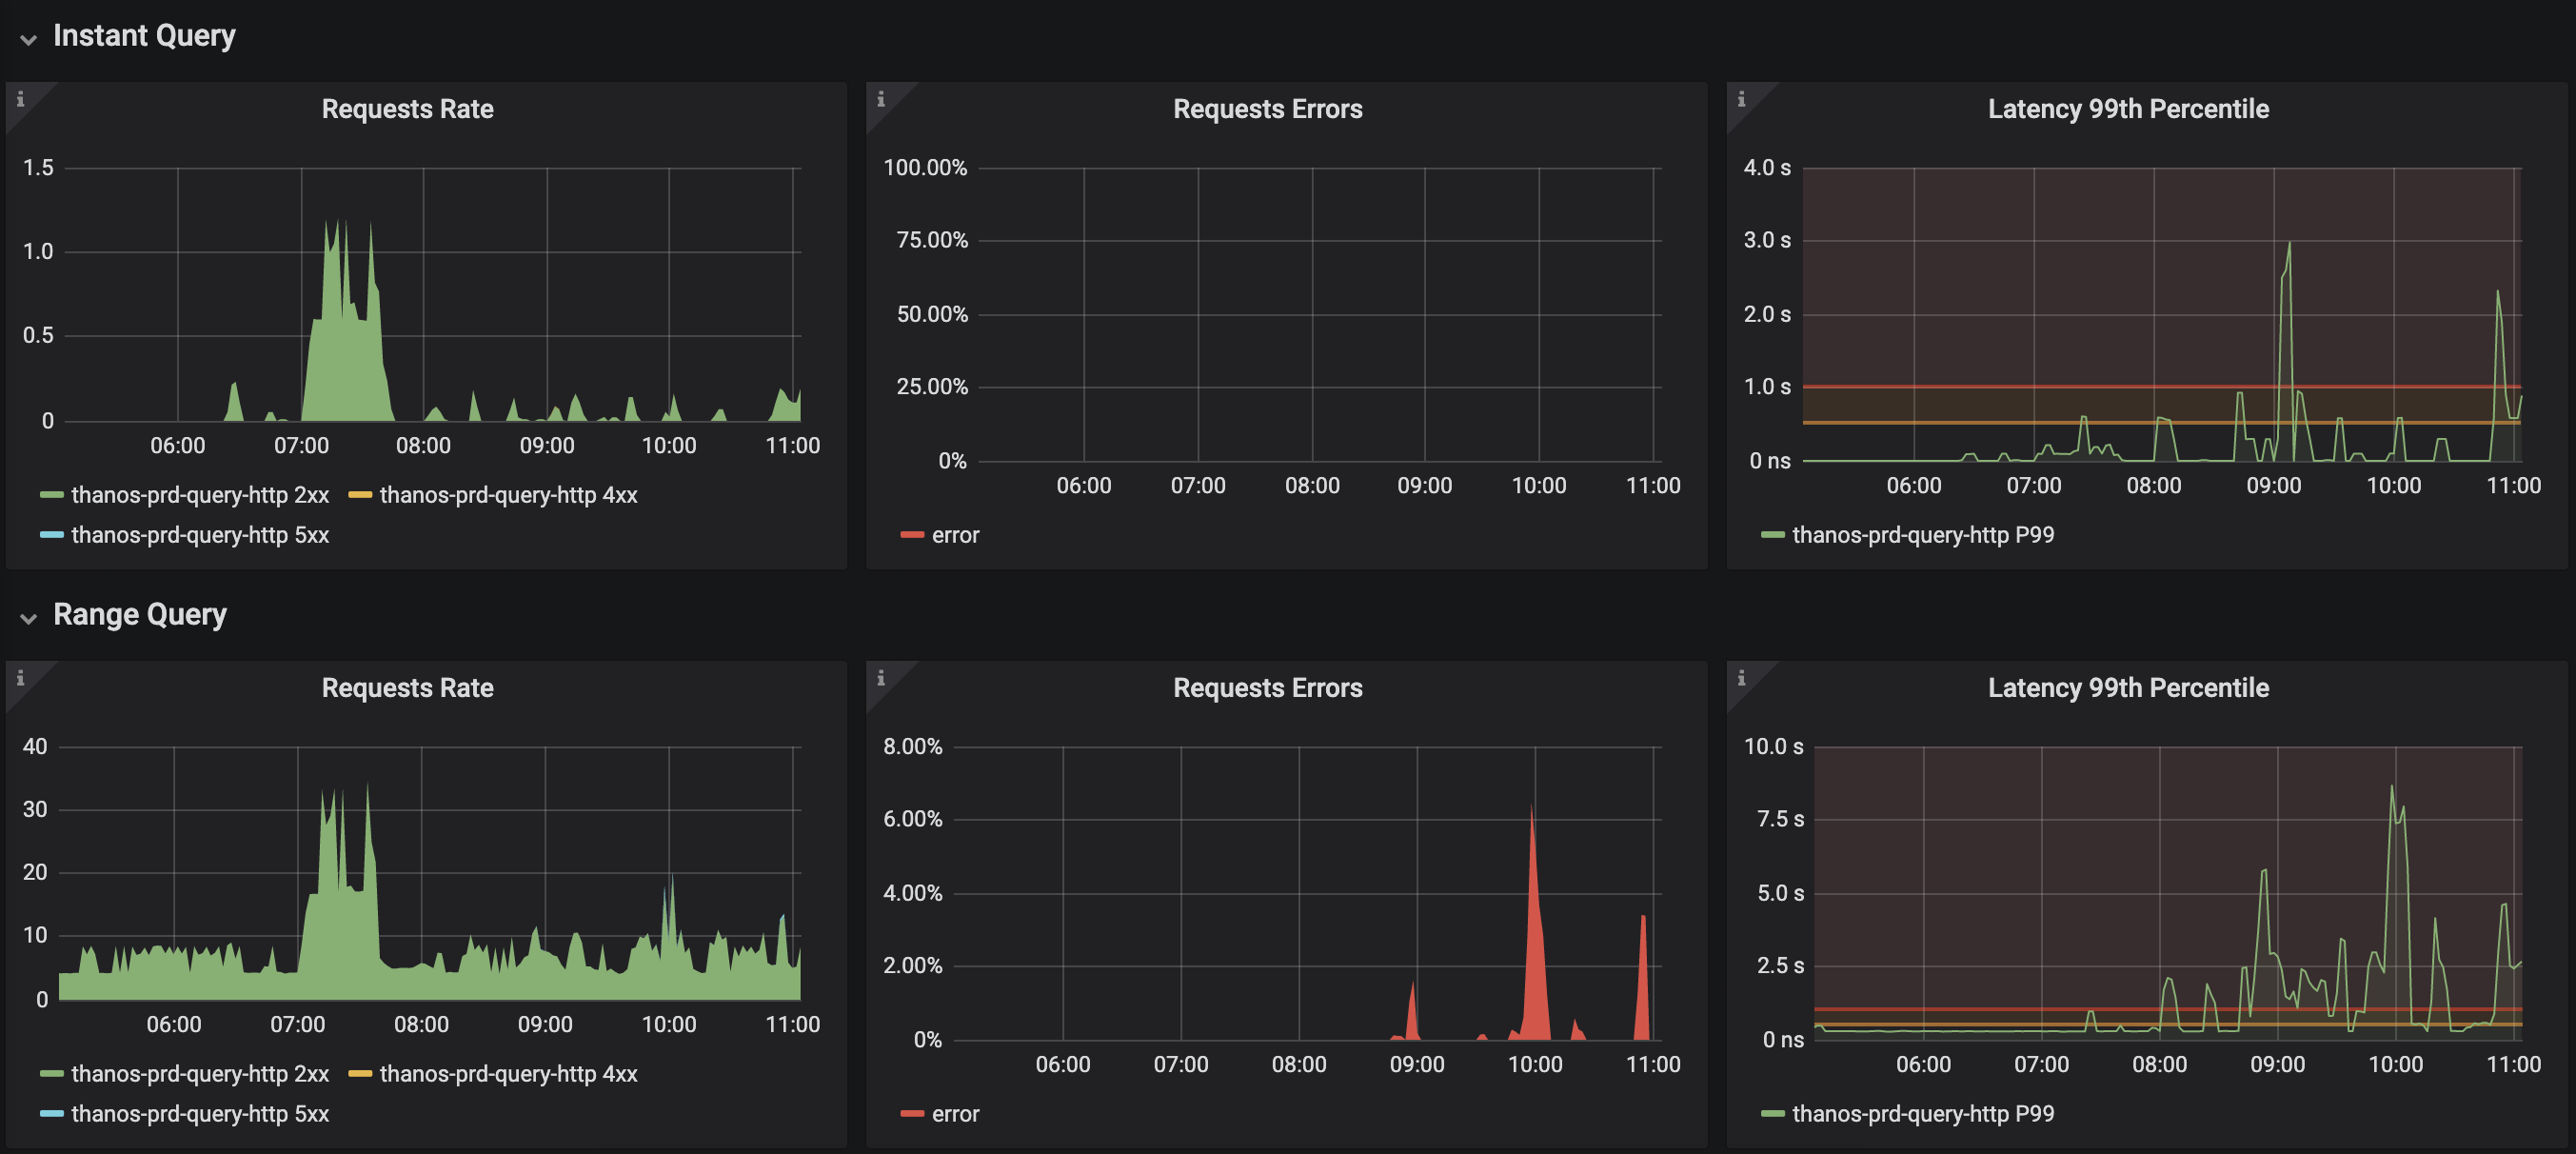
Latency
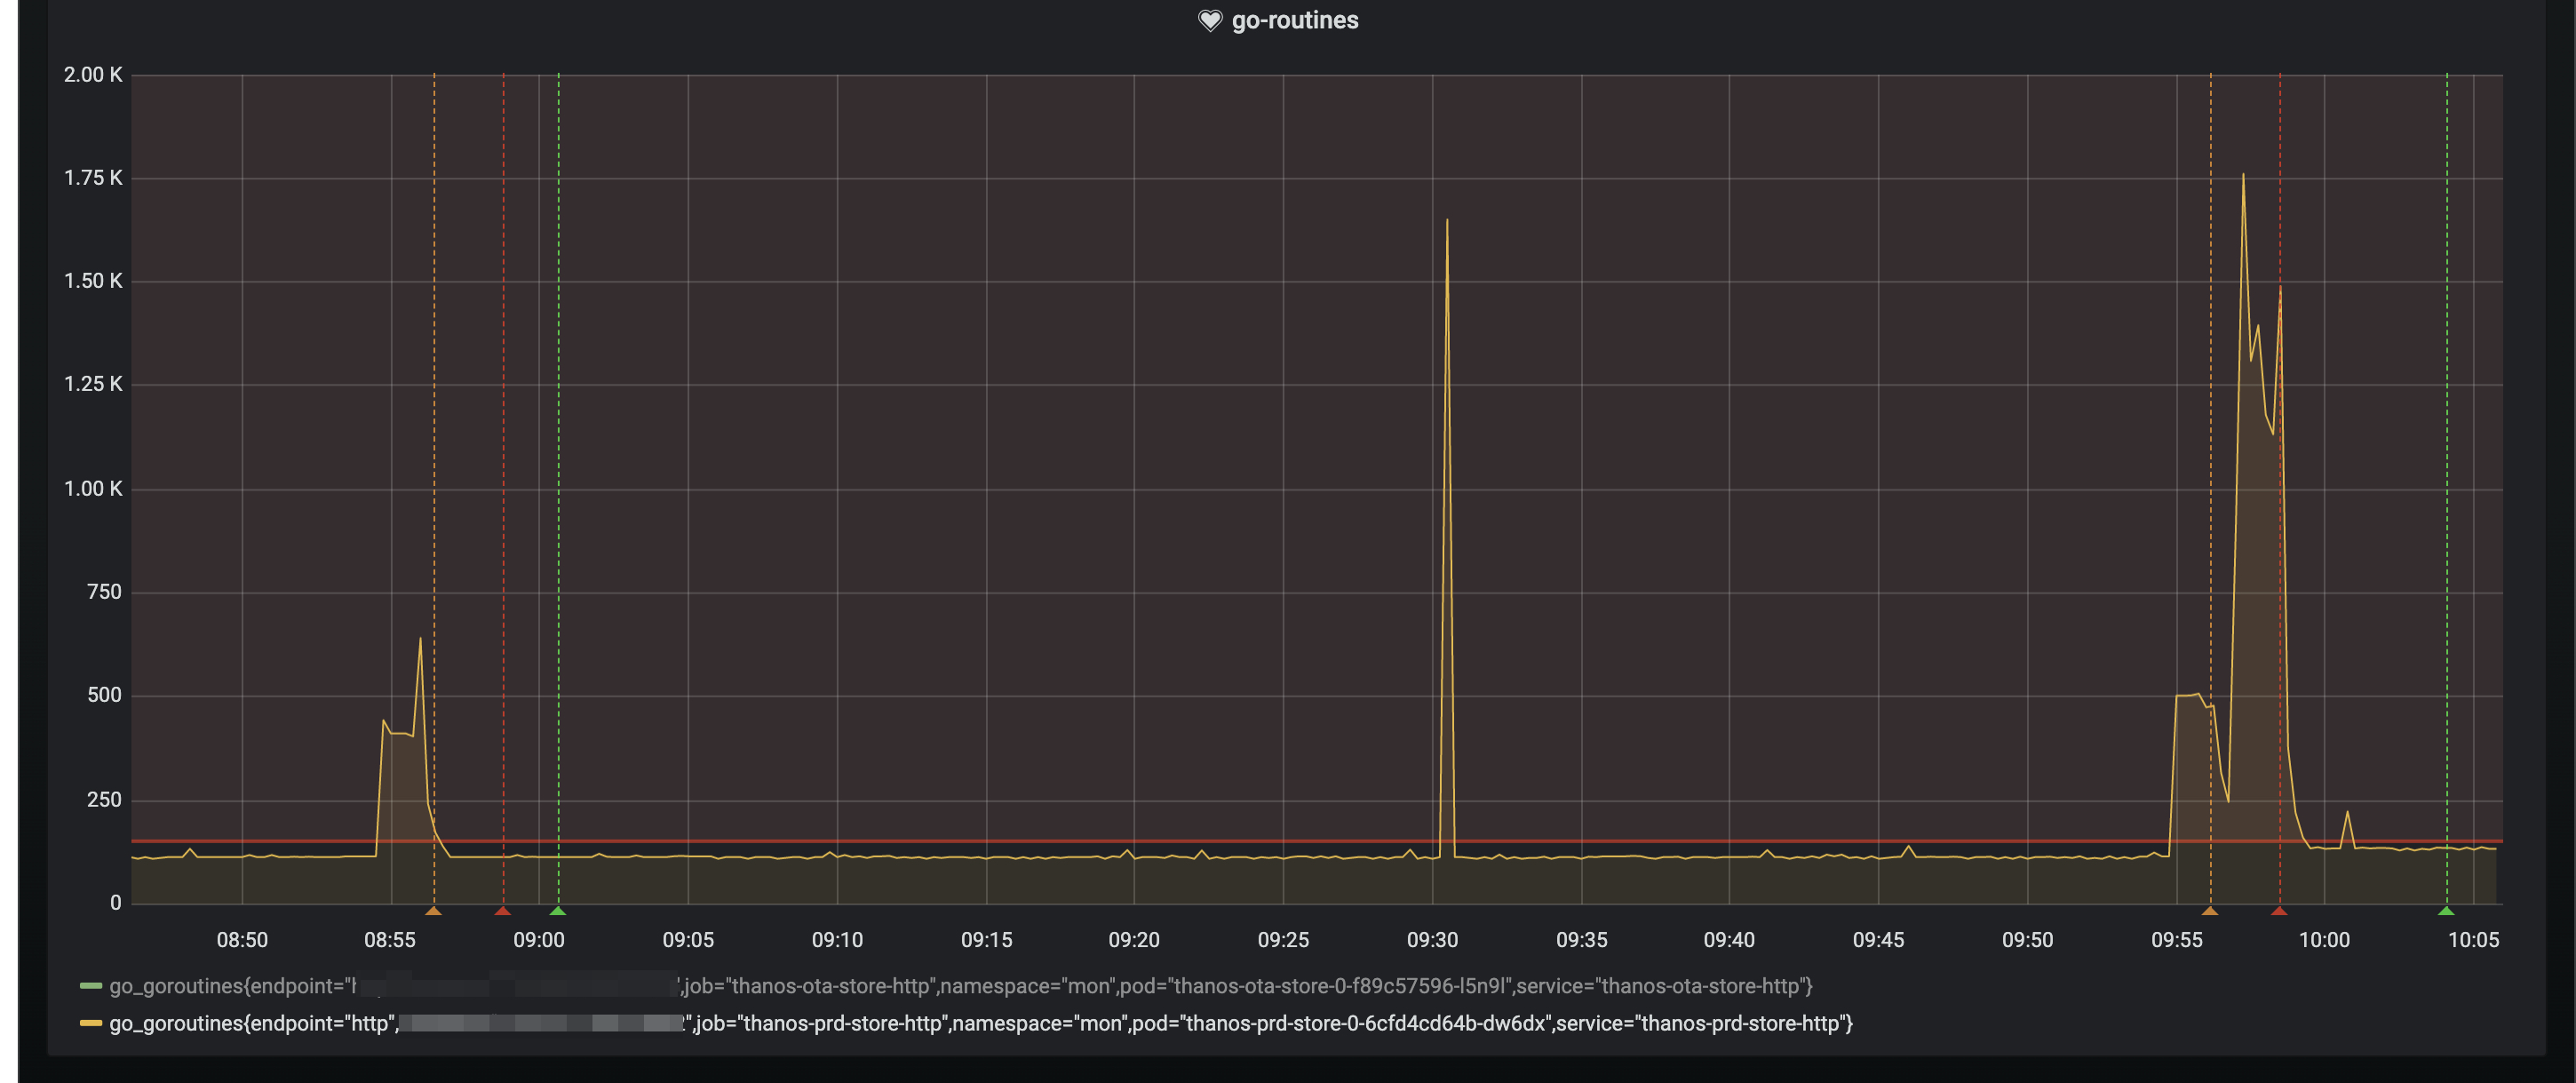
Go Routines
Further information
  # Maximum size of items held in the index cache.
  indexCacheSize: 18GB
  # Maximum size of concurrently allocatable bytes for chunks.
  chunkPoolSize: 10GB
  # Maximum amount of samples returned via a single series call. 0 means no limit.
  # NOTE: for efficiency we take 120 as the number of samples in chunk (it cannot be bigger than that),
  # so the actual number of samples might be lower, even though the maximum could be hit.
  grpcSeriesSampleLimit: 0
  # Maximum number of concurrent Series calls.
  grpcSeriesMaxConcurrency: 40
  # Repeat interval for syncing the blocks between local and remote view.
  syncBlockDuration: 3m
  # Number of goroutines to use when syncing blocks from object storage.
  blockSyncConcurrency: 40
What I've tried
I've increased the indexCacheSize. Even though my memory usage for the store is < 10gb, it seems to have a possitive effect on the avg amount of Go Routines AND the severity of the spikes. This seems really odd.
More practically explained between the differences by two examples:
indexCacheSize: 10gb
Pod memory usage: 8 GB
Spikes for ~2000 go routines
indexCacheSize: 18gb
Pod memory usage: 9 GB
Spikes for ~1000 go routines
So it LOOKS (I'm really not sure if this is just coincidence) that increasing the indexCacheSize does more than it might seem to do.
 wiardvanrij
All 3 comments
Traced the real high spikes back to this Go Routine:
314 @ 0x4313d0 0x44d587 0x44d55d 0xd9621e 0x45f261
#   0x44d55c    time.Sleep+0x12c                        /usr/local/go/src/runtime/time.go:105
#   0xd9621d    github.com/minio/minio-go/v6.Client.newRetryTimer.func2+0x8d    /go/pkg/mod/github.com/minio/minio-go/[email protected]/retry.go:79
Traced it back to: github.com/minio/minio-go/v6 v6.0.49 which is used in Thanos version 0.12.2
This version of minio-go has this issue: https://github.com/minio/minio-go/issues/1259 which is fixed by this PR: https://github.com/minio/minio-go/pull/1260 which is included in minio-go version 6.0.52.
Thanos version 0.13 uses github.com/minio/minio-go/v6 v6.0.56 which should resolve this issue.
I will update our Thanos soon, and post my feedback.
wiardvanrij
on 16 Jul 2020
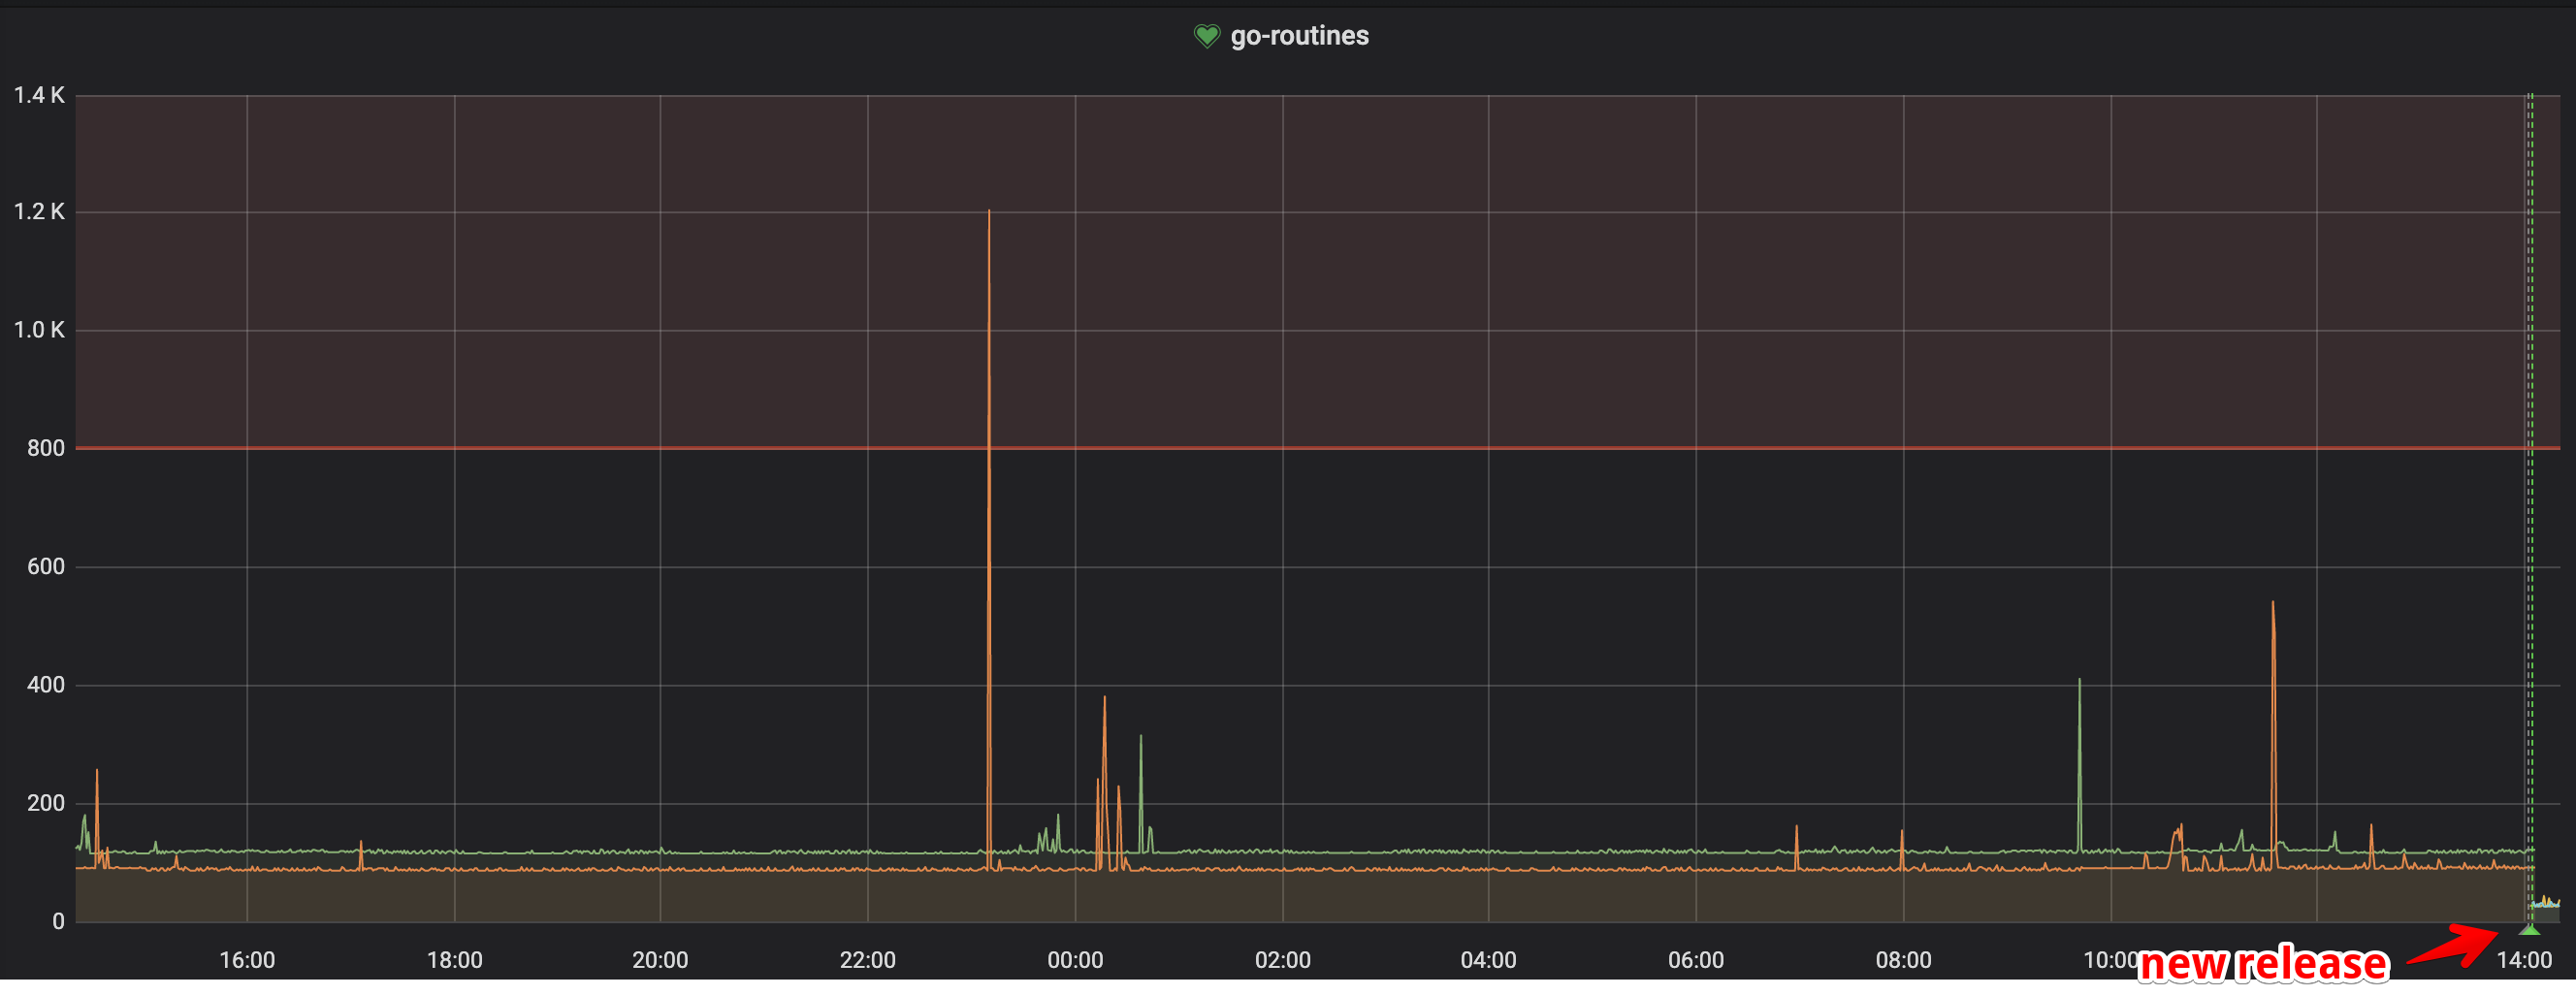
Upgrading to > 0.12.2 (in my case 0.14, but 0.13 should work too) resolved my issues.
wiardvanrij
on 17 Jul 2020
Related issues
 bwplotka
·
4Comments
bwplotka
·
4Comments
 MrD2
·
3Comments
MrD2
·
3Comments
 StephenWeber
·
3Comments
StephenWeber
·
3Comments
 paulcdejean
·
4Comments
paulcdejean
·
4Comments
 turbotankist
·
3Comments
turbotankist
·
3Comments
Most helpful comment
Upgrading to > 0.12.2 (in my case 0.14, but 0.13 should work too) resolved my issues.