Thanos: Receive: Possible memory leak with TSDB growth
Thanos, Prometheus and Golang version used:
I have tested with both 0.8.1 and 0.9.0. Most recent version output is as follows:
thanos, version 0.9.0 (branch: HEAD, revision: 0833cad83db8b257a2275ec83a3d034c73659056)
  build user:       circleci@8e3da52515a2
  build date:       20191203-17:03:13
  go version:       go1.13.1
Object Storage Provider: N/A
What happened:
When receiver runs for a long period of time it's memory grows until reaching OOM kills
What you expected to happen:
A steady memory footprint
How to reproduce it (as minimally and precisely as possible):
Run thanos receive with a retention time of 5x the block size (default 2h). When the first WAL flush occurs you will see the memory usage start to grow. With each WAL flush there is exponentially more memory usage.
Full logs to relevant components:
Anything else we need to know:
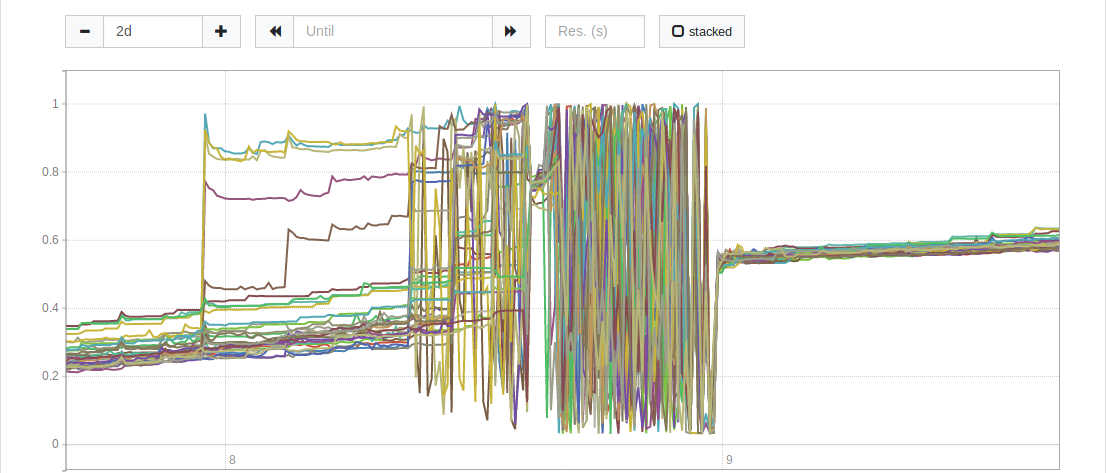
I initially found this problem when our servers started an OOM loop. I tried to clear the WAL and restart to no avail. The only solution was to delete some local TSDB blocks. With each block I deleted it lowered the memory footprint. I finally restarted fresh and found the memory usage to be level and consistent until the first WAL flush at which point there was a small spike (probably from the flush) and then a slope.
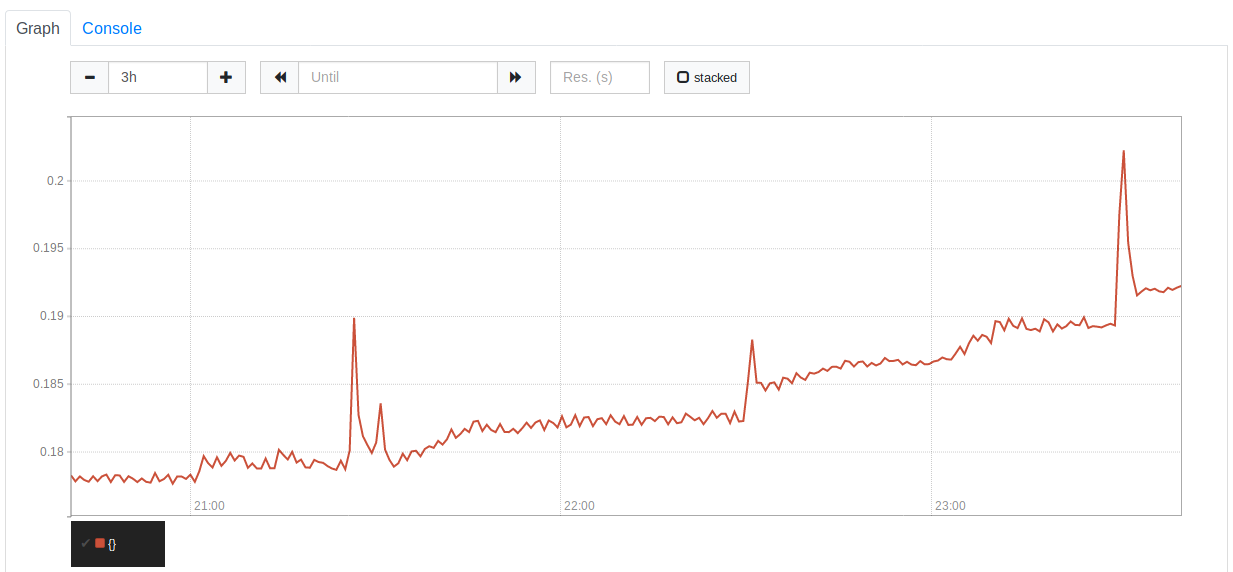
You can see the memory growth here. I have the blocks set to 1h which explains the spikes.
UPDATE: it appears that restarting exacerbates the problem. I didn't change the hashring.json or do anything but restart the thanos service.

 blockloop
All 2 comments
I pushed master-2019-12-10-352cc305 (which includes the fix from #1856) to one machine in our cluster and it seems to be growing much slower than the rest. Here is a screenshot of a 12h view.
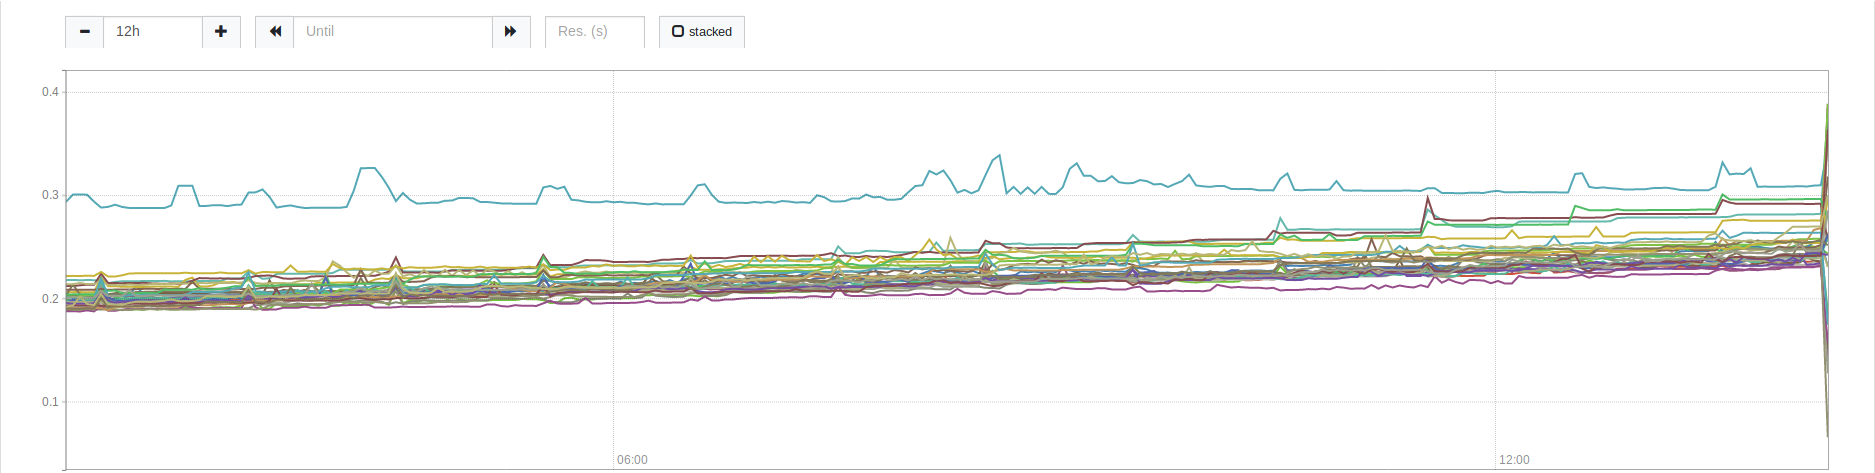
The steady line is the machine with master-2019-12-10-352cc305. The rest of the cluster still has 0.9.0 and you can see their growth is much more than the updated machine.
blockloop
on 10 Dec 2019
@bwplotka the issue seems to be resolved with #1856 . The issue I was having with rebooting nodes and doubling memory usage was caused by thrashing. When we rebooted machines the hashring was updated by our watcher app, which monitors availability and updates the hashring. I believe this issue can be closed now with 352cc305
blockloop
on 10 Dec 2019
Related issues
 sepich
·
4Comments
sepich
·
4Comments
 StephenWeber
·
3Comments
StephenWeber
·
3Comments
 bwplotka
·
4Comments
bwplotka
·
4Comments
 caarlos0
·
3Comments
caarlos0
·
3Comments
 wiardvanrij
·
3Comments
wiardvanrij
·
3Comments
Most helpful comment
@bwplotka the issue seems to be resolved with #1856 . The issue I was having with rebooting nodes and doubling memory usage was caused by thrashing. When we rebooted machines the hashring was updated by our watcher app, which monitors availability and updates the hashring. I believe this issue can be closed now with 352cc305