Teslamate: Add separate "Charge Level" view in Grafana Dashboard?
Is there a way to add the Charge Level view on the Dashboard as a separate choice? Or maybe under Charge Details perhaps?

Currently it's only available under the Overview section. But it's locked to the last 24 hours. It would be very useful to see the drop in charge during any given period. (As an alternative to Vampire Drain.)
 spacecosmos
All 14 comments
Agree, this would be great.
 tucopup
on 29 Oct 2019
tucopup
on 29 Oct 2019
Maybe @DBemis can shed some light, since he is the one that created the awesome Overview section?
spacecosmos
on 29 Oct 2019
you could maybe take the query used in the Degredation dashboard and replace the calculated range with the SoC for SoC over time overall? Or even just add that as another data point on the Degredation dashboard?
 dopeghoti
on 29 Nov 2019
dopeghoti
on 29 Nov 2019
Anyone here up for the task in creating the Charge Level view on the _Dashboard_?
spacecosmos
on 16 Jan 2020
I‘ll try.
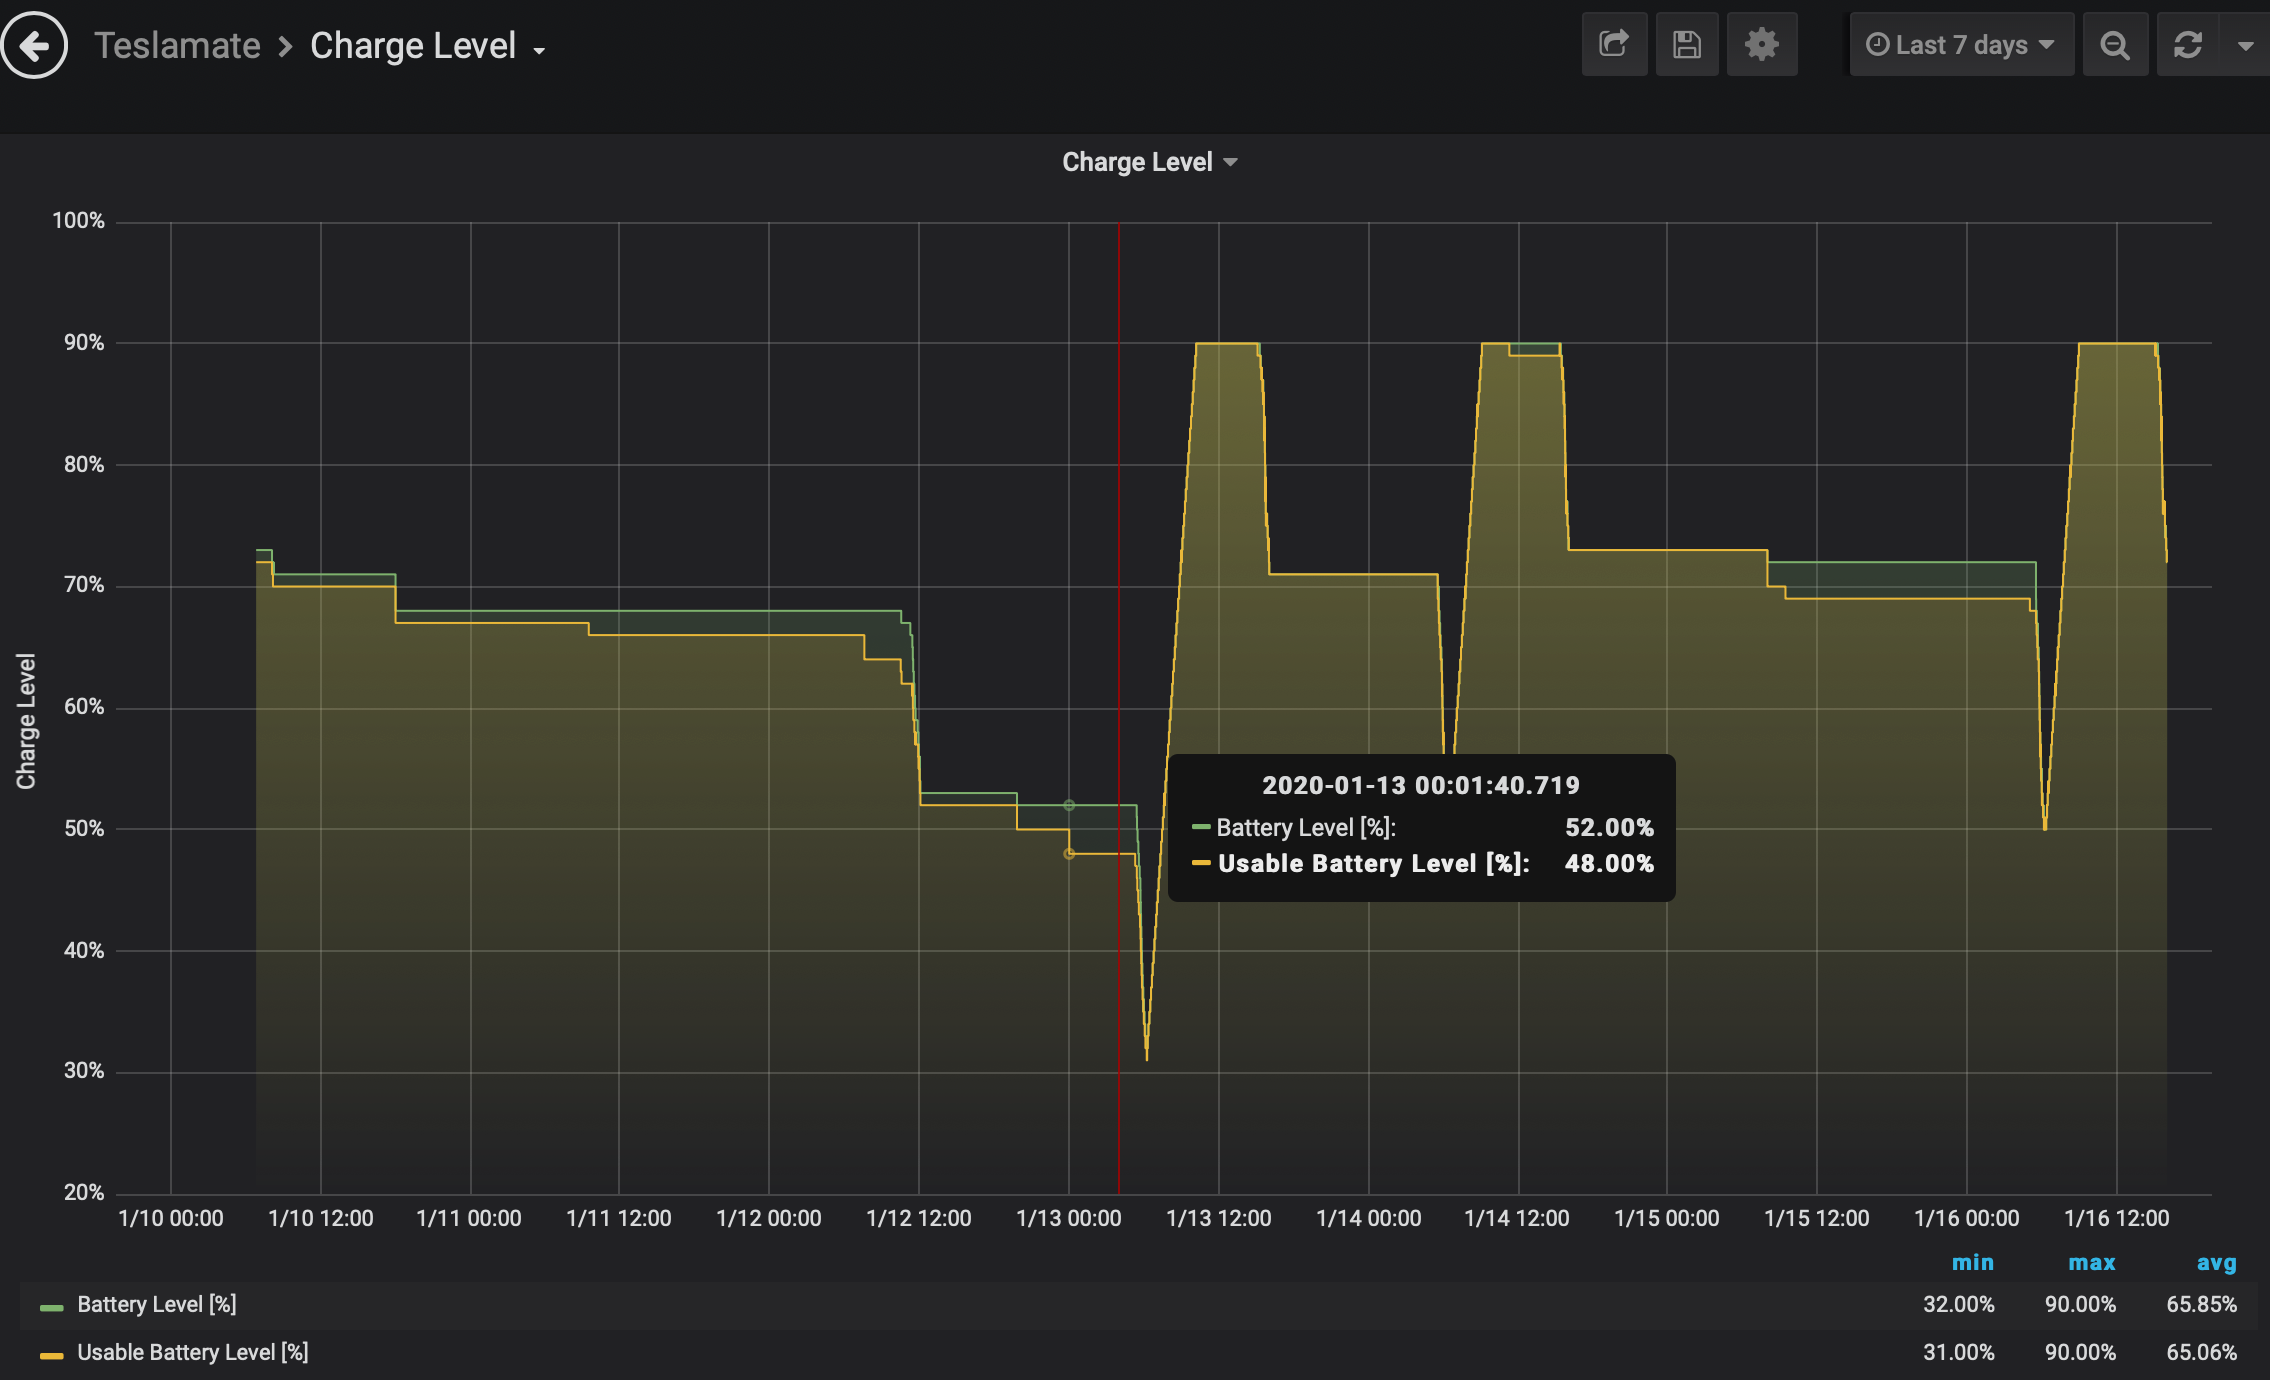
Just a new, separate Dashboard with battery level where you can select the time period. Right?
 ctraber
on 16 Jan 2020
ctraber
on 16 Jan 2020
I‘ll try.
Just a new, separate Dashboard with battery level where you can select the time period. Right?
Yes. Something like that would be great.
spacecosmos
on 16 Jan 2020
Here an example:
ctraber
on 16 Jan 2020
Wow @ctraber! Awesome work! It now needs to be implemented in the next release. :)
PS! If you have any more cool ways to present graphs and other ideas, please create some!
spacecosmos
on 16 Jan 2020
I couldn't agree more. More graphs and other cool ideas are always welcome :)
 adriankumpf
on 17 Jan 2020
adriankumpf
on 17 Jan 2020
I noticed only now that there are also datapoints in charges and not only in positions. I will also try to add usable_battery_level to charges now. Once I have to charge my car I‘ll test it.
ctraber
on 17 Jan 2020
Also did some tests with my "Projected Range" dashboard with other combinations.
Projected Range - Battery Level
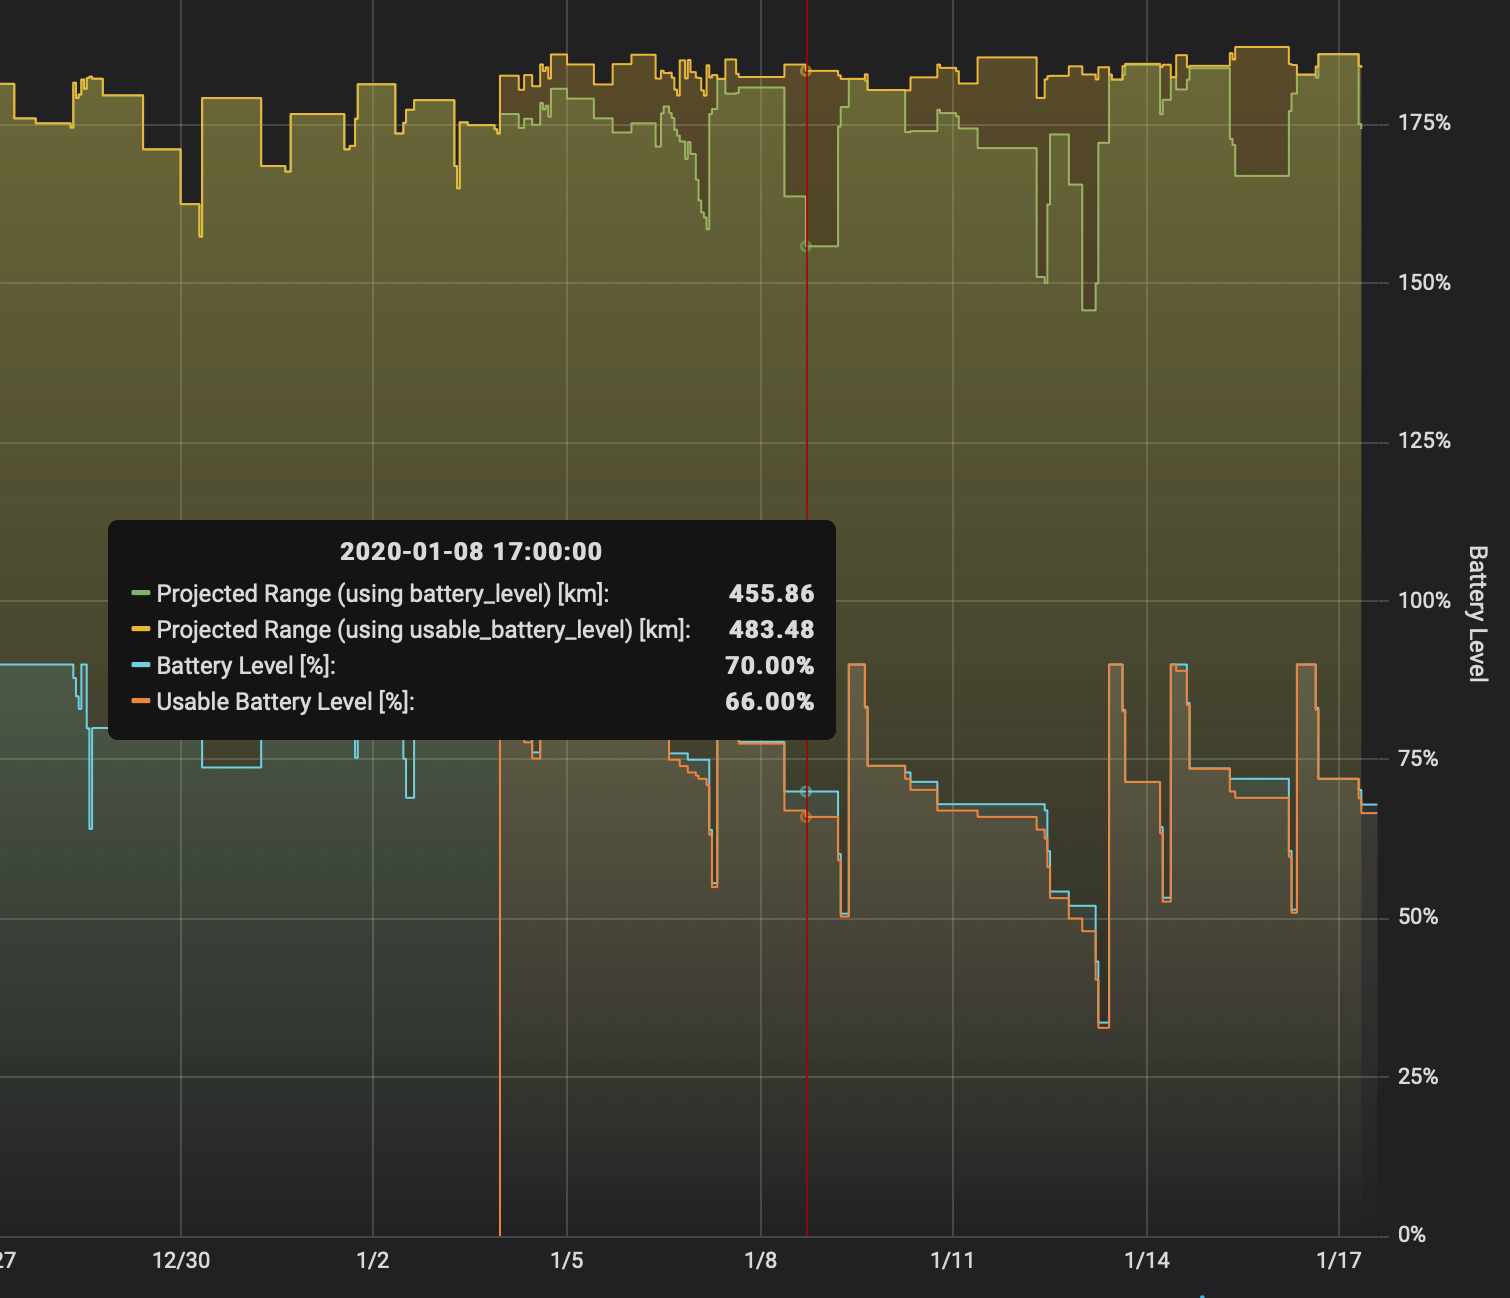
Projected Range - Outdoor Temp and Projected Range using estimated range instead of rated range.
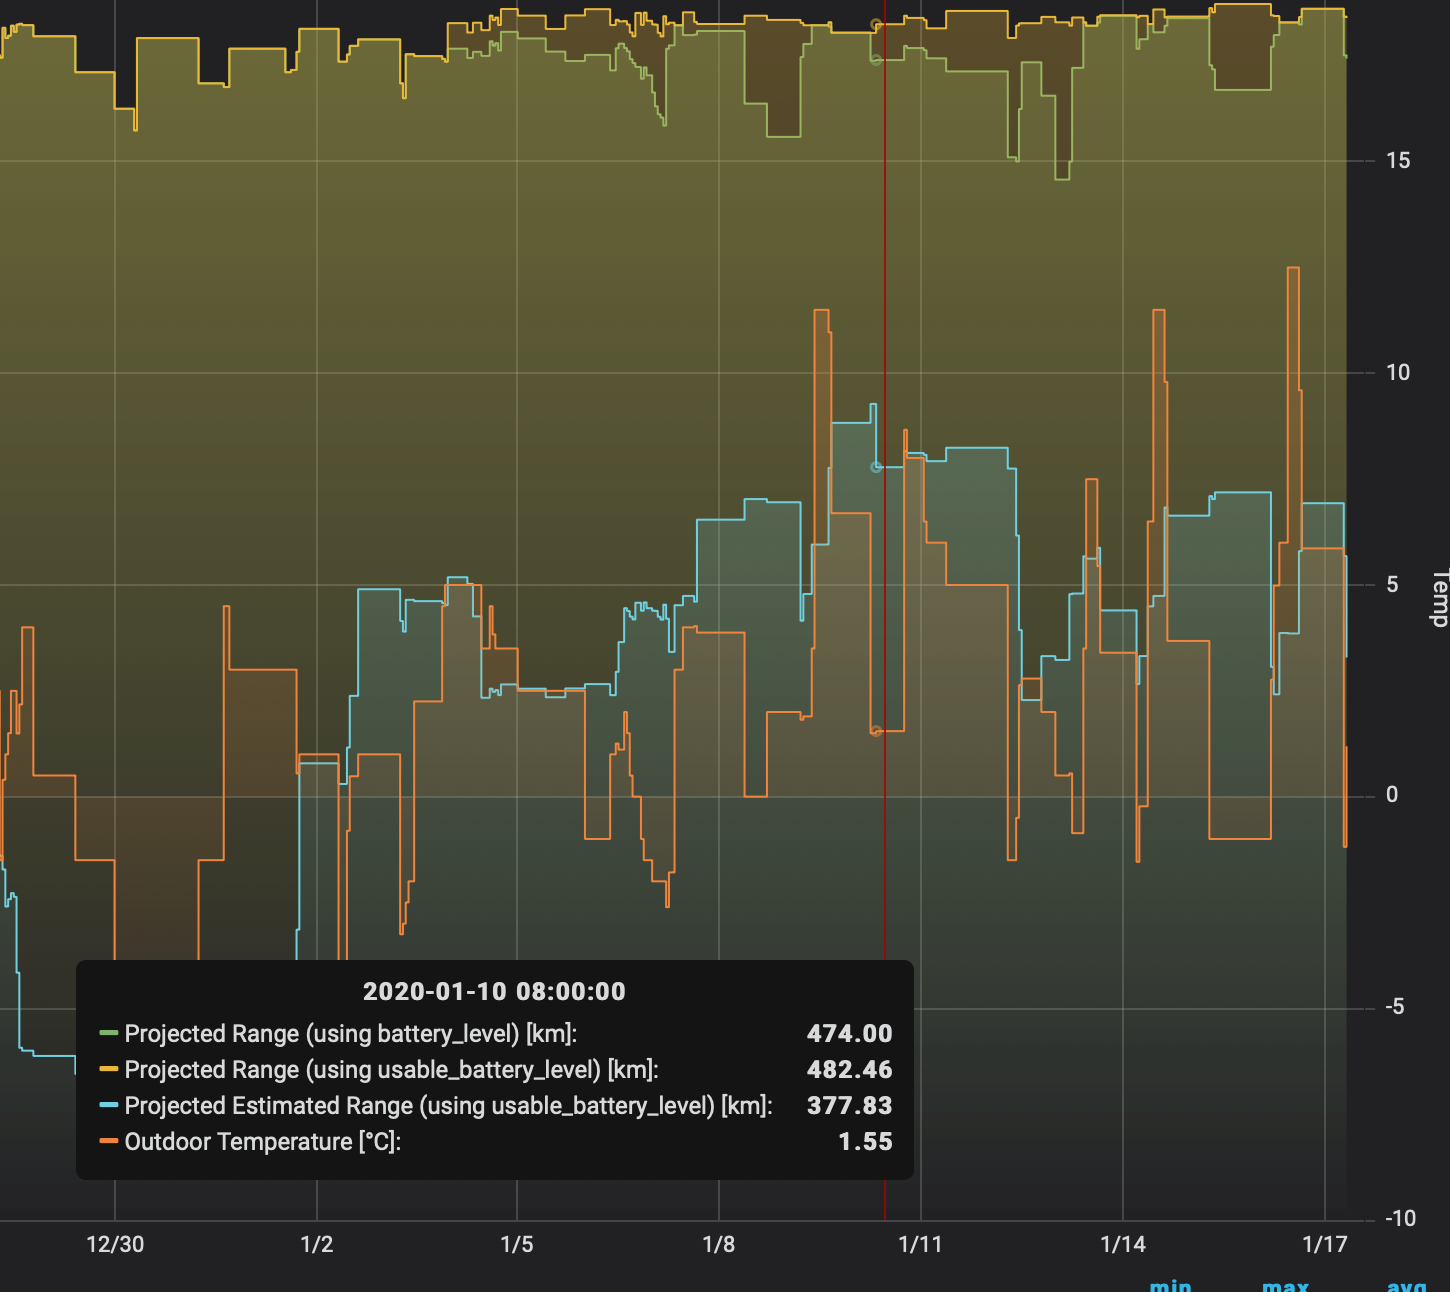
But I'm not really sure if it would be helpful...
ctraber
on 17 Jan 2020
Since the estimated range depends on the driving style one cannot draw conclusions about degradation from this. Still interesting to see the real-world range though.
adriankumpf
on 17 Jan 2020
I noticed only now that there are also datapoints in charges and not only in positions. I will also try to add usable_battery_level to charges now. Once I have to charge my car I‘ll test it.
The charge graph on the overview dash is pulling data from both locations if you want a reference point (you could probably copy that query). Sorry - flagged the original request a while ago about splitting it, then completely forgot about it :P Good work on the new one!
 DBemis
on 17 Jan 2020
DBemis
on 17 Jan 2020
Sure, i used the union. But when I added usable_battery_level to the logger, I only did it for positions and not yet for charges😬
ctraber
on 17 Jan 2020
Related issues
 petariga
·
5Comments
petariga
·
5Comments
 DrMichael
·
4Comments
DrMichael
·
4Comments
 virtualm2000
·
4Comments
virtualm2000
·
4Comments
 tobiasehlert
·
4Comments
tobiasehlert
·
4Comments
 bahree
·
5Comments
bahree
·
5Comments
Most helpful comment
Here an example: