Sts4: Steady CPU load if using a workspace with a 'big' amount of projects
Hi all,
I have installed the following version of the Spring Tool Suite:

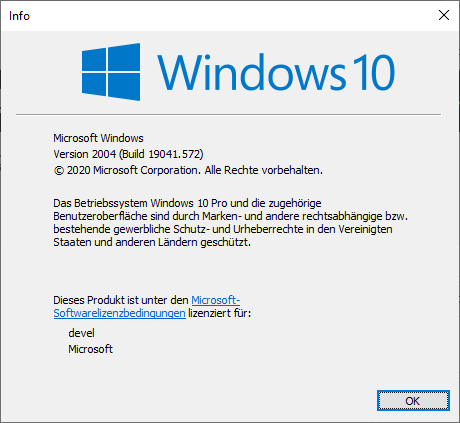
I'm running the IDE on Windows 10:
If I open the IDE with a workspace that contains a handful of projects all is fine. But If I open the IDE with a workspace that contains 83 projects, I have a steady CPU load on my machine. It is at 17% even if I do not work with the IDE at all. If I'm using the IDE it is going even higher.

The SpringToolSuite4.exe (2) is the IDE using the workspace with the 83 projects, the SpringToolSuite4.exe is the IDE using the workspace with a handful of projects.
I'm still able to work but the steady load results in that the fan is running most of the time (which is sort of annoying if working the whole day). I did not experience this behavior with former versions of the STS, therefore I'm raising this issue!
 ingogriebsch
All 12 comments
Are all or most of those 83 projects Java projects? If yes, it might be the JDT more blame then STS plugins... STS4 tooling runs primarily in separate Java processes (language server processes) rather than the main STS/Eclipse process.
Any chance you can capture a CPU Sampling snapshot with VisualVM for us to attach here for analysis?
Meanwhile we might try something on our end with lots of projects in the workspace...
But your CPU sampling snapshot would be most interesting of course as there could be a lot of variables contributing to the constant CPU usage...
 BoykoAlex
on 28 Oct 2020
BoykoAlex
on 28 Oct 2020
@ingogriebsch Another thing to double check might be: which exact version of STS4 did you use before where you didn't notice the issue? Was it STS4 on Eclipse 4.17? Or a different version on a different Eclipse base version?
I also see from the About dialog that you have Lombok installed. Can you uninstall that extension temporarily to see if that makes a difference? Would be good to make sure that Lombok doesn't interfere here in a bad way or has an issue with the underlying Eclipse JDT version.
 martinlippert
on 29 Oct 2020
martinlippert
on 29 Oct 2020
@BoykoAlex Yes, round about 75% of the projects are java based projects. I attached some files I created with the current version of VisualVM. I hope they help. If I can provide some more specific files/data, please let me know.
spring-sts-4.8.1-visualvm-data-20201030.zip
@martinlippert I used the latest 4.7 version of Spring Tool Suite before switching to 4.8.0 (and now 4.8.1). With version 4.7 I never realized that problem. And I have that many projects in my workspace for quite a while. I uninstalled/removed Lombok from the IDE but it looks like it makes no difference.
I attached the ini-file (though, the only changes I made are adding lombok as an agent and increasing Xms and Xmx).
I'm running the IDE without any special flags on startup (like -clean). I also realized that I get this warning if I start up the IDE with the big worksapce:
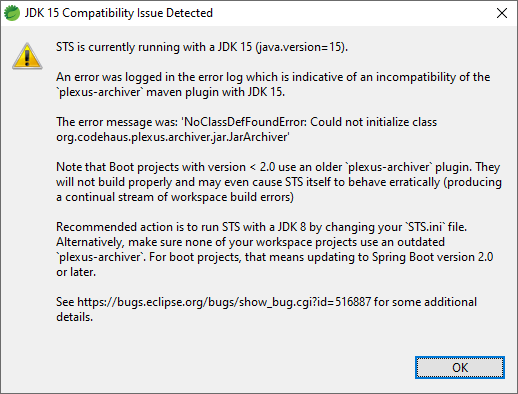
I do not get this warning if I start up the IDE with the workspace that only has a handul of projects but there the projects are all up to date. In the big workspace I have a big amount of projects using Spring Boot 1.5 and/or older versions of some Maven plugins.
ingogriebsch
on 30 Oct 2020
@ingogriebsch I haven't looked yet at the performance snapshots, but the screenshot that you attached points at another issue you are running into - which might cause some major headaches coming up... ;-(
The maven plugins of your projects are executed as part of the Maven Integration of Eclipse using the same JVM than the IDE itself is running on. Now it looks like some of your projects reference some Maven plugins in a version that is not compatible with anything > JDK8. The maven archiver is one example. Usually the solution to this would be to run your IDE on a JDK8... BUT... Eclipse requires a >= JDK11 to run since its 2020-09 release (which is the base for Spring Tools 4 for Eclipse since version 4.8.0). That means, the nice error message that we added and that you posted above points into the wrong direction. Changing your IDE to run on JDK8 WILL NOT WORK. We urgently need to change that error message.
The other solution to this issue is then to update the versions of the problematic Maven plugins to a newer version that is compatible with JDK11 or higher. The Spring Boot 1.5.x versions will most likely not upgrade those versions, so you would need to do that on your own and override the version of those plugins yourself in your pom files. I know that this is not a very pleasant solution, but I can't think of a better one at the moment.
Here is the corresponding bug at Eclipse, which also contains the snippet to add to your pom to make it work:
https://bugs.eclipse.org/bugs/show_bug.cgi?id=516887
We ship the latest JDK15 with Spring Tools 4 (to make it easy to use), but you can safely configure it to run on a different JDK, as long as it is a JDK >= 11.
(I am not sure this is related to the performance issue at all, btw)
martinlippert
on 30 Oct 2020
I looked into the VisualVM profiling data, thanks a lot for attaching that. The only thing that I can see happening inside is something that scans for task tags. I haven't seen that consuming so much time and I am not sure whether that is the piece that is causing the issue, but maybe worth a try.
In the preferences, there is a preference to enable and disable task tag scanning: Preferences -> General -> Editors -> Structured Text Editors -> Task Tag. In there, you can enable/disable that scanning altogether or disable it for specific file types. Can you try to disable that altogether, to see if that makes a difference and helps?
martinlippert
on 6 Nov 2020
@martinlippert I have actually configured a 'custom' tag. But removing this tag from the configuration does sadly not help to reduce the CPU load.
The other solution to this issue is then to update the versions of the problematic Maven plugins to a newer version that is compatible with JDK11 or higher. The Spring Boot 1.5.x versions will most likely not upgrade those versions, so you would need to do that on your own and override the version of those plugins yourself in your pom files. I know that this is not a very pleasant solution, but I can't think of a better one at the moment.
I did not had a chance to configure the plugin in the projects that are based on the 'old' Spring Boot version but I will do. I only need a moment of time to handle this.
I will report back here as soon as I have some news! :)
ingogriebsch
on 9 Nov 2020
Can you disable the task tag scanning altogether to see if that makes a difference? And in case it doesn't make a difference, maybe capture another profiling session with that task scanning disabled? That would be interesting to see.
martinlippert
on 9 Nov 2020
@martinlippert Looks like disabling the task tag scanning makes the difference!
If I disable the Enable searching for Task Tags option and apply the change, I can see how the CPU load decreases down to 0-1%. If I enable the option again it takes 1 or 2 minutes until I'm again on 16-19%. It makes no difference if I have added my custom tag to the list of Task Tags or not (as you can see in the screenshot).
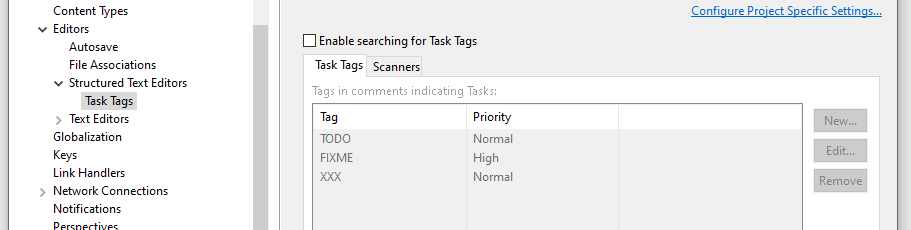
It looks like I do not need to configure the maven-plugin anymore (at least because I need to investigate the root of this problem).
But how to continue from here? Is the problem related to STS? Or ist it rooted in the Eclipse distribution? And if so, should I file a bug ticket on the Eclipse bug-tracker? Or are you able/willing to forward this problem to the guys and gals there?
ingogriebsch
on 10 Nov 2020
This seems to be rooted in the JavaScript task tag scanning that is part of the old Eclipse JSDT tooling. Therefore, I submitted the bug report to Eclipse: https://bugs.eclipse.org/bugs/show_bug.cgi?id=568668 - would be good if you could add you in CC to that report, I am sure there are additional questions for you coming up there.
In addition to that we could also try one more thing: Enable the overall Task Tag scanning again, but then disable the JavaScript Source File scanner in the list of all the scanners. Does that make a difference? If so, maybe this could be a way to continue to use this feature in general and for your own task tags, but get rid of the constant CPU load.
Since we found the root cause and submitted the bug to Eclipse, I am closing this item here for now. But please continue to comment on my previous idea whether selectively disabling the JavaScript source file scanner solves the problem, too.
martinlippert
on 10 Nov 2020
And please let us know if you observe additional performance issues when using your larger workspace... :-)
martinlippert
on 10 Nov 2020
@martinlippert I added myself to the Eclipse bug ticket and will be available if questions arise from their side.
I enabled the task tag scanning again and only disabled the JavaScript Source File scanning in my IDE. It seems to be sufficient to solve the problem. Means, the CPU load is at 0-1%, the fan is quite and I can work smoothly. Even if I add some custom tags again it is still fine. And because I do not work actively on the JavaScript projects, it is not a problem to disable the scanner as a workaround.
I owe a beer on the next conference or so for your permanent support! You helped me a lot to understand the root of the problem and to be able to work smoothly again. :)
ingogriebsch
on 10 Nov 2020
@ingogriebsch That is great to hear, thanks so much for the great feedback. Always happy to help and happy to meet at an upcoming conference - as soon as in-person conferences are possible again.
martinlippert
on 10 Nov 2020
Related issues
 drnic
·
8Comments
drnic
·
8Comments
 subrat086
·
8Comments
subrat086
·
8Comments
 playdev-co-kr
·
10Comments
playdev-co-kr
·
10Comments
 shua
·
6Comments
shua
·
6Comments
 gsmachado
·
7Comments
gsmachado
·
7Comments