Sts4: Newly created app in doesn't stop and start with Lifecycle management bean checked/unchecked.
Hi Team,
I have created new demo app in STS 4.7 and also one using spring.io. These apps started showing abnormal behavior after some time. Apps won't stop when attempting to stop also they wont start tomcat and last line "Started Application..." wont show up.
Wheel keeps spinning if Lifecycle management bean checkbox is checked, but when we uncheck it, it just shows running icon instead of wheel but never actually starts. Also port number is not shown.
Also browser doesn't open and shows inactive.
I have tried disabling antivirus as well but still it doesn't work.
Also the apps which are imported work totally fine without any workaround.
Please help.
STS version: 4.7
Windows 10 *64
JDK 1.8


 DeveloperNiks
All 12 comments
What you describe sounds to me like STS is having some issues to connect to the app processes over JMX. So trying firewall was a good idea, too bad that didn't work.
What happens when you try to connect to any of the apps using tools like jps and jconsole? These tools use very similar mechanics to connect to local Java processes. So it would be interesting to know if these tools work or are also having similar problems.
I see some error markers on your projects in the screenshots. These are indications that there is something Eclipse does not like about your project. Maybe it is unrelated, but what are the errors exactly? You should be able to see them in the problems view.
 kdvolder
on 15 Oct 2020
kdvolder
on 15 Oct 2020
@kdvolder I am sorry for the unedited screenshots, but those errors are not an issue, I am not running those projects. Projects in question are (demo,spring-boot-camel), these are created in STS while camel-spring-boot is imported project which works completely fine ( Check 2nd and 3rd screenshot for boot dashboard and logs).
Problem I am facing is when I run these projcts (demo,spring-boot-camel) with LifecycleManagement Bean box in launch configuration checked, I see following issues:
- "Started Application...." and "Tomcat started..." these lines don't come up in logs i.e. app doesn't start, when I hit it from browser it gives me 404.
- Internal browser icon doesn't get activated in boot dashboard.
- Wheel keeps spinning against the project in boot dashboard and never shows green arrow for running.
- When I attempt to stop, it never actually stops, It just says "Application Shutdown requested" and I have to restart STS everytime.
When I uncheck Lifecycle Management Bean box then I see following things:
- "Started Application...." and "Tomcat started..." these lines come up in logs, app gets started but in boot dashboard it does not show port number after project as it should show something like this: demo[8080] but it shows demo[unknown port].
- Internal browser doesn't 'get activated.
I tried disabling firewall also but still I face the issue. I did not attempt anything with jconsole or jps but I doubt it can be an issue because imported apps work fine.
DeveloperNiks
on 16 Oct 2020
Okay, the problems you describe such as 'wheel keeps spinning' and 'app doesn't stop' and 'unknown port'... those all point at STS being unable to connect to the app processes via JMX. The state of the 'spinner' is read via JMX, same of the port, and the request to stop the app... also. So something is interferring with the mechanism STS uses to connect to app on JMX.
I'm not sure what would be interferring with the ability of STS JVM to connect to other local processes. It probably something about how the JVM is installed, or some security feature on your machine that blocks it somehow.
In the past I remember problems on Windows because of 3 different causes:
- incorrect permission on temp files / folders (the mechanism for discovering local processes somehow relies on one VM proecess creating a temp file and the other one reading it).
- security tool on a corporate laptop that had extra security installed that limited shared memory accesses (somehow this also broke the JMX connections).
- running jvm on separate file system (e.g. some kind of containerized environment) the problem is similar as the permissions issue, the tmp folder is not accessible because its on another file system.
It would be helpful if you try to use tools like jps, jstack and jconsole to connect to the processes. These are tools included with the JVM and they use a very similar mechanism as STS. So verifying if these tools work provides an interesting data point.
PS: This may be helpful https://stackoverflow.com/questions/3805376/jps-returns-no-output-even-when-java-processes-are-running. I have run into this problem in the past and I think in my case it was fixed by deleting all 'hsperf' files/folders from the tmp directory. These had somehow wrong permissions. The JVM then recreated them next time with correct permissions. But you can see from the SO post that people have had a number of different but similar problems (and solutions).
kdvolder
on 16 Oct 2020
Here's another relevant link.
The 'workaround' in there ...
delete hsperfdata_* directory in Windows temp directory defined by %TMP%"
... is what has worked for me when I ran into the problem myself. It may also work for you... hopefully :-)
kdvolder
on 16 Oct 2020
@DeveloperNiks Does your thumbs up mean that this solved the issue for you? Or is there anything left that needs work/investigation here?
 martinlippert
on 20 Oct 2020
martinlippert
on 20 Oct 2020
@martinlippert, @kdvolder I am still triaging the issue, I was able to connect this process via jconsole and it is connecting fine, I am trying to figure out if there is anything I can deduce from the information in jconsole.
That strikes out the possibility of jdk/jvm/permission issue.
Although still I see wheel keeps spinning , no browser icon enabled and no "Application started.." line in the logs. So unable to hit the endpoint.
I see main is waiting on latch.
Below are some logs from Thread tab:
Name: main
State: WAITING on java.util.concurrent.CountDownLatch$Sync@7683cc02
Total blocked: 126  Total waited: 9

Stack trace:
sun.misc.Unsafe.park(Native Method)
java.util.concurrent.locks.LockSupport.park(LockSupport.java:175)
java.util.concurrent.locks.AbstractQueuedSynchronizer.parkAndCheckInterrupt(AbstractQueuedSynchronizer.java:836)
java.util.concurrent.locks.AbstractQueuedSynchronizer.doAcquireSharedInterruptibly(AbstractQueuedSynchronizer.java:997)
java.util.concurrent.locks.AbstractQueuedSynchronizer.acquireSharedInterruptibly(AbstractQueuedSynchronizer.java:1304)
java.util.concurrent.CountDownLatch.await(CountDownLatch.java:231)
org.apache.camel.main.MainSupport.waitUntilCompleted(MainSupport.java:377)
org.apache.camel.main.MainSupport.run(MainSupport.java:141)
org.apache.camel.spring.boot.CamelSpringBootApplicationController.run(CamelSpringBootApplicationController.java:68)
org.apache.camel.spring.boot.CamelMainRunController$DaemonTask.run(CamelMainRunController.java:43)
java.lang.Thread.run(Thread.java:748)
org.apache.camel.spring.boot.CamelMainRunController.start(CamelMainRunController.java:36)
org.apache.camel.spring.boot.RoutesCollector.onApplicationEvent(RoutesCollector.java:113)
org.apache.camel.spring.boot.RoutesCollector.onApplicationEvent(RoutesCollector.java:41)
org.springframework.context.event.SimpleApplicationEventMulticaster.doInvokeListener(SimpleApplicationEventMulticaster.java:172)
org.springframework.context.event.SimpleApplicationEventMulticaster.invokeListener(SimpleApplicationEventMulticaster.java:165)
org.springframework.context.event.SimpleApplicationEventMulticaster.multicastEvent(SimpleApplicationEventMulticaster.java:139)
org.springframework.context.support.AbstractApplicationContext.publishEvent(AbstractApplicationContext.java:398)
org.springframework.context.support.AbstractApplicationContext.publishEvent(AbstractApplicationContext.java:355)
org.springframework.context.support.AbstractApplicationContext.finishRefresh(AbstractApplicationContext.java:882)
org.springframework.boot.web.servlet.context.ServletWebServerApplicationContext.finishRefresh(ServletWebServerApplicationContext.java:163)
org.springframework.context.support.AbstractApplicationContext.refresh(AbstractApplicationContext.java:549)
   - locked java.lang.Object@6cd9a985
org.springframework.boot.web.servlet.context.ServletWebServerApplicationContext.refresh(ServletWebServerApplicationContext.java:142)
org.springframework.boot.SpringApplication.refresh(SpringApplication.java:775)
org.springframework.boot.SpringApplication.refreshContext(SpringApplication.java:397)
org.springframework.boot.SpringApplication.run(SpringApplication.java:316)
org.springframework.boot.SpringApplication.run(SpringApplication.java:1260)
org.springframework.boot.SpringApplication.run(SpringApplication.java:1248)
com.demo.RabbitMqApp.main(RabbitMqApp.java:10)
Name: JMX server connection timeout 35
State: TIMED_WAITING on [I@57b94426
Total blocked: 106  Total waited: 107

Stack trace:
java.lang.Object.wait(Native Method)
com.sun.jmx.remote.internal.ServerCommunicatorAdmin$Timeout.run(ServerCommunicatorAdmin.java:168)
java.lang.Thread.run(Thread.java:748)
I see one class is not loaded, but I am not sure if that is related and not able to find out which class is unloaded. ( VM Summary screenshot)
Need to compare it with working project.


DeveloperNiks
on 20 Oct 2020
Need to compare it with working project
Just to clarify, this means you are having this problem only with a specific project? I.e. there are other projects for which things work just fine. This is important to know since it points more at a issue about the project, rather than a more wide-spread issue of something blocking JMX connections altogether.
Maybe there is some slighyly unusual configuration that affects JMX beans in your app.
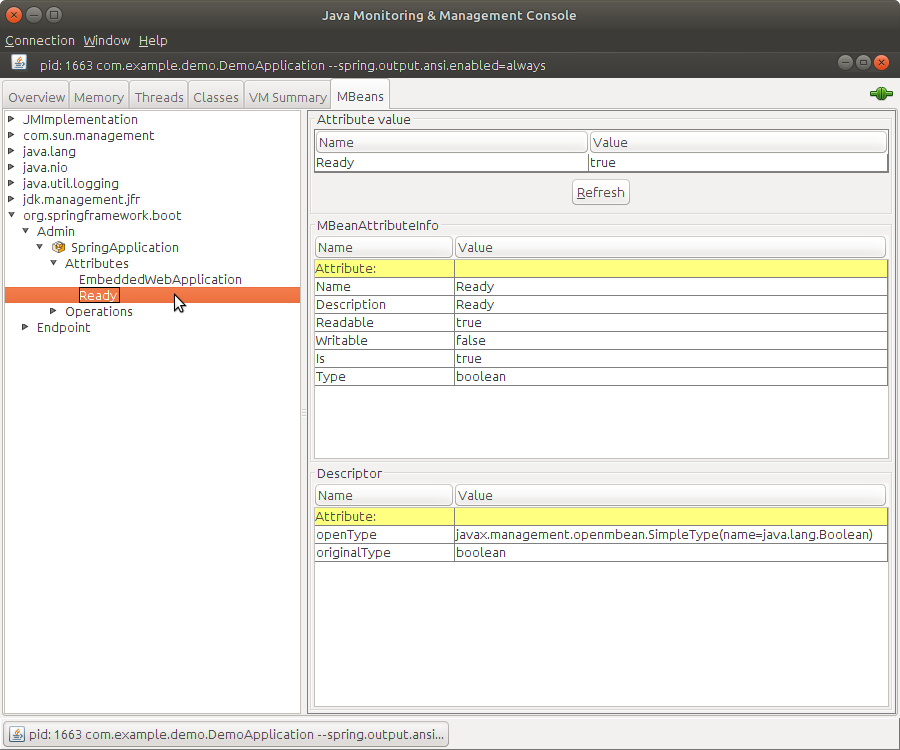
If you can connect jconsole to the app in question try looking for the spring boot admin bean. (I'll add a screenshot in a bit).
kdvolder
on 21 Oct 2020
Screenshot I promised:
kdvolder
on 21 Oct 2020
PS: Didn't mention it before, but the browser icon being greyed is also a symptom of same problem. This icon is disable because the port is unknown, which means we cannot compute url for the app and so we cannot open it in a browser and so... browser button is disabled.
kdvolder
on 21 Oct 2020
On a hunch... I tried something and it reproduces a very similar behavior as @DeveloperNiks described.
I add this component to a simple web app that otherwise works fine:
@Component
public class StartupBlocker implements CommandLineRunner {

    @Override
    public void run(String... args) throws Exception {
        while (true) {
            System.out.println("Blocking startup for another 10 seconds...");
            Thread.sleep(10_000);
        }
    }
}
Now when I start app it keeps spinner forever. Also browser button is disabled etc.
So I think what may be happening for you is something similar. There could be a long-running blocking operation that is started as part of some spring bean initialization in your app. So the bean never returns when spring/boot tries to initialize it. The consequence of this is that spring boot never reaches a state where it thinks app is fully booted up and so the 'ready' flag in the admin bean remains as 'false'. Something like that would cause the boot dash to behave the exact way that you describe.
That doesn't mean this is what's happening for you, but it is a possibility. If you have this problem only with a specific app it is a better fitting explanation than a general JMX connection issue. Pointing Jconsole at the app in question and inspecting the state of the 'ready' property in admin bean (see screenshot above), may help confirm whether this is what is happening.
kdvolder
on 21 Oct 2020
It was really a configuration problem. I had below line in properties file which was blocking main thread to keep camel up.
I checked MBeans and it was showing Ready as false.
camel.springboot.main-run-controller=true
Once I removed it, app started behaving as expected.
Thanks @kdvolder for your help!
DeveloperNiks
on 22 Oct 2020
Great!
kdvolder
on 22 Oct 2020
Related issues
 ingogriebsch
·
12Comments
ingogriebsch
·
12Comments
 arayariquelmes
·
4Comments
arayariquelmes
·
4Comments
 subrat086
·
8Comments
subrat086
·
8Comments
 AlessandroC85
·
4Comments
AlessandroC85
·
4Comments
 Samet-MohamedAmin
·
6Comments
Samet-MohamedAmin
·
6Comments