Spinalcordtoolbox: sct_pipeline: freezes and other resource limit issues when running sct_deepseg_{gm,sc} that rely on TensorFlow
- tried with and without MPI installation
- works with 16 subjects but freezes after ~4800 subjects
- tried with -nb-cpu of 32 and 127 (128 threads on joplin)
 jcohenadad
All 22 comments
this thing happened on cedar (compute canada), not sure if this is related:
~~~
...
Processing subjects... 2882/4539
Processing subjects... 2894/4539
Processing subjects... 2906/4539
Processing subjects... 2908/4539
= BAD TERMINATION OF ONE OF YOUR APPLICATION PROCESSES
= PID 106874 RUNNING AT cdr634
= EXIT CODE: 9
= CLEANING UP REMAINING PROCESSES
= YOU CAN IGNORE THE BELOW CLEANUP MESSAGES
[proxy:1:[email protected]] HYD_pmcd_pmip_control_cmd_cb (pm/pmiserv/pmip_cb.c:885
): assert (!closed) failed
[proxy:1:[email protected]] HYDT_dmxu_poll_wait_for_event (tools/demux/demux_poll.
c:76): callback returned error status
[proxy:1:[email protected]] main (pm/pmiserv/pmip.c:206): demux engine error waiti
ng for event
[proxy:1:[email protected]] HYD_pmcd_pmip_control_cmd_cb (pm/pmiserv/pmip_cb.c:885
): assert (!closed) failed
[proxy:1:[email protected]] HYDT_dmxu_poll_wait_for_event (tools/demux/demux_poll.
c:76): callback returned error status
[proxy:1:[email protected]] HYD_pmcd_pmip_control_cmd_cb (pm/pmiserv/pmip_cb.c:885
): assert (!closed) failed
[proxy:1:[email protected]] main (pm/pmiserv/pmip.c:206): demux engine error waiti
ng for event
[proxy:1:[email protected]] HYDT_dmxu_poll_wait_for_event (tools/demux/demux_poll.
c:76): callback returned error status
[proxy:1:[email protected]] main (pm/pmiserv/pmip.c:206): demux engine error waiti
ng for event
[proxy:1:[email protected]] HYD_pmcd_pmip_control_cmd_cb (pm/pmiserv/pmip_cb.c:88
5): assert (!closed) failed
[proxy:1:[email protected]] HYDT_dmxu_poll_wait_for_event (tools/demux/demux_poll
.c:76): callback returned error status
[proxy:1:[email protected]] main (pm/pmiserv/pmip.c:206): demux engine error wait
ing for event
[proxy:1:[email protected]] HYD_pmcd_pmip_control_cmd_cb (pm/pmiserv/pmip_cb.c:88
5): assert (!closed) failed
[proxy:1:[email protected]] HYD_pmcd_pmip_control_cmd_cb (pm/pmiserv/pmip_cb.c:885
): assert (!closed) failed
[proxy:1:[email protected]] HYDT_dmxu_poll_wait_for_event (tools/demux/demux_poll
.c:76): callback returned error status
[proxy:1:[email protected]] HYDT_dmxu_poll_wait_for_event (tools/demux/demux_poll.
c:76): callback returned error status
[proxy:1:[email protected]] HYD_pmcd_pmip_control_cmd_cb (pm/pmiserv/pmip_cb.c:885
): assert (!closed) failed
[proxy:1:[email protected]] HYDT_dmxu_poll_wait_for_event (tools/demux/demux_poll.
c:76): callback returned error status
[proxy:1:[email protected]] main (pm/pmiserv/pmip.c:206): demux engine error waiti
ng for event
[proxy:1:[email protected]] HYD_pmcd_pmip_control_cmd_cb (pm/pmiserv/pmip_cb.c:88
5): assert (!closed) failed
[proxy:1:[email protected]] HYDT_dmxu_poll_wait_for_event (tools/demux/demux_poll
.c:76): callback returned error status
[proxy:1:[email protected]] main (pm/pmiserv/pmip.c:206): demux engine error wait
ing for event
[proxy:1:[email protected]] HYD_pmcd_pmip_control_cmd_cb (pm/pmiserv/pmip_cb.c:88
5): assert (!closed) failed
[proxy:1:[email protected]] HYD_pmcd_pmip_control_cmd_cb (pm/pmiserv/pmip_cb.c:885
): assert (!closed) failed
[proxy:1:[email protected]] HYD_pmcd_pmip_control_cmd_cb (pm/pmiserv/pmip_cb.c:88
5): assert (!closed) failed
[proxy:1:[email protected]] main (pm/pmiserv/pmip.c:206): demux engine error waiti
ng for event
[proxy:1:[email protected]] main (pm/pmiserv/pmip.c:206): demux engine error wait
ing for event
[proxy:1:[email protected]] HYD_pmcd_pmip_control_cmd_cb (pm/pmiserv/pmip_cb.c:88
5): assert (!closed) failed
[proxy:1:[email protected]] HYD_pmcd_pmip_control_cmd_cb (pm/pmiserv/pmip_cb.c:88
5): assert (!closed) failed
[proxy:1:[email protected]] HYD_pmcd_pmip_control_cmd_cb (pm/pmiserv/pmip_cb.c:885
): assert (!closed) failed
[proxy:1:[email protected]] HYD_pmcd_pmip_control_cmd_cb (pm/pmiserv/pmip_cb.c:885
): assert (!closed) failed
[proxy:1:[email protected]] HYD_pmcd_pmip_control_cmd_cb (pm/pmiserv/pmip_cb.c:885
): assert (!closed) failed
[proxy:1:[email protected]] HYDT_dmxu_poll_wait_for_event (tools/demux/demux_poll
.c:76): callback returned error status
[proxy:1:[email protected]] HYDT_dmxu_poll_wait_for_event (tools/demux/demux_poll.
c:76): callback returned error status
[proxy:1:[email protected]] HYDT_dmxu_poll_wait_for_event (tools/demux/demux_poll
.c:76): callback returned error status
[proxy:1:[email protected]] HYDT_dmxu_poll_wait_for_event (tools/demux/demux_poll
.c:76): callback returned error status
[proxy:1:[email protected]] main (pm/pmiserv/pmip.c:206): demux engine error wait
ing for event
[proxy:1:[email protected]] main (pm/pmiserv/pmip.c:206): demux engine error waiti
ng for event
[proxy:1:[email protected]] main (pm/pmiserv/pmip.c:206): demux engine error wait
ing for event
[proxy:1:[email protected]] main (pm/pmiserv/pmip.c:206): demux engine error wait
ing for event
[proxy:1:[email protected]] HYDT_dmxu_poll_wait_for_event (tools/demux/demux_poll.
c:76): callback returned error status
[proxy:1:[email protected]] HYDT_dmxu_poll_wait_for_event (tools/demux/demux_poll.
c:76): callback returned error status
[proxy:1:[email protected]] main (pm/pmiserv/pmip.c:206): demux engine error waiti
ng for event
[proxy:1:[email protected]] main (pm/pmiserv/pmip.c:206): demux engine error waiti
ng for event
[proxy:1:[email protected]] HYD_pmcd_pmip_control_cmd_cb (pm/pmiserv/pmip_cb.c:88
5): assert (!closed) failed
[proxy:1:[email protected]] HYD_pmcd_pmip_control_cmd_cb (pm/pmiserv/pmip_cb.c:885
): assert (!closed) failed
[proxy:1:[email protected]] HYD_pmcd_pmip_control_cmd_cb (pm/pmiserv/pmip_cb.c:88
5): assert (!closed) failed
[proxy:1:[email protected]] HYDT_dmxu_poll_wait_for_event (tools/demux/demux_poll
.c:76): callback returned error status
[proxy:1:[email protected]] HYDT_dmxu_poll_wait_for_event (tools/demux/demux_poll
.c:76): callback returned error status
[proxy:1:[email protected]] HYDT_dmxu_poll_wait_for_event (tools/demux/demux_poll.
c:76): callback returned error status
[proxy:1:[email protected]] main (pm/pmiserv/pmip.c:206): demux engine error wait
ing for event
[proxy:1:[email protected]] main (pm/pmiserv/pmip.c:206): demux engine error wait
ing for event
[proxy:1:[email protected]] main (pm/pmiserv/pmip.c:206): demux engine error waiti
ng for event
[proxy:1:[email protected]] HYDT_dmxu_poll_wait_for_event (tools/demux/demux_poll
.c:76): callback returned error status
[proxy:1:[email protected]] main (pm/pmiserv/pmip.c:206): demux engine error wait
ing for event
[proxy:1:[email protected]] HYDT_dmxu_poll_wait_for_event (tools/demux/demux_poll.
c:76): callback returned error status
[proxy:1:[email protected]] main (pm/pmiserv/pmip.c:206): demux engine error waiti
ng for event
slurmstepd: error: Detected 25 oom-kill event(s) in step 8206236.1 cgroup.
slurmstepd: error: Detected 1 oom-kill event(s) in step 8206236.1 cgroup.
srun: error: cdr674: task 15: Exited with exit code 7
srun: Terminating job step 8206236.1
srun: error: cdr486: task 3: Exited with exit code 7
srun: error: cdr485: task 2: Exited with exit code 7
srun: error: cdr649: task 14: Exited with exit code 7
srun: error: cdr498: task 5: Exited with exit code 7
srun: error: cdr515: task 8: Out Of Memory
srun: error: cdr646: task 13: Exited with exit code 7
srun: error: cdr511: task 7: Exited with exit code 7
srun: error: cdr489: task 4: Exited with exit code 7
srun: error: cdr686: task 16: Exited with exit code 7
srun: error: cdr701: task 18: Exited with exit code 7
srun: error: cdr780: task 19: Exited with exit code 7
srun: error: cdr526: task 9: Exited with exit code 7
srun: error: cdr484: task 1: Exited with exit code 7
srun: error: cdr506: task 6: Exited with exit code 7
srun: error: cdr448: task 0: Exited with exit code 7
srun: error: cdr638: task 12: Exited with exit code 7
srun: error: cdr700: task 17: Exited with exit code 7
srun: error: cdr604: task 10: Exited with exit code 7
[[email protected]] HYDT_bscu_wait_for_completion (tools/bootstrap/utils/bsc
u_wait.c:76): one of the processes terminated badly; aborting
[[email protected]] HYDT_bsci_wait_for_completion (tools/bootstrap/src/bsci_
wait.c:23): launcher returned error waiting for completion
[[email protected]] HYD_pmci_wait_for_completion (pm/pmiserv/pmiserv_pmci.c:
218): launcher returned error waiting for completion
[[email protected]] main (ui/mpich/mpiexec.c:344): process manager error wai
ting for completion
~~~
jcohenadad
on 22 May 2018
I ran the following:
mkdir repo
for x in $(seq 1 1 5000); do ln -sf ../sct_testing_data repo/$(printf %04d $x); done
sct_pipeline -d $PWD/repo -f sct_image -pickle 1 -p \"-i t2/t2.nii.gz -type int16 -o t2-out.nii.gz\"
16 threads at once. Results:
Processing subjects... 5000/5000
GLOBAL RESULTS:
Duration: 1406s
Passed: 5000/5000
Crashed: 0/5000
Will try more...
 zougloub
on 22 May 2018
zougloub
on 22 May 2018
I see a "srun: error: cdr515: task 8: Out Of Memory" from cedar output. Maybe joplin had the same issue, but without verbose (maybe was trying to swap large amount of data?)
jcohenadad
on 22 May 2018
Have you evaluated the RAM requirements of running one job?
zougloub
on 22 May 2018
nope, not sure how to do it properly
jcohenadad
on 22 May 2018
An easy way is to run on a local machine and look at htop at the same time. Bonus: it's pretty.
zougloub
on 22 May 2018
percent --> CPU?
vertical bars --> ?
jcohenadad
on 22 May 2018
Window too small. You also have a RAM progress bar somewhere.
Also:
/usr/bin/time -v sct_...
Will tell you the maximum RSS, but it's not very reliable when many subprocesses are spawned, so better to run only one, and extrapolate.
zougloub
on 22 May 2018
ah sh... sorry about that. indeed
jcohenadad
on 22 May 2018
hum... currently ~25G out of 256G of RAM
jcohenadad
on 22 May 2018
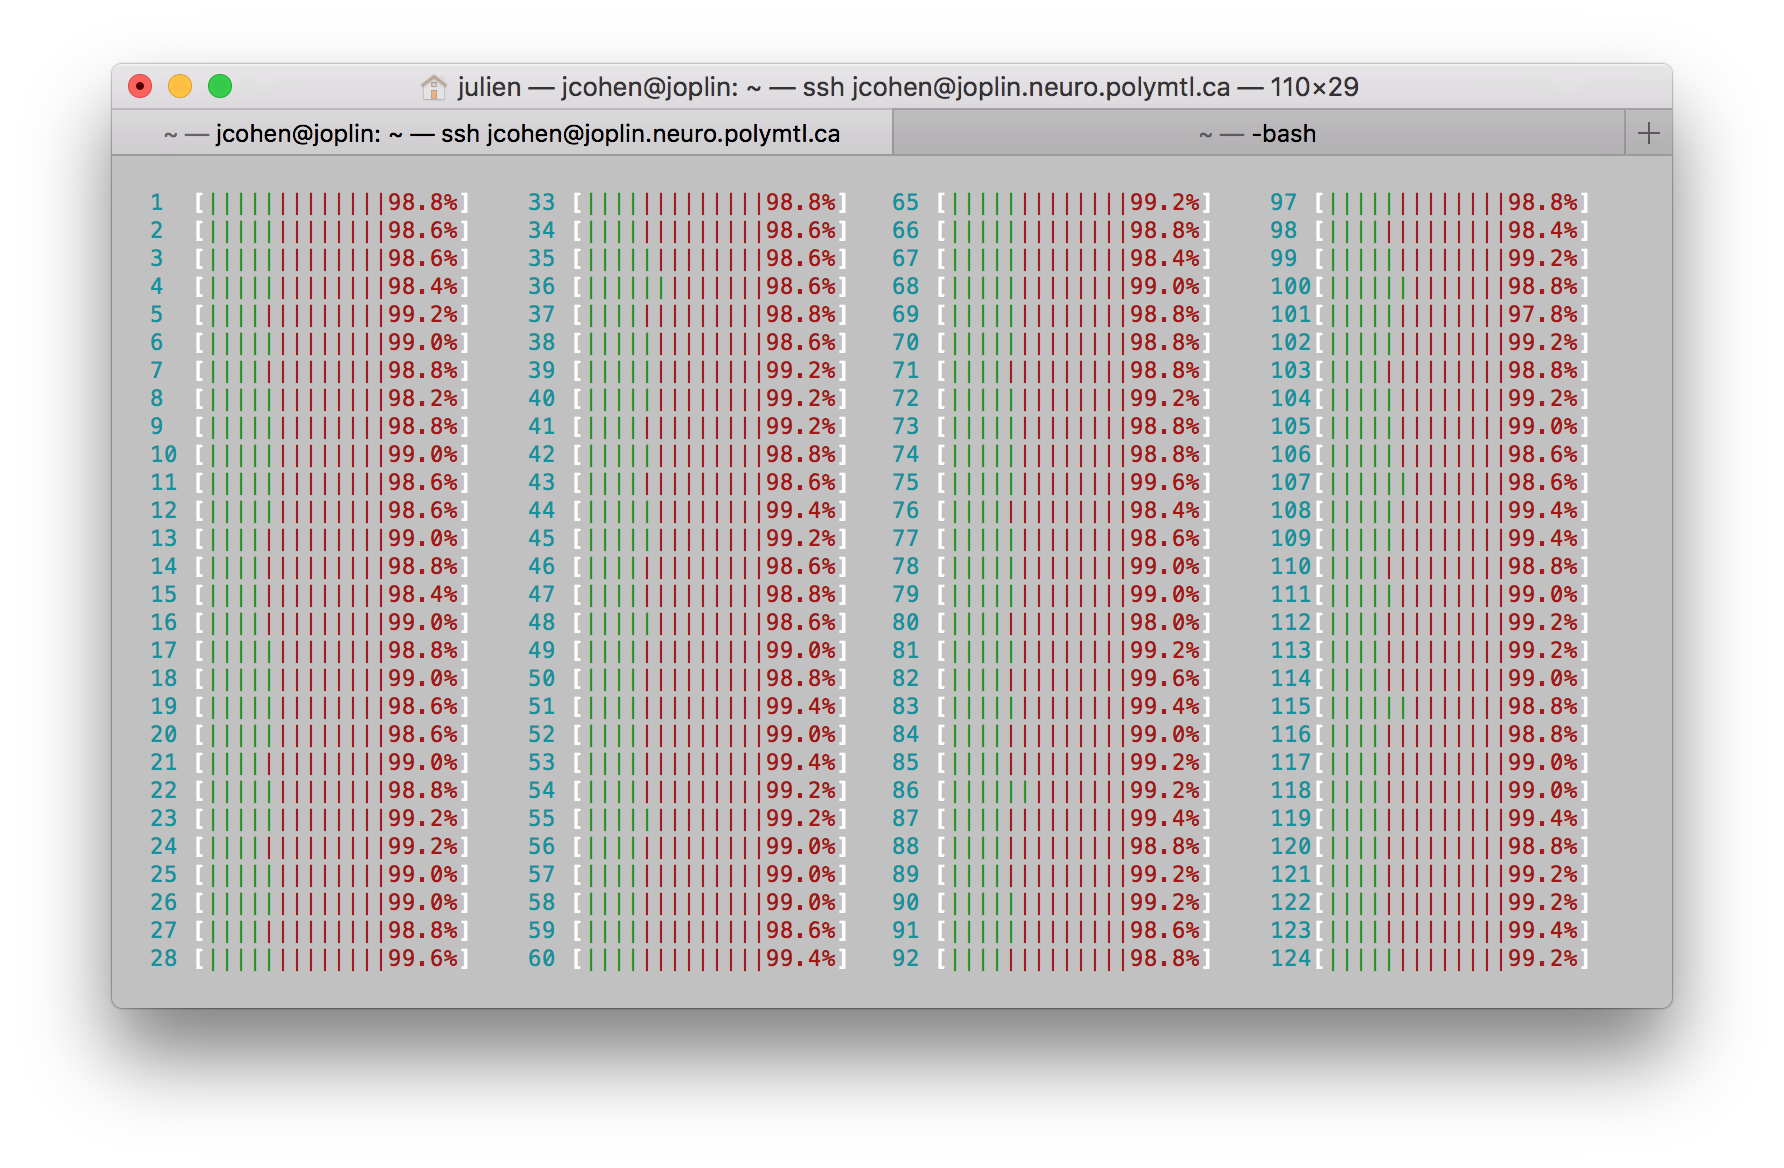
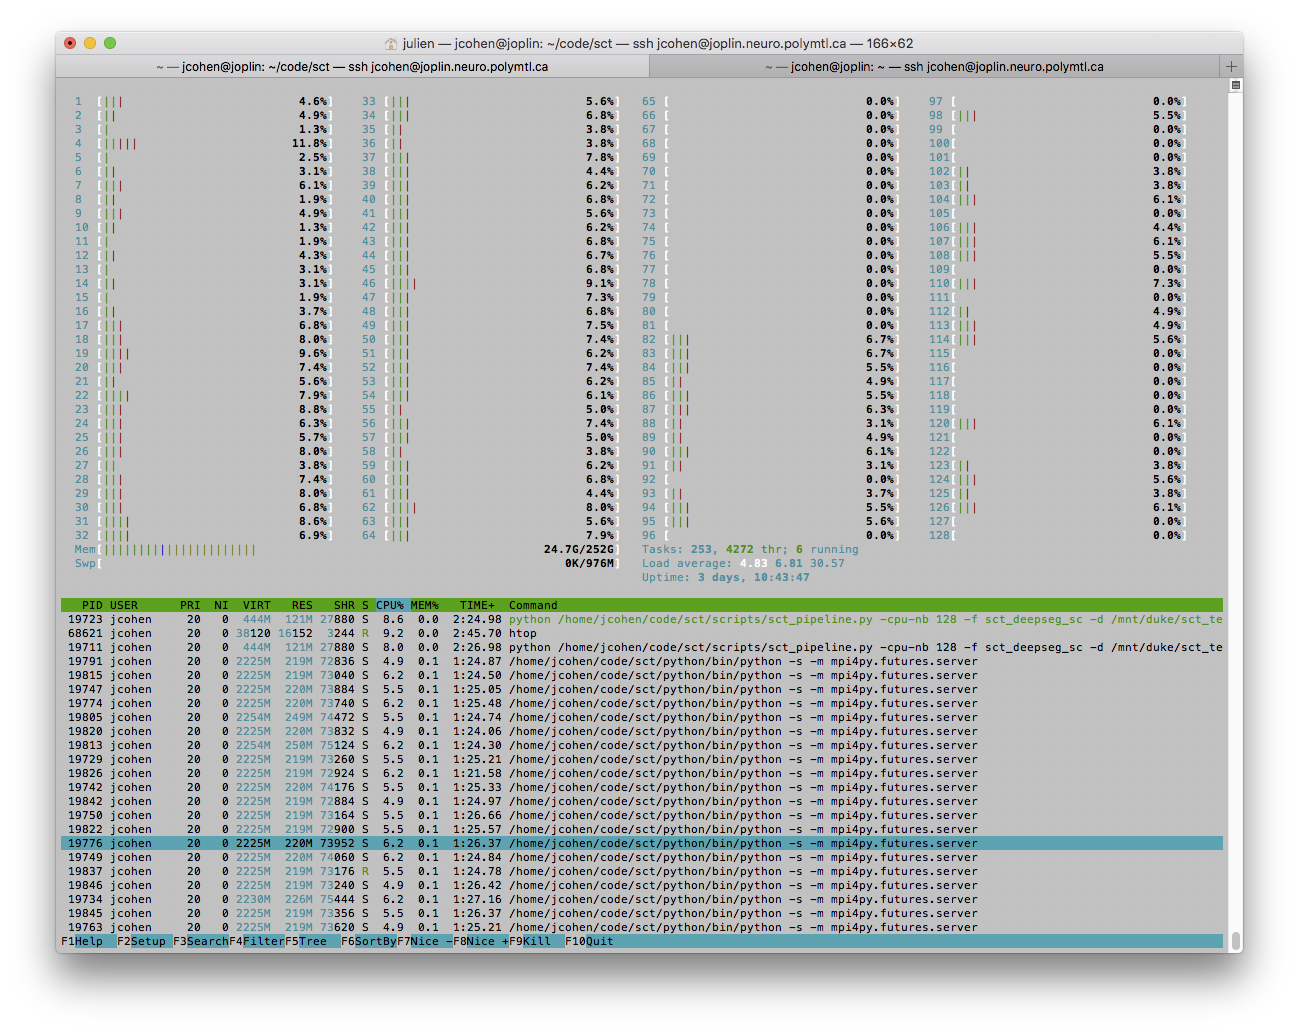
Below is a screenshot during the "freeze". The state of processed subjects is 4527/4539 (almost there!), but it's been like that for the past 30min, so it is definitely stuck. Below is a screenshot from htop, suggesting that it might not be a RAM issue (I think). Before it got stuck, htop was showing mostly those processes:

While now the majority shows:

jcohenadad
on 22 May 2018
And what happens with the standard, MPI-less install?
zougloub
on 22 May 2018
And what happens with the standard, MPI-less install?
that's exactly what i'm doing now. Update to come soon...
UPDATE 2018-05-22 11.27: I get a bunch of these. Will try with lower amount of asked threads (below is with -nb-cpu 128, where 128 threads are present-- BTW: we should probably rename nb-cpu in nb-thread? --> #1769 ).
~
error: can't start new thread
Processing subjects... 848/4539Process Process-11:
Traceback (most recent call last):
File "/home/jcohen/code/sct/python/lib/python2.7/multiprocessing/process.py", line 258, in _bootstrap
self.run()
File "/home/jcohen/code/sct/python/lib/python2.7/multiprocessing/process.py", line 114, in run
self._target(self._args, *self._kwargs)
File "/home/jcohen/code/sct/python/lib/python2.7/site-packages/concurrent/futures/process.py", line 135, in _process_worker
result=r))
File "/home/jcohen/code/sct/python/lib/python2.7/multiprocessing/queues.py", line 107, in put
Processing subjects... 849/4539 self._start_thread()
File "/home/jcohen/code/sct/python/lib/python2.7/multiprocessing/queues.py", line 195, in _start_thread
self._thread.start()
File "/home/jcohen/code/sct/python/lib/python2.7/threading.py", line 736, in start
_start_new_thread(self.__bootstrap, ())
error: can't start new thread
~
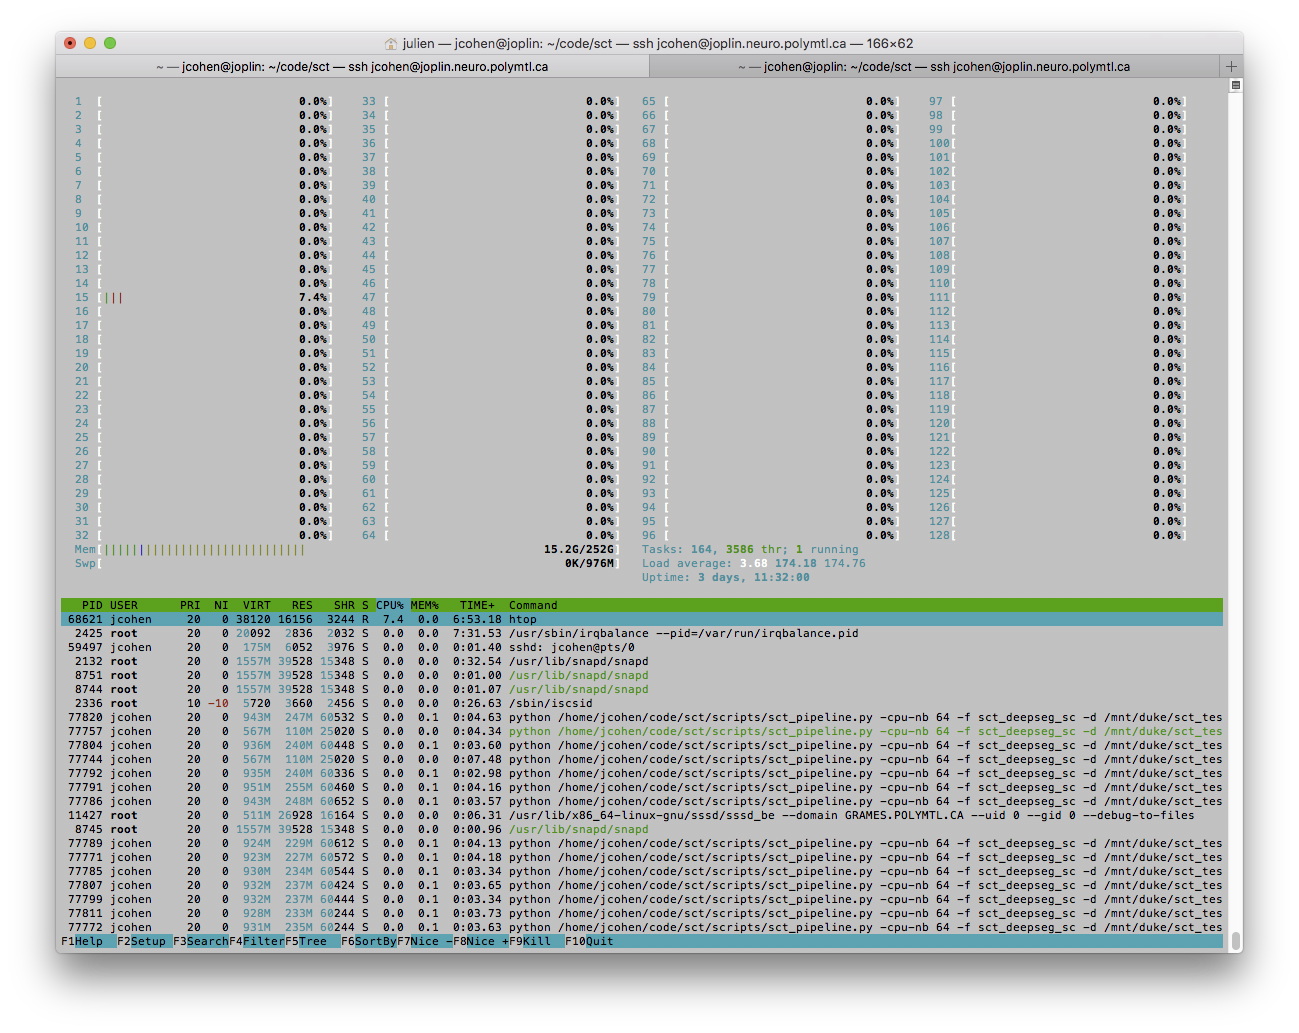
UPDATE 2018-05-22 11.41: tried with 64/128 threads, and only got one "can't start new thread". But the problematic thing is that it is stuck again, now at 4529/4539 subjects. What's "funny" is that no CPU seem to be working (see below), so my guess is that some processes had some issues, but they were not properly terminated by ProcessPoolExecutor:
jcohenadad
on 22 May 2018
Spawning a subprocess per object?
This needs a redesign. Very much so.
 knelistonie
on 27 May 2018
knelistonie
on 27 May 2018
In non-MPI mode, the multiprocessing pool spawns M worker processes, which differs from the N number of work items (subjects). Not sure what you mean @knelistonie.
zougloub
on 27 May 2018
things i will check:
~
/var/log/messages
/var/log/kern.log
dmesg (it's a command)
~
execute a tail like: "tail -f /var/log/messages" in one terminal before executing the sct_pipeline, if there is a system error, it will appear there.
jcohenadad
on 27 May 2018
So N is not N objects, ok. But that many processes cannot but lead to troubles.
Verstuurd vanaf mijn iPad
regards, kneistonie
Op 27 mei 2018 om 02:50 heeft Jérôme Carretero <[email protected]notifications@github.com> het volgende geschreven:
In non-MPI mode, the multiprocessing pool spawns M worker processes, which differs from the N number of work items (subjects). Not sure what you mean @knelistoniehttps://github.com/knelistonie.
—
You are receiving this because you were mentioned.
Reply to this email directly, view it on GitHubhttps://github.com/neuropoly/spinalcordtoolbox/issues/1765#issuecomment-392297405, or mute the threadhttps://github.com/notifications/unsubscribe-auth/AHTQRrQgFzdIUd9csGCePr1yfhYBG_wMks5t2fhpgaJpZM4UHqaE.
knelistonie
on 27 May 2018
I think I found the culprit for the high CPU usage. TensorFlow actually uses every core available for parallelism, it has some internal thread pools, so the problem can be that when you run sct_deepseg_gm/sc, each process will use all cores available to speed up the computation, and this might be causing the issues in Joplin. I just executed a sct_pipeline there now and I saw that all cores were used even when I specified just 1 thread in the thread pool. We can limit that to avoid these issues and still have a good compromise on tensorflow parallelism. In summary the problem is:
sct_pipelinespawns a lot of processes;- each spawned
sct_pipelineprocess (when using a tool that uses TensorFlow), will use all available cores;
Another solution to solve this is to disable or reduce the parallelism on sct_pipeline when using sct_deepseg_gm or sct_deepseg_sc, because they have their own parallelization mechanism (TensorFlow), which means that the gains of using a lot of parallelization on sct_pipeline will always be very small for these tools.
 perone
on 19 Jun 2018
perone
on 19 Jun 2018
Hadn't thought about that...
It may lead to RAM outage because we'd "just" have 128 processes of 128 threads each, which at a default 8M stack (I'm expecting TF to not have used a custom stack size) amounts to 128 GB of RAM just for stacks ;)
zougloub
on 20 Jun 2018
Great catch @perone, so, with the same logic as what we do here to force the number of core to 1 for multiprocessing functions (e.g. sct_straighten_spinalcord), we should do the same for TF's applications. Is there an environment variable that we can set there?
jcohenadad
on 20 Jun 2018
I wasn't able to find any environment variable that TensorFlow uses to control that, the only way to configure that seems to be in the TensorFlow session setting the parameters intra_op_parallelism_threads and inter_op_parallelism_threads. We can also add a checking in the sct_pipeline to force the number of threads in the threading pool to 1 when the command being tested is one of the tools using TensorFlow.
perone
on 20 Jun 2018
ok, since there is no easy way to limit the number of cores used by tensorflow, the solution is just to limit the number of jobs (ideally to one) for all functions that use tensorflow.
jcohenadad
on 5 Jul 2018
Related issues
 stephaniealley
·
19Comments
stephaniealley
·
19Comments
 PaulBautin
·
19Comments
zougloub
·
26Comments
jcohenadad
·
28Comments
PaulBautin
·
19Comments
zougloub
·
26Comments
jcohenadad
·
28Comments
 joshuacwnewton
·
20Comments
joshuacwnewton
·
20Comments
Most helpful comment
I think I found the culprit for the high CPU usage. TensorFlow actually uses every core available for parallelism, it has some internal thread pools, so the problem can be that when you run
sct_deepseg_gm/sc, each process will use all cores available to speed up the computation, and this might be causing the issues in Joplin. I just executed asct_pipelinethere now and I saw that all cores were used even when I specified just 1 thread in the thread pool. We can limit that to avoid these issues and still have a good compromise on tensorflow parallelism. In summary the problem is:sct_pipelinespawns a lot of processes;sct_pipelineprocess (when using a tool that uses TensorFlow), will use all available cores;Another solution to solve this is to disable or reduce the parallelism on
sct_pipelinewhen usingsct_deepseg_gmorsct_deepseg_sc, because they have their own parallelization mechanism (TensorFlow), which means that the gains of using a lot of parallelization onsct_pipelinewill always be very small for these tools.