Site-kit-wp: "Previous reporting period"s date is matching the current reporting periods date in Analytics Audience overview popup label
Bug Description
As reported in a WordPress support forum topic the month attached to each axis in the "Previous period" matches the current periods reporting month.
Steps to reproduce

Additional Context
- Tested in support & reproducible on all sites checked
- Same issue arises across all date ranges
- Original support forum topic: https://wordpress.org/support/topic/audience-overview-previous-period
_Do not alter or remove anything below. The following sections will be managed by moderators only._
Acceptance criteria
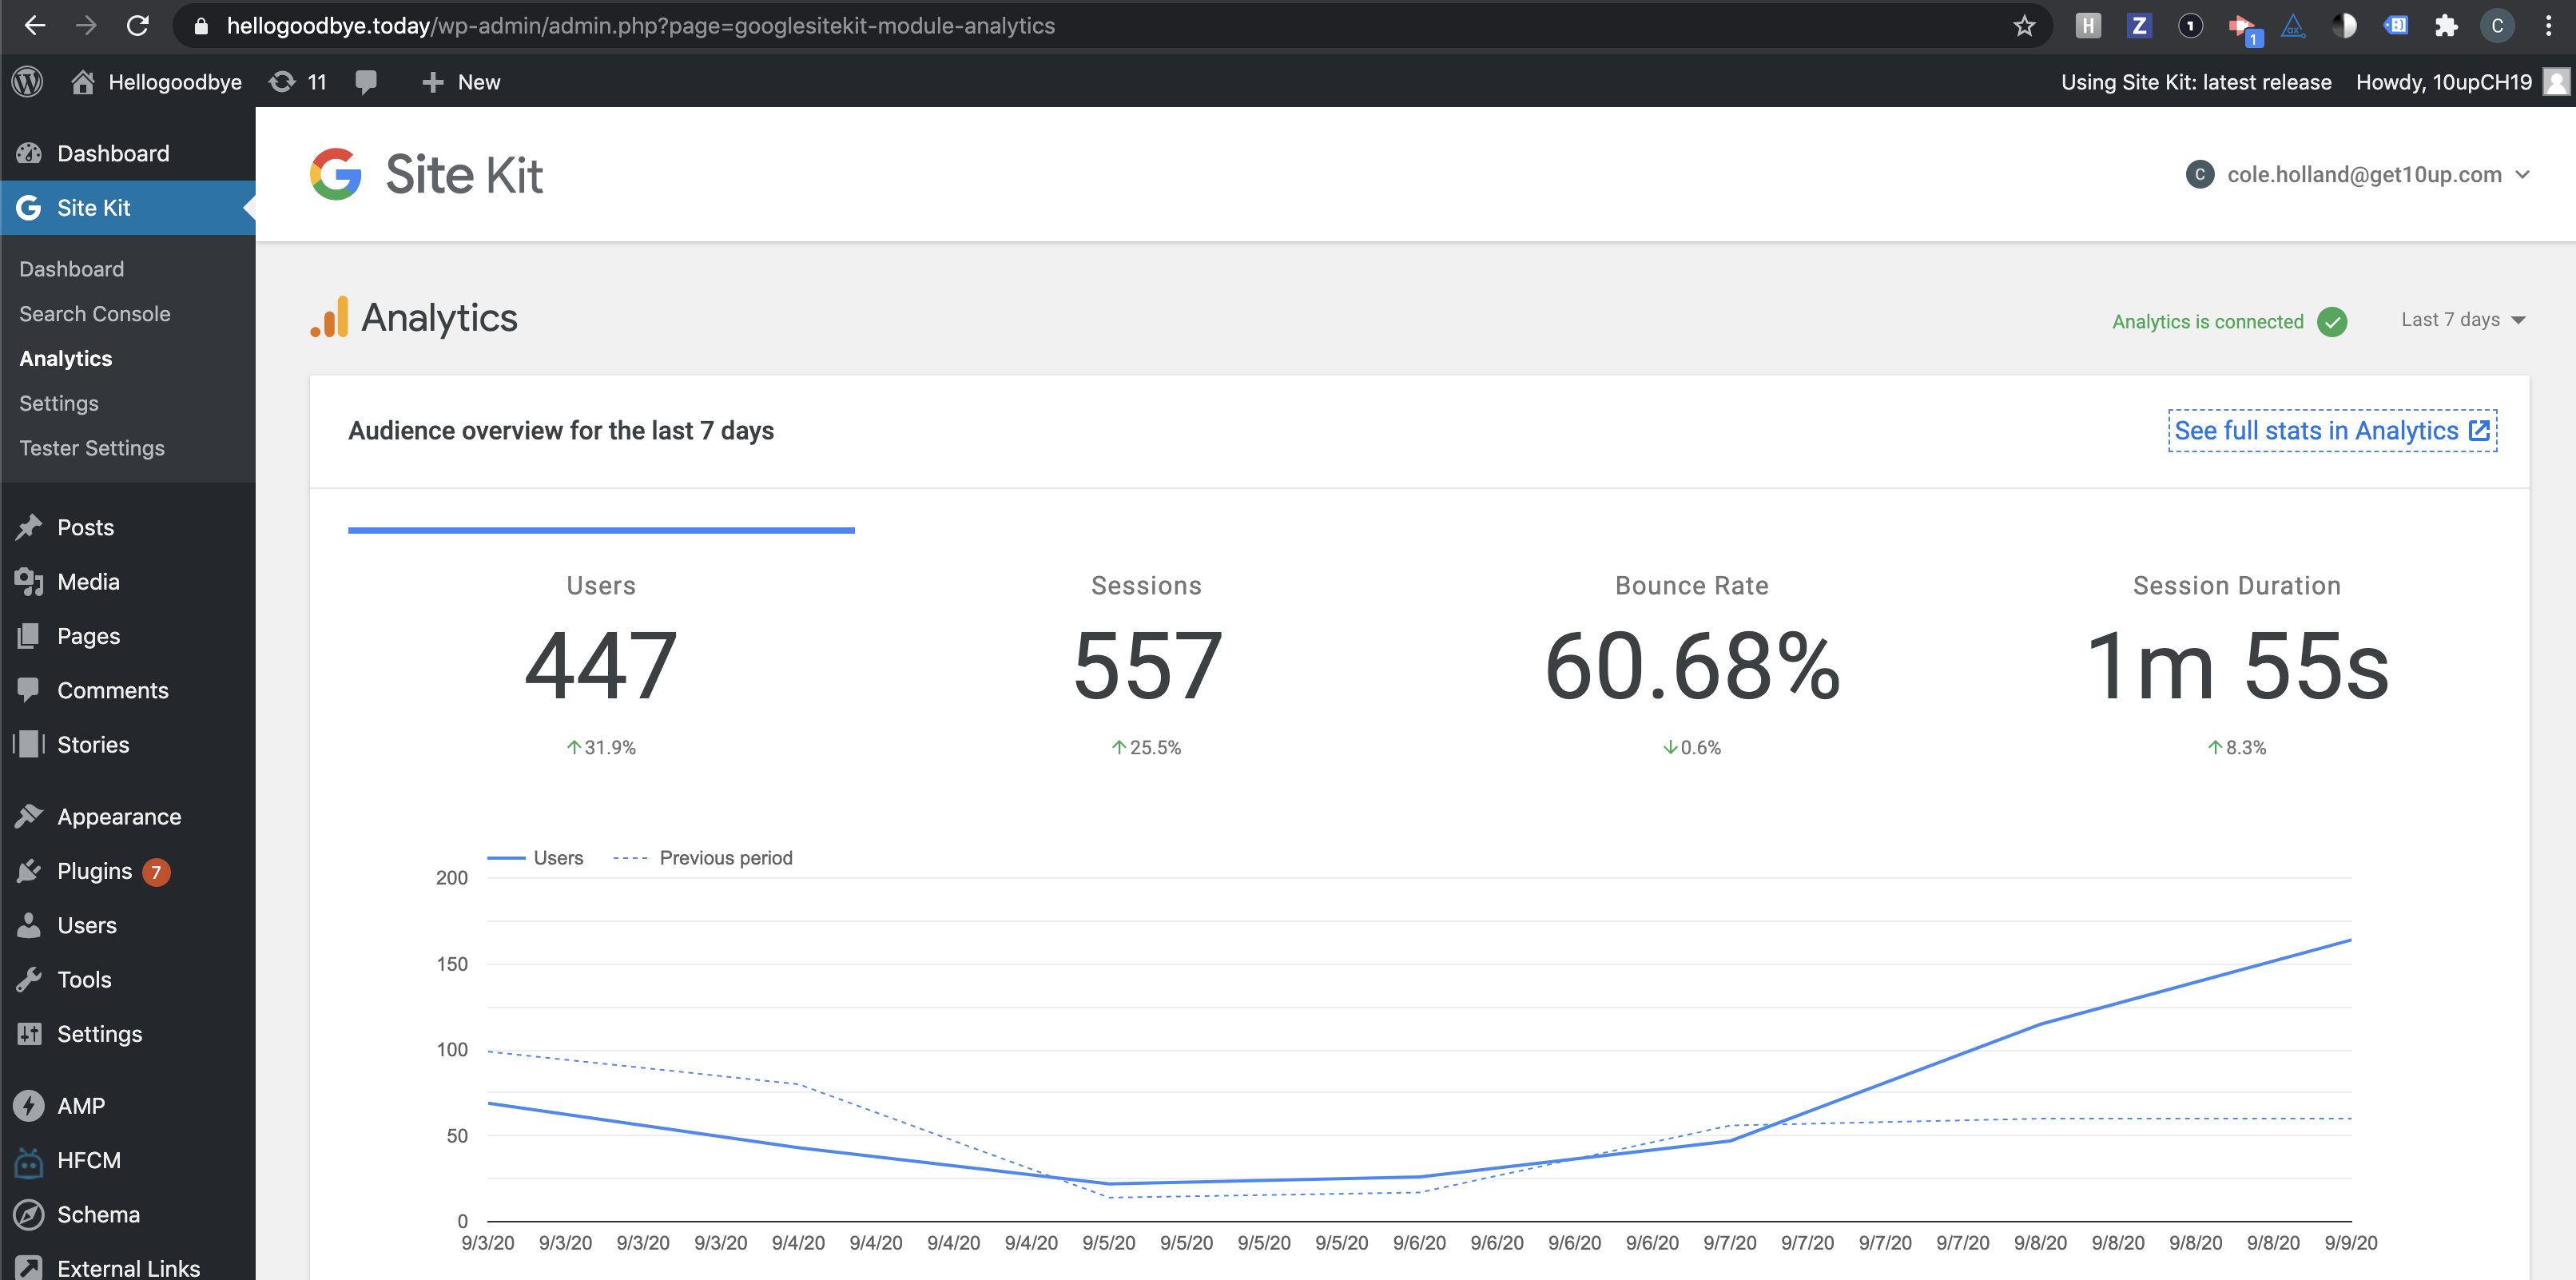
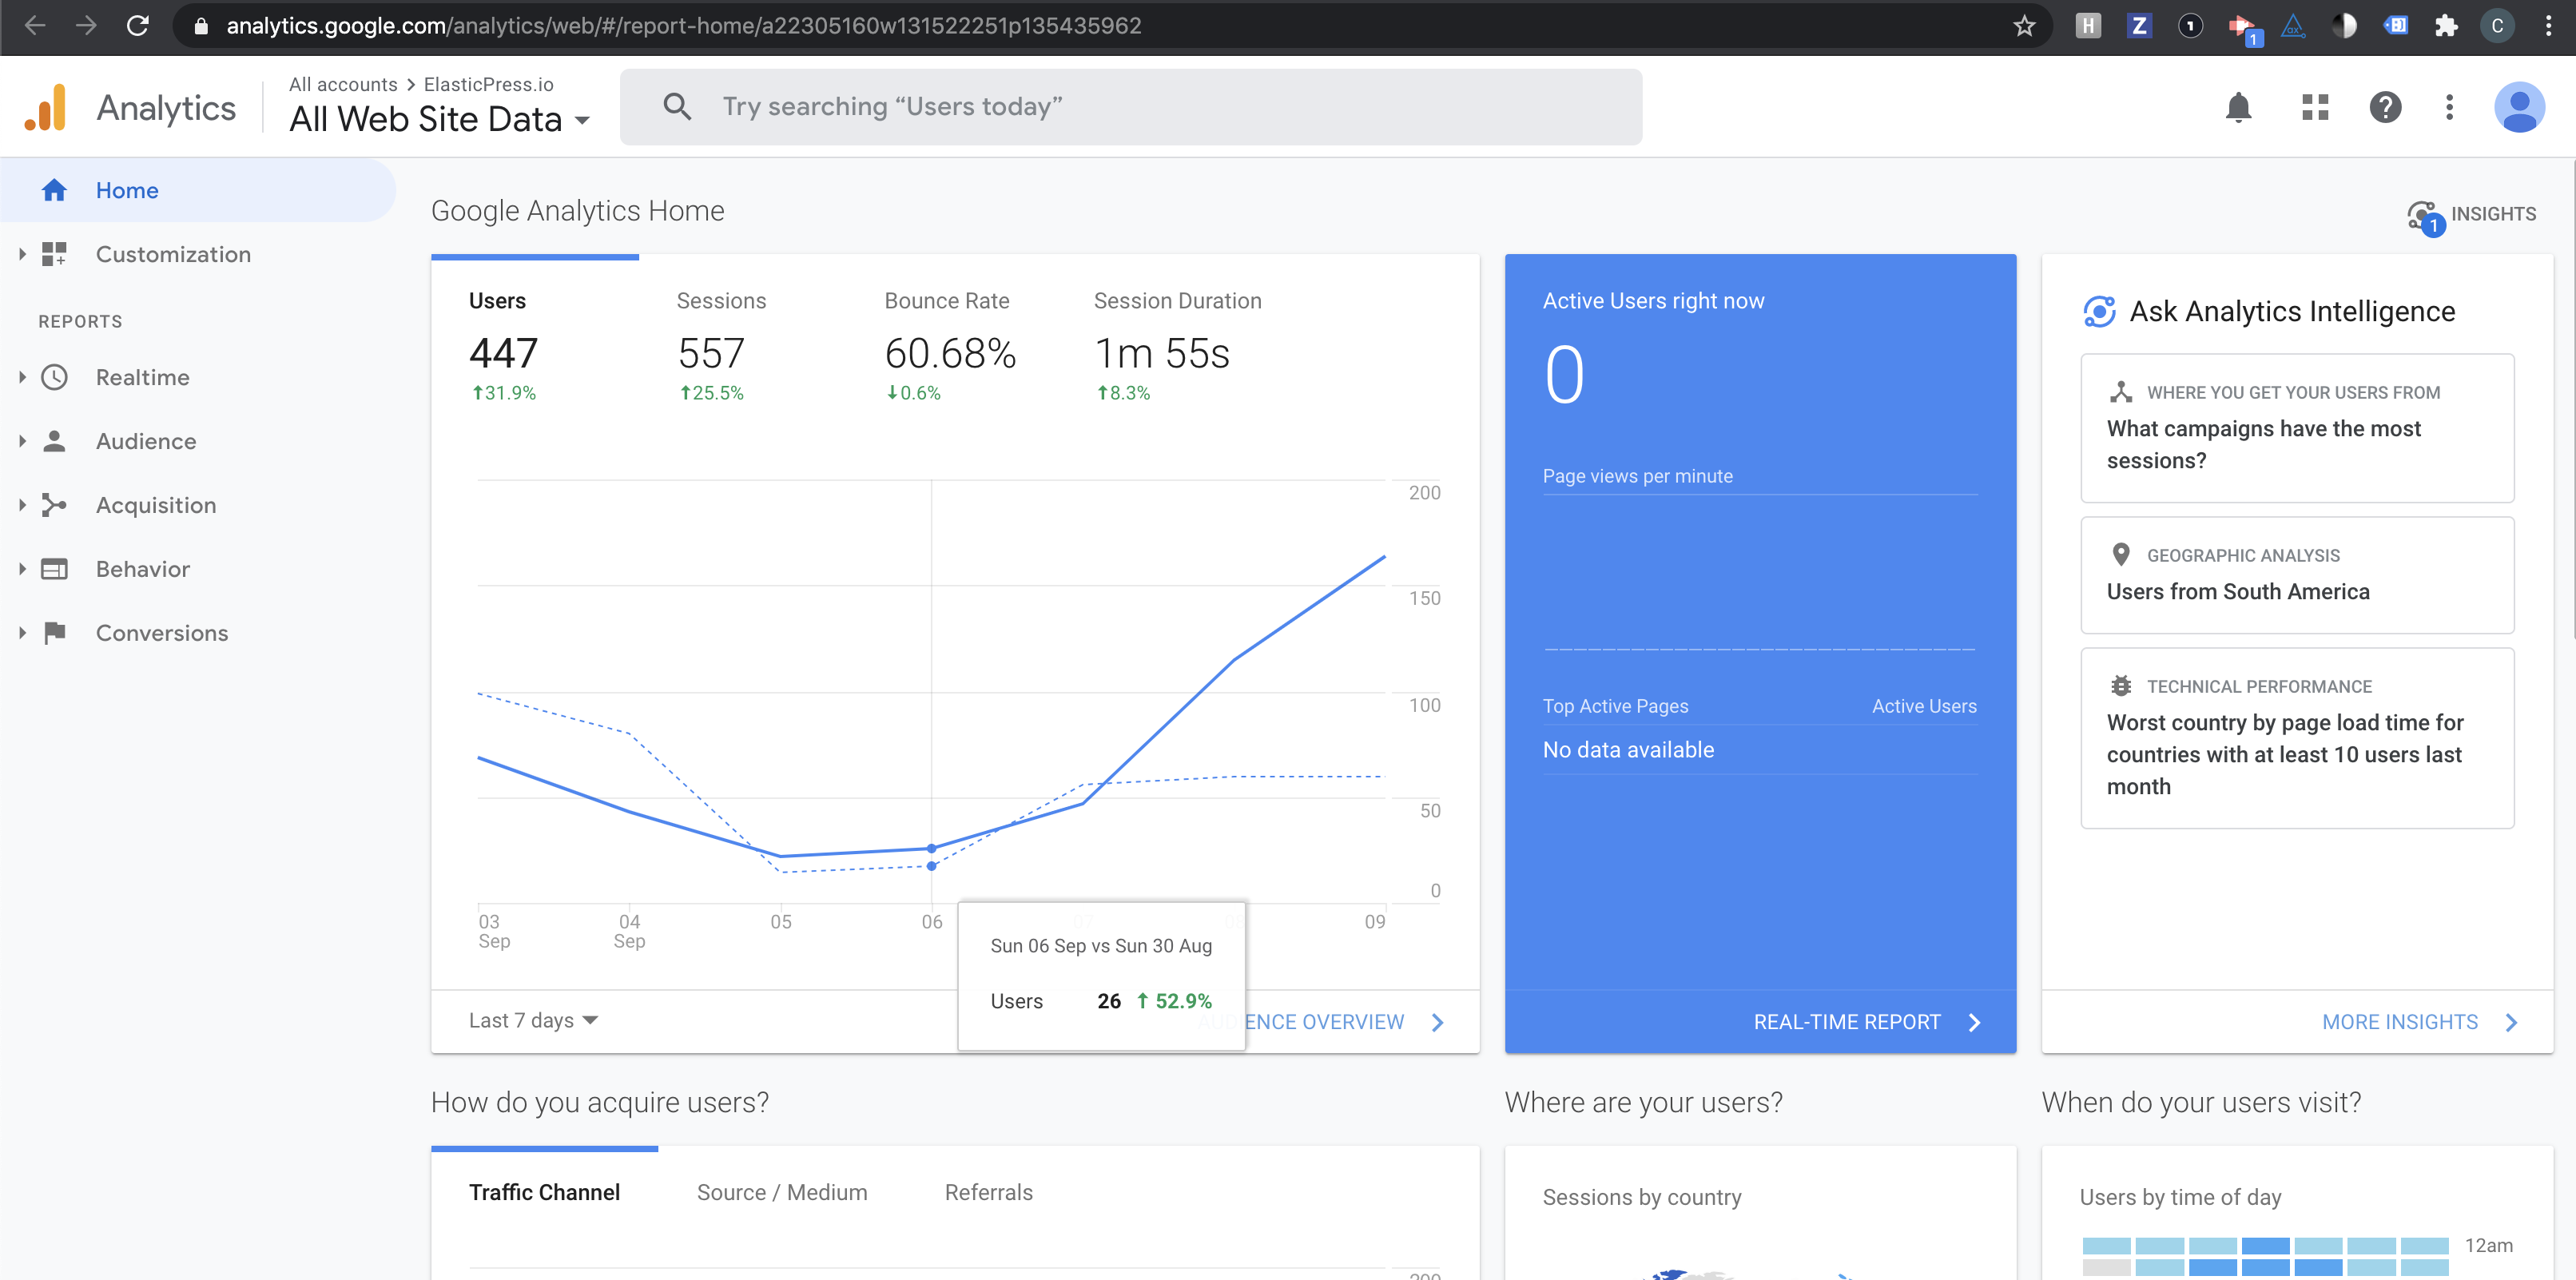
- In the Analytics page "Audience overview" graph, when hovering over a data point in the graph, the tooltip should cover _both_ graphs. I.e. regardless of which graph you're hovering over (the current or previous one), the tooltip should always apply to both data points on the y-axis, and they should both be highlighted, similarly to how it is in the Analytics frontend Home.
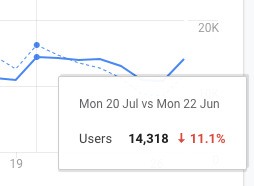
- The tooltip should include similar information like the one in the Analytics frontend home does:
- Line 1 (lighter font): _{currentDate} vs {previousCompareDate}_ (e.g. "Fri 17 Jul vs Fri 19 Jun")
- Line 2 (lighter font): _Users_
- Line 2 (bold): _{currentNumber}_
- Line 2 (bold, green or red): _{percentChangeWithArrowIndicator}_
- Example from Analytics frontend:
More information on customizing tooltips with the charts library
Implementation Brief
This one was pretty tough to write up, as the docs for Google Charts don't mention there are specific orders the chart values need to be supplied in for the tooltips to work as-expected (https://stackoverflow.com/questions/22601209/tooltips-for-multiple-lines-google-line-chart ended up helping! 😅). The existing charts code is a bit hard-to-follow, but I have a proof of concept PR available that can serve as inspiration/a starting point.
- Add a tooltip label as defined here: https://github.com/google/site-kit-wp/pull/1933/files#diff-a75b3a0da6c74c4dc70fbf476e42f23cR159-R170. The tooltip should be formatted with colour, better arrows, etc. See https://developers.google.com/chart/interactive/docs/customizing_tooltip_content#customizing-html-content for how to do that, but the basis of the data is available in the proof-of-concept PR.
- Change the
dataMapvalue inassets/js/modules/analytics/util/index.jsso it can show the tooltip defined above:
dataMap = [
    [
        { type: 'date' },
        { type: 'string', role: 'tooltip', p: { html: true } },
        { type: 'number', label: dataLabels[ selectedStats ] },
        { type: 'number', label: __( 'Previous period', 'google-site-kit' ) },
    ],
]
- Ensure https://github.com/google/site-kit-wp/pull/1933/files#diff-cb9d122b57f5a993d0c65ae873aaabe7R94-R95 is changed so multiple values are selected when hovered, like they are on the Analytics site.
- See #1933 for a proof-of-concept, including screenshots
QA Brief
- Navigate to the Analytics dashboard and the Analytics website; the content for "last 7 days" should be similar and appear the same.
- Analytics Dashboard on Site Kit should select both Y values for every date in the chart.
Changelog entry
- Fix Analytics reporting graph tooltip to match Analytics frontend UI and expose the same information.
 jamesozzie
All 11 comments
Just an update that I'm still working through this. I've been spending the day mostly release testing but trying to sort this out, as I don't want to leave vague instructions for the IB. That said, the charting code is old and pretty tough to follow, as it's spread over a _lot_ of files.
I'll try to get this IB sorted soon, but I just want to be precise so the implementer isn't spending hours searching through the right files.
 tofumatt
on 13 Aug 2020
tofumatt
on 13 Aug 2020
@tofumatt IB mostly looks good, and the POC does as well (of course the actual look still needs to be finalized to fully match Analytics). One question, do we really need date-fns? How are the current dates we show there provided, why do we need to introduce a new library?
 felixarntz
on 22 Aug 2020
felixarntz
on 22 Aug 2020
I think it's currently handled by Google Charts internally, though I'm honestly not sure: https://github.com/google/site-kit-wp/pull/1933/files#diff-a75b3a0da6c74c4dc70fbf476e42f23cL144. It looks like we pass a date object and when that's used as a label alone Google Charts formats it for us. But in the new case, we are formatting the string entirely ourselves and need to format it accordingly.
We can probably use Date.toLocaleDateString, but it's a less-friendly API is all (dates are hard, heh). I'll have a look and see if we can easily omit date-fns with Date.toLocaleDateString, but I suggested the library in-part because it's quite useful in general for date-handling, a task fraught with edge-cases and such 🙂
tofumatt
on 25 Aug 2020
Ah, looks like we have getLocale() so we should be able to ditch date-fns, I think.
tofumatt
on 25 Aug 2020
IB updated to not use date-fns! 👍
tofumatt
on 25 Aug 2020
IB ✅
felixarntz
on 27 Aug 2020
Tested
Setup latest SK release candidate, activated Analytics
Compared 7 day metrics:

Passed QA ✅
 cole10up
on 10 Sep 2020
cole10up
on 10 Sep 2020
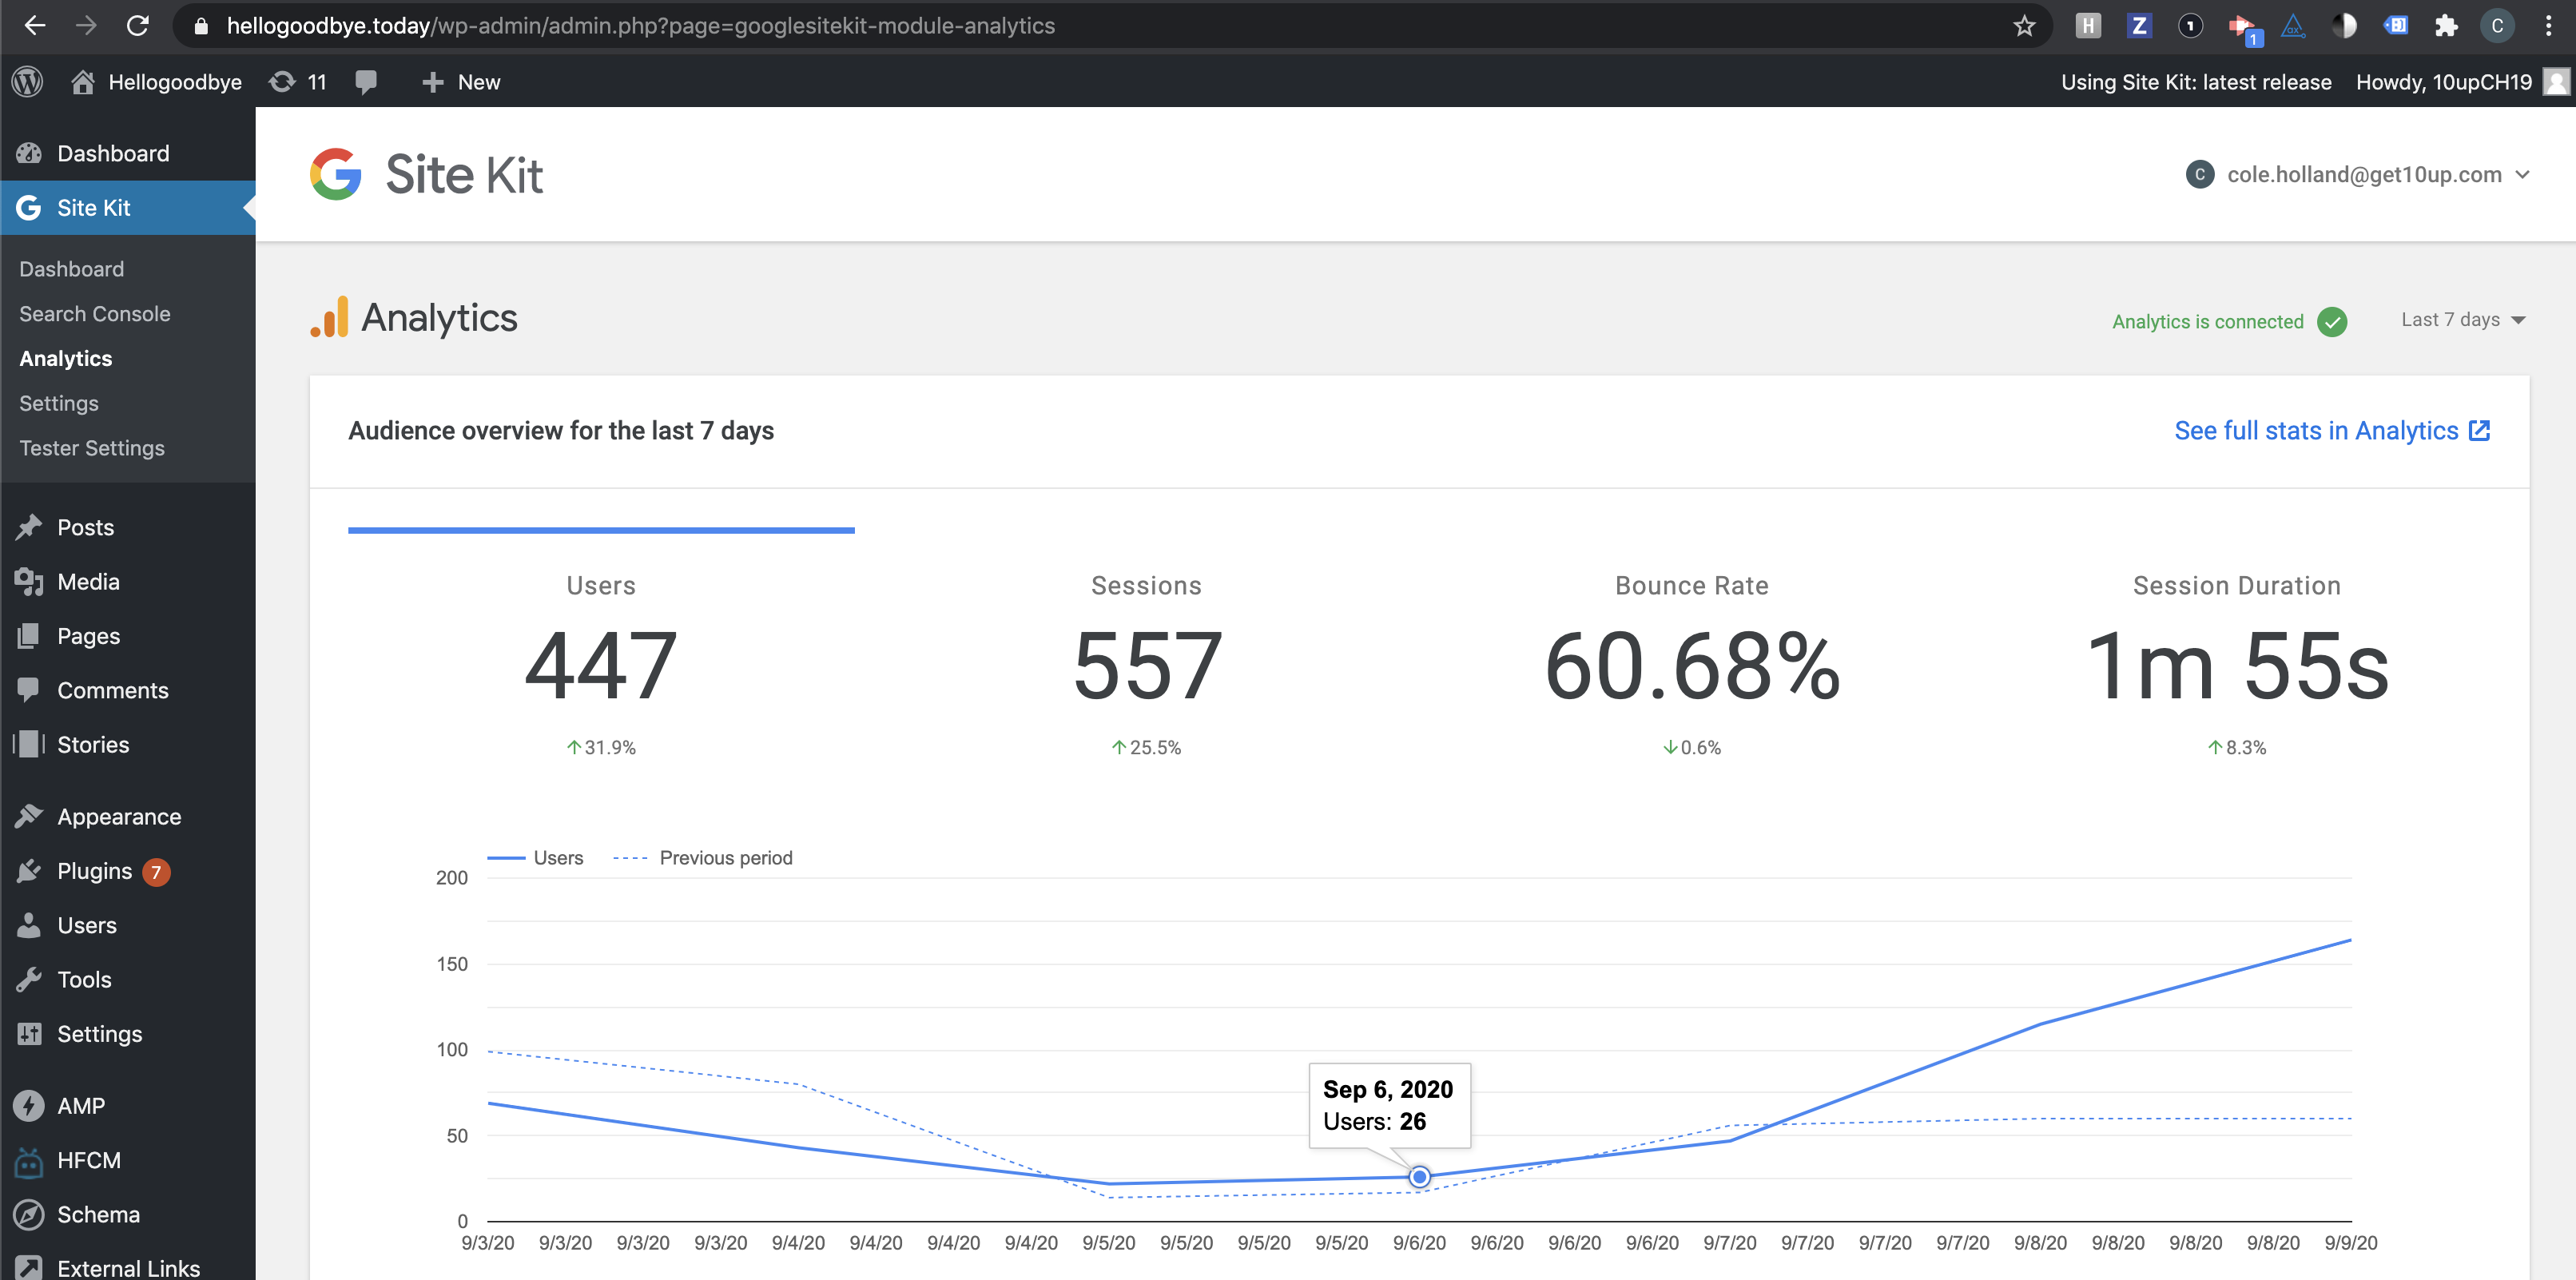
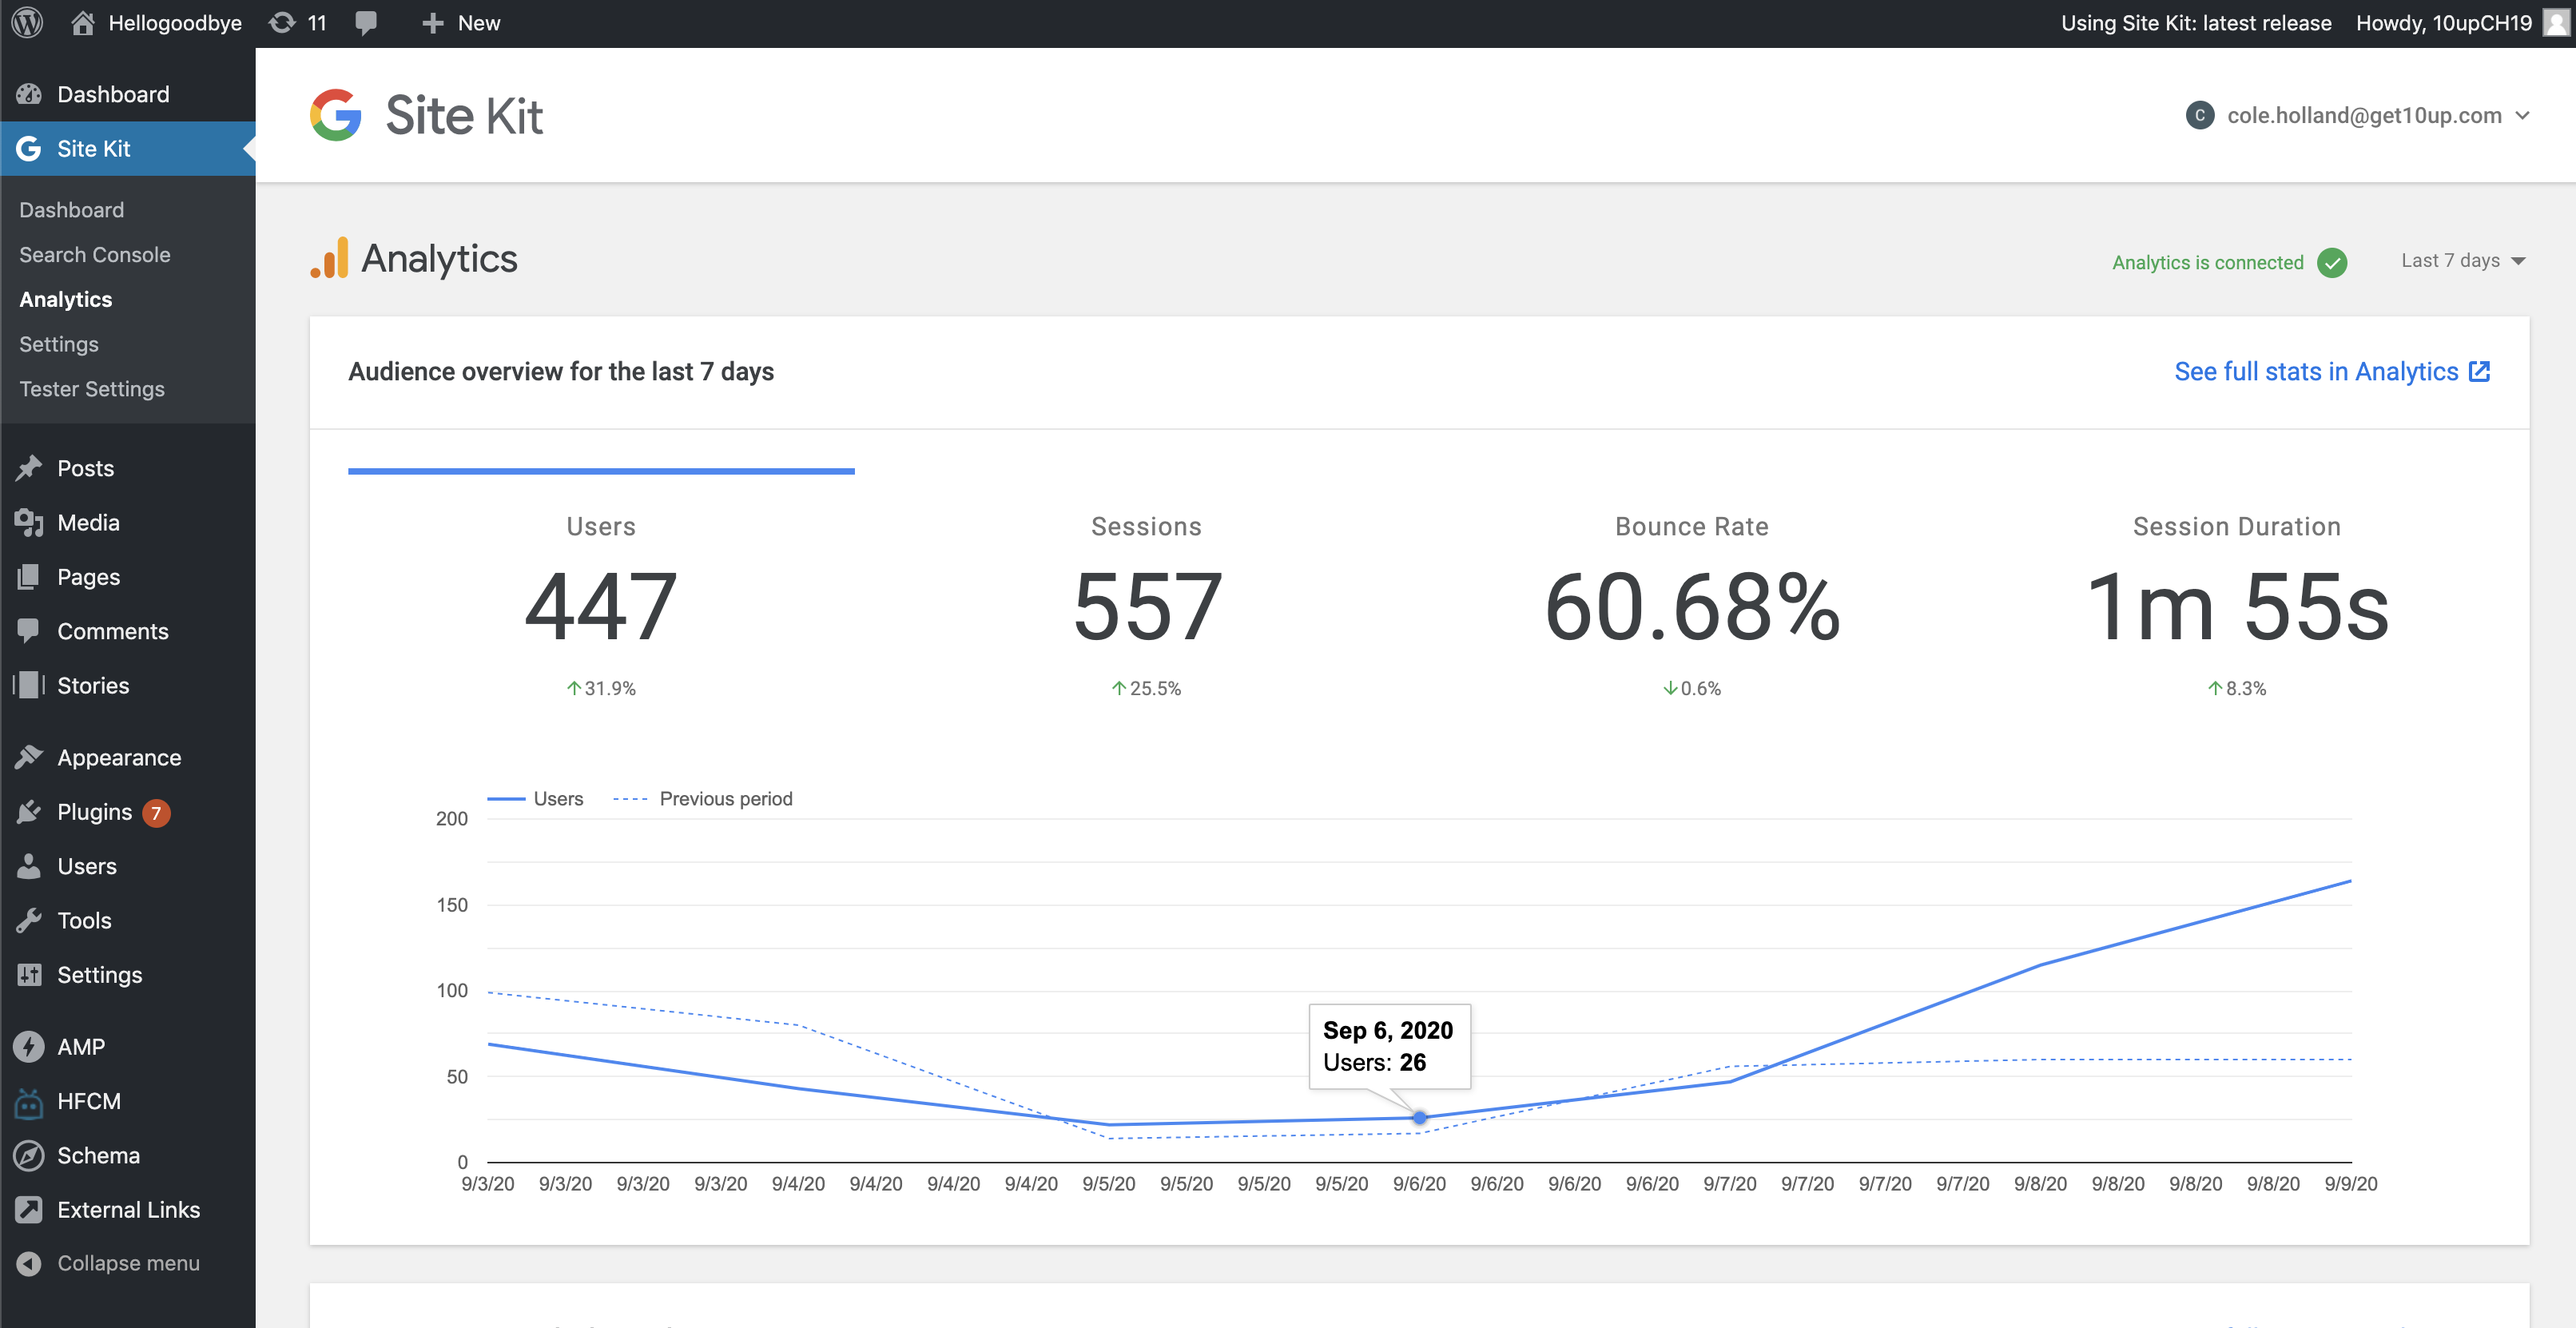
@cole10up One follow-up question, I'm wondering about your second screenshot above: The tooltip doesn't have the expected format, can you double-check on that? It should include a percentage and look like this:
I just took that screenshot from master, so it would be odd if it's not in the release ZIP 🤔
felixarntz
on 10 Sep 2020
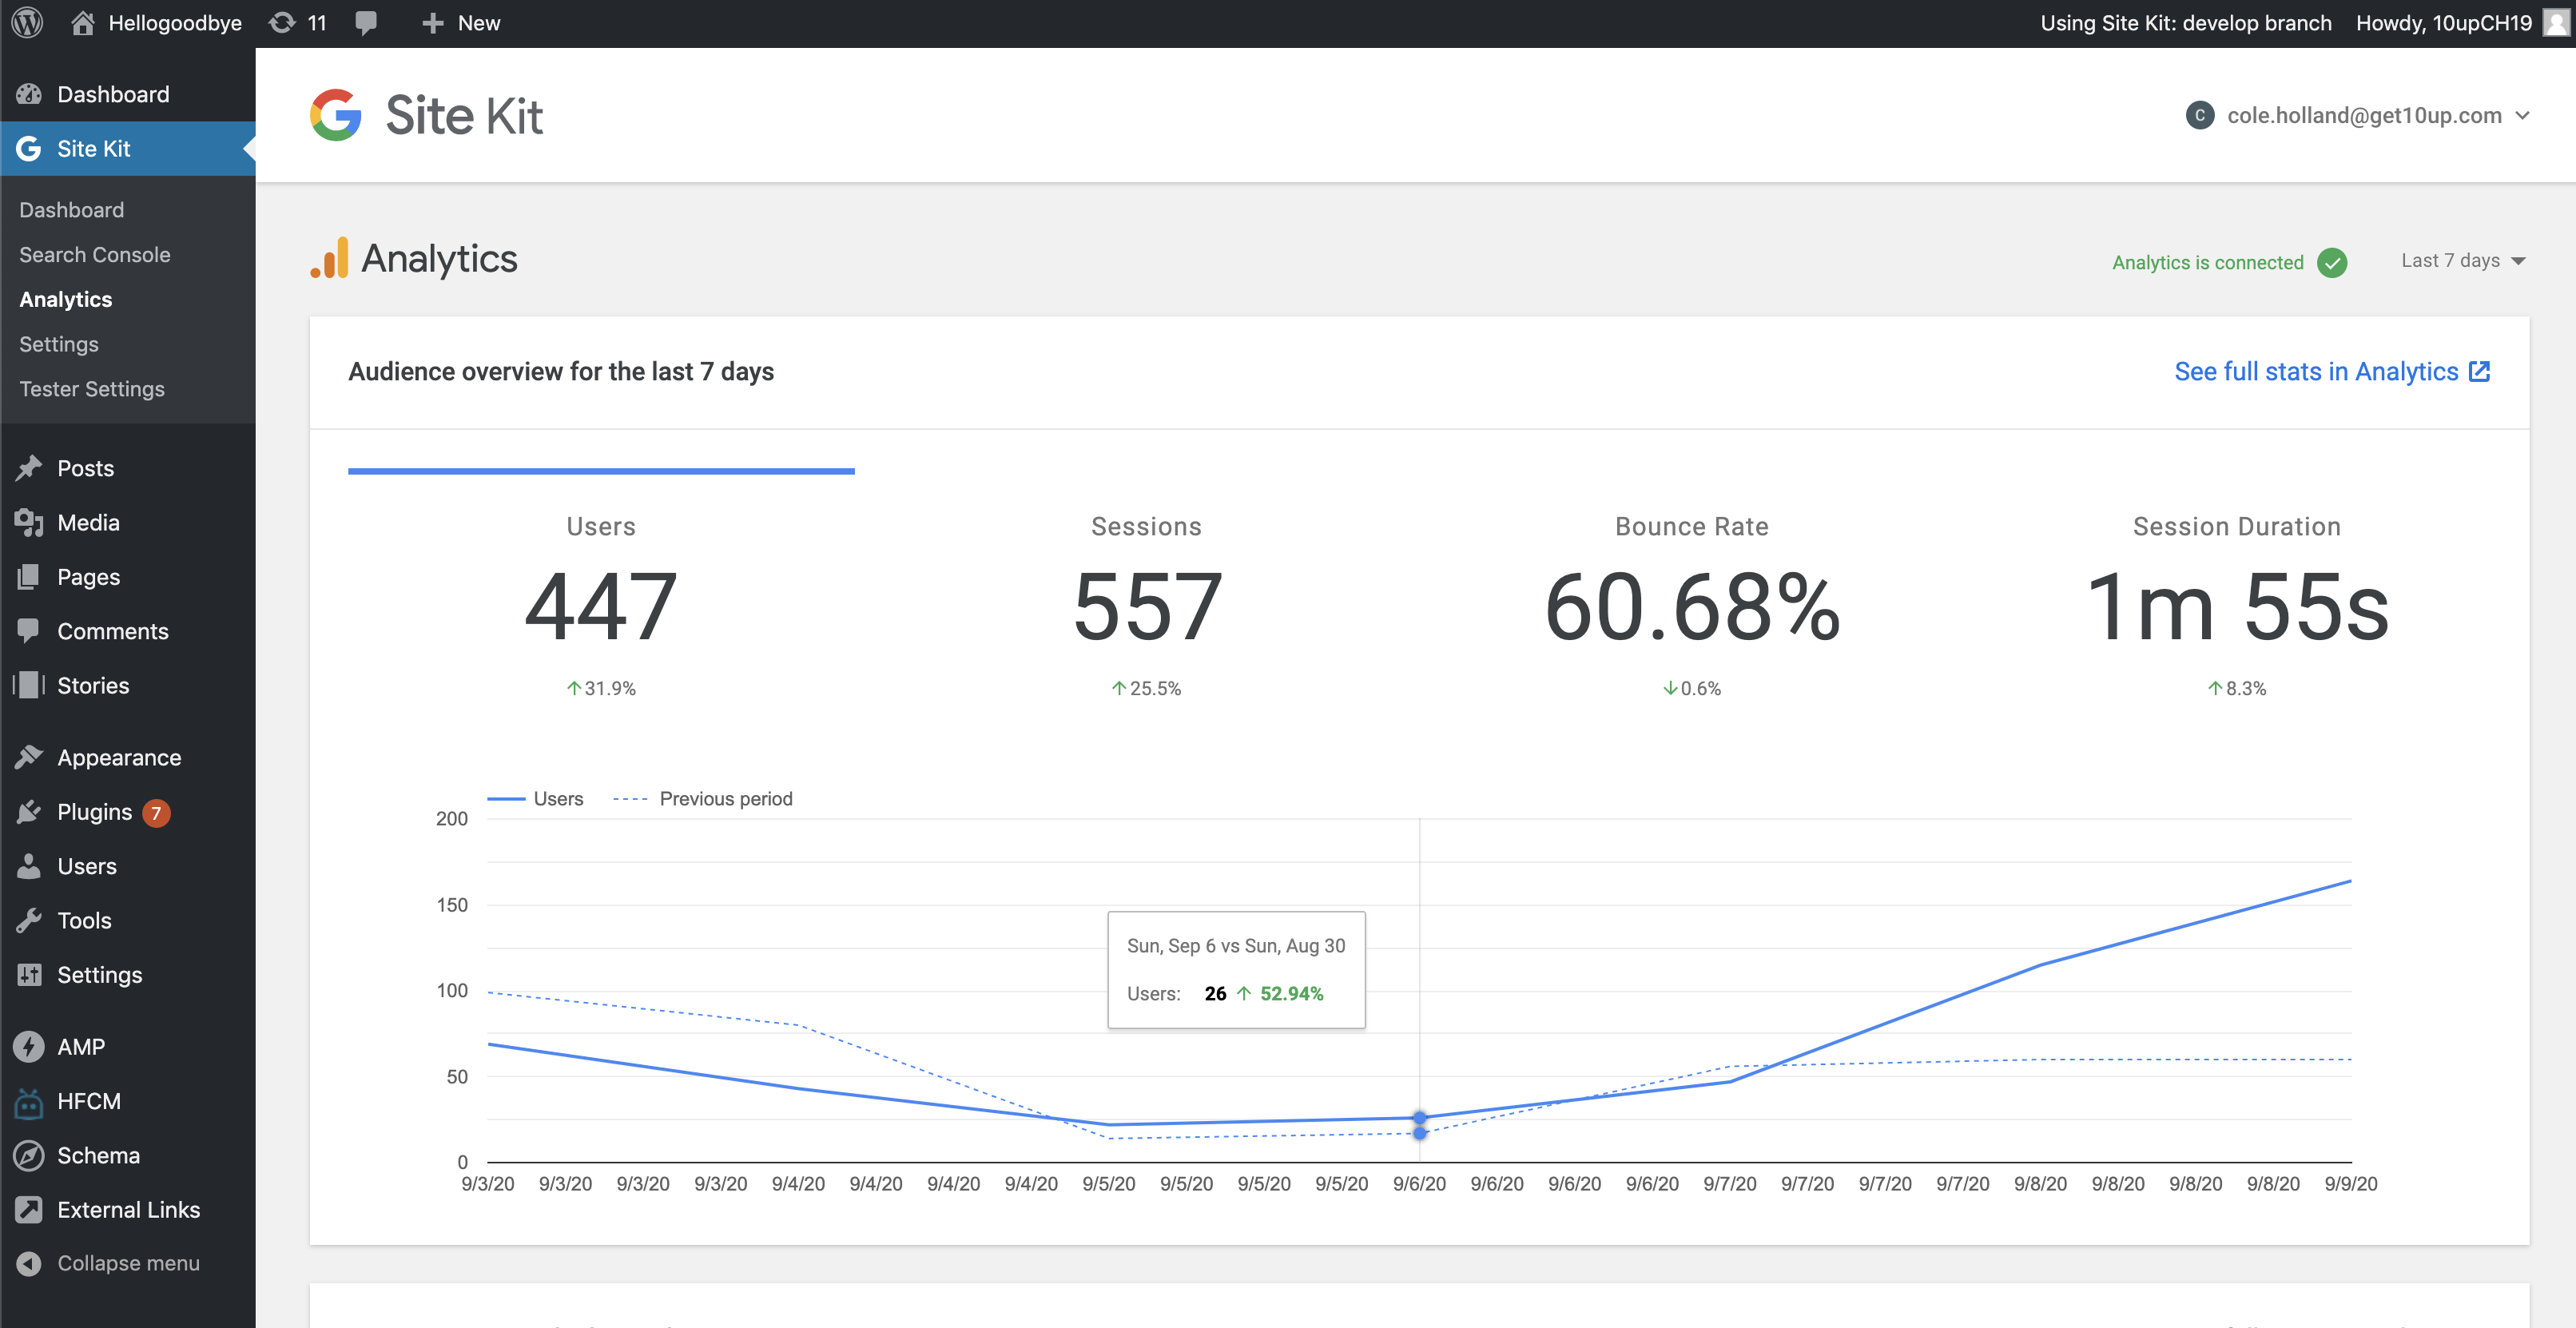
Comparing develop versus release:
Current release:
Develop:
@felixarntz - Should we send this back to CR to adjust?
cole10up
on 10 Sep 2020
@cole10up I was confused when you posted the above screenshot as part of QA. The "current" release (i.e. the one from 2 weeks ago) shouldn't need to be tested for QA unless explicitly mentioned in the brief (for comparison purposes). What you tested with develop is the expected behavior, and that should also be in the upcoming release (i.e. master).
Update: Oh I see in the brief it mentions to ensure "similar appearance". Still it would be good next time to post the comparison screenshots next to each other like you did in just your last comment - that clarifies where they're coming from.
felixarntz
on 10 Sep 2020
Sounds good, sorry about the confusion! Appreciate the 2nd set of eyes.
cole10up
on 10 Sep 2020
Related issues
 aaemnnosttv
·
4Comments
aaemnnosttv
·
4Comments
 jsmshay
·
3Comments
aaemnnosttv
·
3Comments
felixarntz
·
4Comments
felixarntz
·
5Comments
jsmshay
·
3Comments
aaemnnosttv
·
3Comments
felixarntz
·
4Comments
felixarntz
·
5Comments