Simulator: Simulator consuming so much CPU
Hi again!
Why is the simulator consuming so much CPU on all cores? If I cpulimit the sim, data gathering becomes so difficult. Is there a way to reduce its consumption and also not hinder data collection? Thank you.
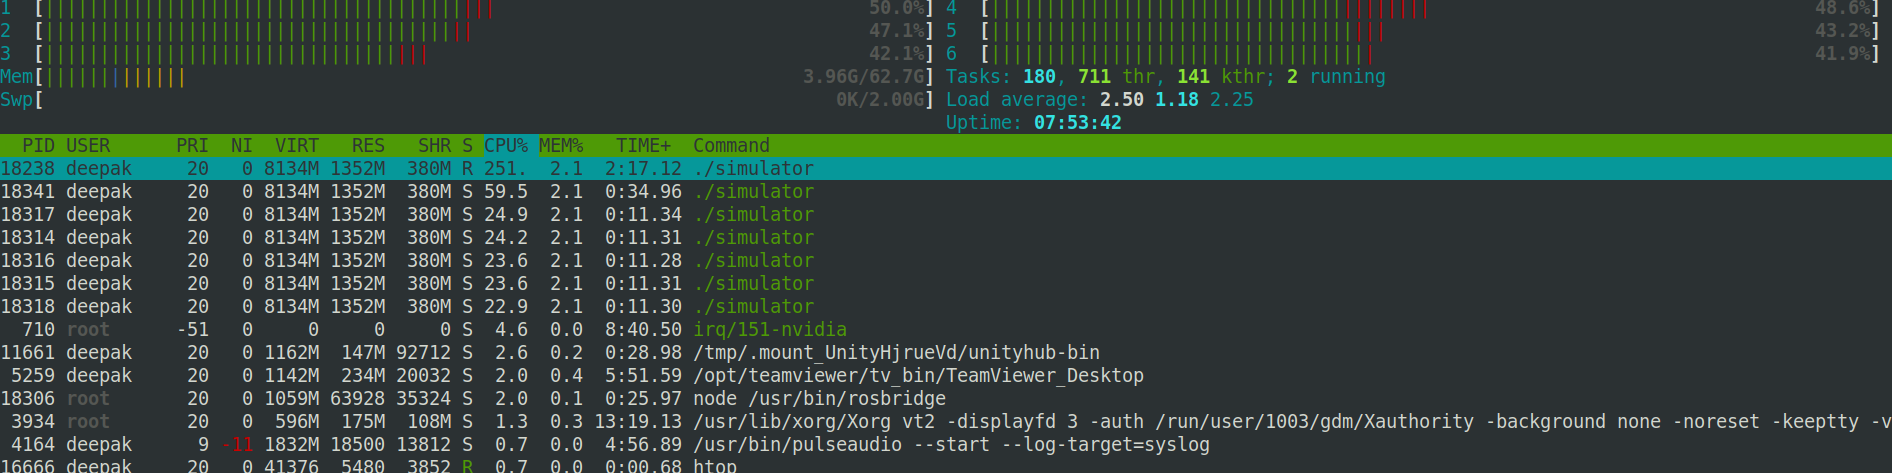
Screenshot of htop output after launching the sim but before pressing 'play'.
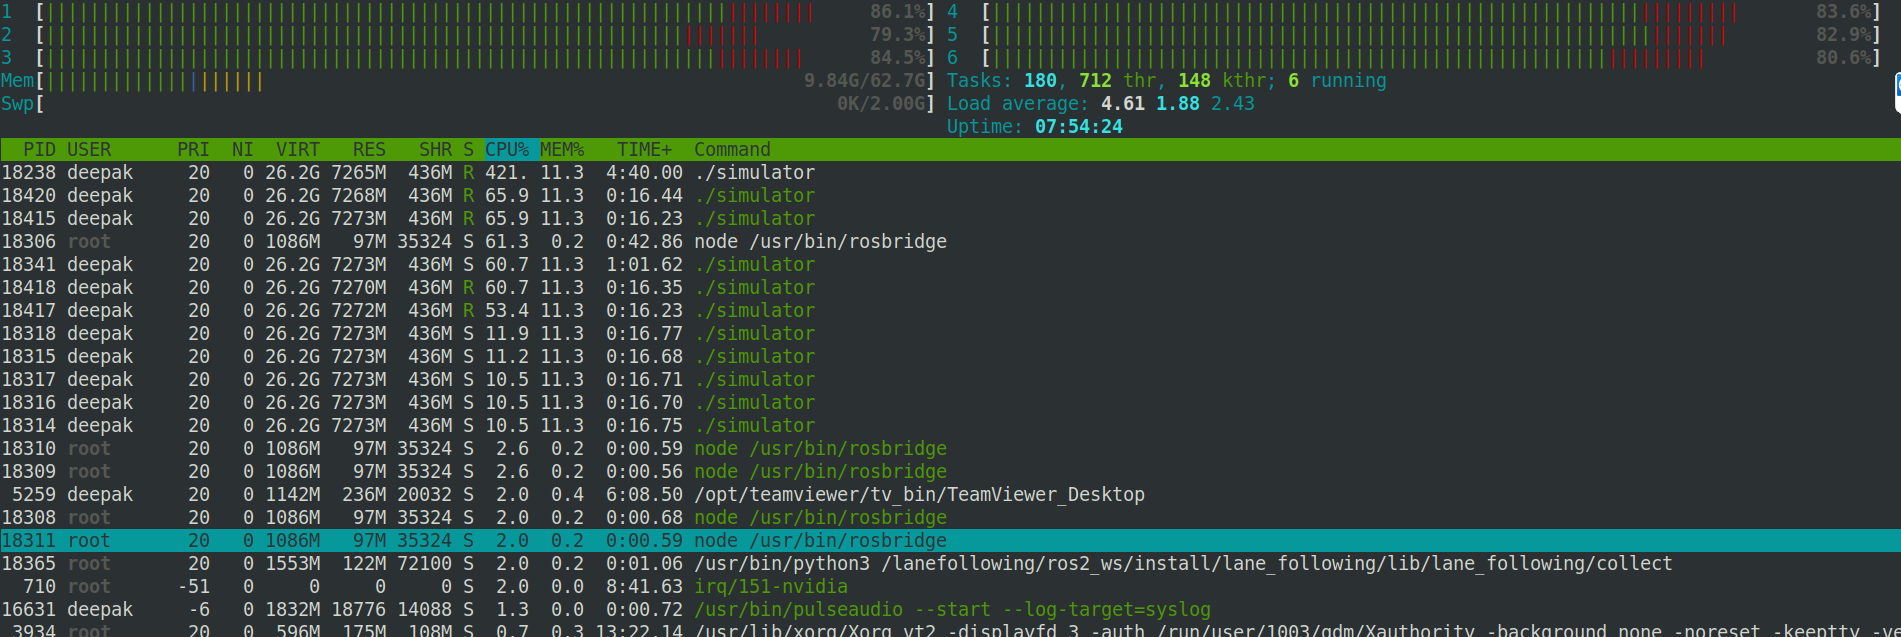
After pressing play. Using Lane Following tutorial. Running collect.py using docker-compose up collect command
The system pc stats are here --
$ inxi -Fxxxz
System: Host: localadmin-System-Product-Name Kernel: 5.3.0-51-generic x86_64 bits: 64 gcc: 7.5.0 Desktop: Gnome 3.28.4 (Gtk 2.24.32) info: gnome-shell dm: gdm3 Distro: Ubuntu 18.04.4 LTS
Machine:   Device: desktop Mobo: ASUSTeK model: ROG MAXIMUS X HERO v: Rev 1.xx serial: N/A
           UEFI: American Megatrends v: 1801 date: 11/05/2018
CPU:       6 core Intel Core i5-9600K (-MCP-) arch: Skylake rev.12 cache: 9216 KB
           flags: (lm nx sse sse2 sse3 sse4_1 sse4_2 ssse3 vmx) bmips: 44398
           clock speeds: min/max: 800/4600 MHz 1: 800 MHz 2: 800 MHz 3: 800 MHz 4: 800 MHz 5: 800 MHz 6: 800 MHz
Graphics:  Card-1: Intel Device 3e98 bus-ID: 00:02.0 chip-ID: 8086:3e98
           Card-2: NVIDIA GV102 bus-ID: 01:00.0 chip-ID: 10de:1e07
           Card-3: NVIDIA GV102 bus-ID: 02:00.0 chip-ID: 10de:1e07
           Display Server: x11 (X.Org 1.20.5 ) drivers: modesetting (unloaded: nvidia,fbdev,vesa,nouveau)
           Resolution: [email protected]
           OpenGL: renderer: GeForce RTX 2080 Ti/PCIe/SSE2 version: 4.6.0 NVIDIA 440.64.00 Direct Render: Yes
Audio:     Card-1 Intel 200 Series PCH HD Audio driver: snd_hda_intel bus-ID: 00:1f.3 chip-ID: 8086:a2f0
           Card-2 2x NVIDIA Device 10f7 driver: snd_hda_intelsnd_hda_intel bus-ID: 02:00.1 chip-ID: 10de:10f7
           Sound: Advanced Linux Sound Architecture v: k5.3.0-51-generic
Network:   Card: Intel Ethernet Connection (2) I219-V
           driver: e1000e v: 3.2.6-k bus-ID: 00:1f.6 chip-ID: 8086:15b8
           IF: enp0s31f6 state: up speed: 1000 Mbps duplex: full mac: <filter>
Drives:    HDD Total Size: 1000.2GB (45.2% used)
           ID-1: /dev/sda model: Samsung_SSD_860 size: 1000.2GB serial: <filter>
Partition: ID-1: / size: 916G used: 421G (49%) fs: ext4 dev: /dev/sda2
RAID:      System: supported: N/A
           No RAID devices: /proc/mdstat, md_mod kernel module present
           Unused Devices: none
Sensors:   System Temperatures: cpu: 47.0C mobo: N/A gpu: 1.0:53C
           Fan Speeds (in rpm): cpu: 0
Info:      Processes: 321 Uptime: 7:39 Memory: 2743.9/64179.3MB Init: systemd v: 237 runlevel: 5 Gcc sys: 7.5.0
           Client: Shell (bash 4.4.201 running in gnome-terminal-) inxi: 2.3.56
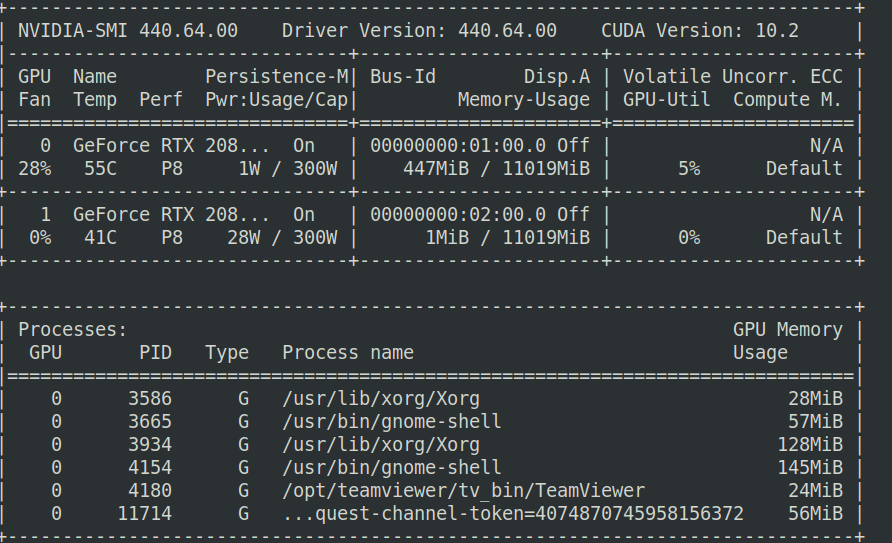
Output of nvidia-smi.
 dr563105
All 28 comments
@hadiTab Is this an issue with ROS?
 EricBoiseLGSVL
on 19 May 2020
EricBoiseLGSVL
on 19 May 2020
I'm not sure what this is. It's not a ROS issue, the bridge is barely using any CPU. Unity shouldn't really be using any before starting a simulation either.
@dr563105 what version of the simulator are you using?
I just did a test run on my PC with an i5 6600 on the latest simulator release and CPU usage was very low and only on a single core.
 hadiTab
on 19 May 2020
hadiTab
on 19 May 2020
@hadiTab I'm using the latest version 2020.03. I expanded https://github.com/lgsvl/LaneFollowingSensor to my needs and built it in Unity as mentioned in documentation. Using Unity Hub 2.3.1 and Unity editor 2019.3.3f1. This behaviour is happening also in already builtin Sim you provide in release page for the last 3 releases. Many of my colleagues too told me they experience the same behaviour.
Tried running the simulator from Unity

This is after I stopped the simulator, closed Unity. Just running the Collect script.


If you can't reproduce the issue, please let me know what steps to follow and then I can show those results.
dr563105
on 19 May 2020
@daviduhm can you look into this?
hadiTab
on 19 May 2020
I'd like to add -- I spoke with my colleagues, when I told them about this
I just did a test run on my PC with an i5 6600 on the latest simulator release and CPU usage was very low and only on a single core.
They were adamant that upon several trials they have never seen such low CPU consumption. They have been using LGSVL simulator since last year. So yeah, this behaviour is not restricted to just lanefollowing.
dr563105
on 19 May 2020
@dr563105 I can't reproduce this issue and CPU usage was pretty low on a single process. Can you please let me know what steps to follow, preferably without running lane following (to make it a simple case) if this behavior is not restricted to just lane following.
 daviduhm
on 20 May 2020
daviduhm
on 20 May 2020
@daviduhm Sure no problem. I just tried to use Python API and the behaviour is same.
Steps to reproduce:
Try 1
- Clone the PythonAPI and pip3 install the dependencies as given the docs. https://www.lgsvlsimulator.com/docs/python-api/
- Download the latest built linux simulator from the release page(using lgsvlsimulator-linux64-2020.03) -- https://github.com/lgsvl/simulator/releases. Extract it.
- Run the Simulator exe.

- Navigate to WebUI, select API mode in Simulations tab.

- Go back to terminal and execute but before 'Enter' key is pressed.
./quickstart/05-ego-drive-in-circle.py

- After 'Enter' Key is pressed.

- Stop the script with Ctrl+C. The Sim though still continues running.

Try 2
Steps 1 through 4 are the same. After choosing API mode in Web UI.

- Execute all unit tests as given here -- https://github.com/lgsvl/PythonAPI#running-unit-tests
python3 -m unittest discover -v -c

screenshot 2 after a while when the unit tests are running.

- Terminating the Unit tests with Ctrl+C.

A short video of the terminal while the unit test were running.
https://youtu.be/XAiN2wePHvk
I hope this may be enough to reproduce the issue. If not, please give me some steps that works really well for you. I will try it at my end.
dr563105
on 20 May 2020
@dr563105 Thanks for your detailed description. I've followed your steps exactly using lgsvlsimulator-linux64-2020.03 and 05-ego-drive-in-circle.py, but I still can't reproduce this issue on my linux machine. For me, the overall cpu usage across all cores is about ~30% while running simulation using the python api script (driving in circle).
I think your actual issue is that you have multiple processes running for simulator for some reason, which I believe it should always be just one process. Even at step 3 where you just run the simulator executable, there're 2 simulator processes on your htop. And, when you actually run the simulation through python api script, it looks like the number of processes for simulator even grows.
It could related to your system spec most probably and here we have some information about recommended/minimum system specs. Although your system spec seems fine to me, I would suggest to test on a different higher-end machine if you can and see if the issue goes away.
As for a side note regarding step 7, it's normal that the simulator continues running when you exit this python api script. You should press stop button from Web UI on your browser if you want to stop the current simulation and close the simulator window if you want to completely quit the process.
daviduhm
on 23 May 2020
Thanks David. It’s quite surprising for me that it’s only our group that are facing this issue.
We’ve tried using lgsvl across all machines. Every single one mimics this behaviour. Immediately after starting the simulator, cpu consumption spikes. Of course we mostly use Ubuntu in our systems.
I don’t know if there is a more powerful system to try than this one currently. I need to ask.
dr563105
on 23 May 2020
From your htop screenshot, I realized that those lines in green are actually threads, not processes. So in your case, it is normal behavior that your htop has one process, the one in white, alongside multiple threads running for simulator. My htop only shows a single process because I usually hide threads with H key in htop. Sorry about the confusion.
You might already know it but just wanted to clarify, the CPU usage on top/htop is the percentage of your CPU that is being used by the process as a single CPU. You can have percentages that are greater than 100% if you have multi-core CPU. For example, if you have 6-core CPU and 6 cores are at 30% use, it will show you 180% CPU use.
daviduhm
on 24 May 2020
I didn't know that about htop. Thanks for that, David. In any case, it is consuming far more resources than you; about 70-85% in each cores.
We didn't have much time to discuss about this over the last days. As far as I know, we have tried with different pc hardware configurations and Ubuntu, the result is the same. We may try on a windows 10 pc in the next days.
Would any log file reveal the problem more in detail? Would a Unity player log help in this case?
dr563105
on 26 May 2020
@dr563105 What map are you using for these tests?
EricBoiseLGSVL
on 26 May 2020
@EricBoiseLGSVL I used borregas avenue as in the quickstart examples. After your question, I tested with SF and GoMentum, same issue.
Just starting the sim exe, spikes the cpu on all cores. I can also confirm, this resource problems for all of us since the old Simulator version May 2019. Perhaps if some aspect has stayed constant through out these iterations, can give a clue as to the problem. From our side, it is Ubuntu 18.04 and sort of similar graphic cards and memory.
dr563105
on 26 May 2020
@dr563105 Odd, one more thing. Are you testing build or Editor?
EricBoiseLGSVL
on 26 May 2020
Today it was the lastest March build. A few days I even tested with editor. Those screenshots are also up in the previous replies.
dr563105
on 26 May 2020
Do you have any warnings or issues in Unity? I think we should look at PlayerLogs next. Can you post when you are able, thanks
EricBoiseLGSVL
on 26 May 2020
For tests, I used the latest pre-built version from the release page. But when I executed from Unity, with my modified build, I got no errors or warnings in the console tab. Ofcourse, when I did simulator->check, these errors were displayed.
Checking...
WARNING: Folder 'simulator_Data' should not be inside of '/'
ERROR: Folder 'HDRPDefaultResources' should not be inside of '/Assets'
ERROR: File 'ExampleFMU.fmu' with '.fmu' extension is not allowed inside '/Assets/Resources'
ERROR: File 'SimulatorShaderVariants.shadervariants' with '.shadervariants' extension is not allowed inside '/Assets/Shaders'
ERROR: File '/Assets/Scripts/Dynamics/FMU/FMU.cs' does not have correct copyright header
ERROR: File '/Assets/Scripts/Editor/FMUEditor/FMUImporter.cs' does not have correct copyright header
ERROR: File '/Assets/Scripts/Editor/PointCloud/PointCloudImportAxes.cs' does not have correct copyright header
WARNING: File '/Assets/Scripts/PointCloud/PointCloudManager.cs' starts with non-ASCII characters, check if you need to remove UTF-8 BOM
ERROR: File '/Assets/Scripts/Utilities/Manifest.cs' does not have correct copyright header
ERROR: File name 'Foliage Diffusion Profile.asset' contains spaces in '/Assets/HDRPDefaultResources'
ERROR: File name 'Foliage Diffusion Profile.asset.meta' contains spaces in '/Assets/HDRPDefaultResources'
ERROR: File name 'Scene PostProcess Profile.asset' contains spaces in '/Assets/HDRPDefaultResources'
ERROR: File name 'Scene PostProcess Profile.asset.meta' contains spaces in '/Assets/HDRPDefaultResources'
ERROR: File name 'Skin Diffusion Profile.asset' contains spaces in '/Assets/HDRPDefaultResources'
ERROR: File name 'Skin Diffusion Profile.asset.meta' contains spaces in '/Assets/HDRPDefaultResources'
ERROR: File name 'Sky and Fog Settings Profile.asset' contains spaces in '/Assets/HDRPDefaultResources'
ERROR: File name 'Sky and Fog Settings Profile.asset.meta' contains spaces in '/Assets/HDRPDefaultResources'
ERROR: File name 'unity default resources' contains spaces in '/simulator_Data/Resources'
Done!
If you want I can clone again, build and see if there are errors. What branch should I clone - master or release 2020.03?
dr563105
on 26 May 2020
No these are fine. This is mostly for internal testing with environment and vehicle development. Can you post the player log from a run of the build?
EricBoiseLGSVL
on 26 May 2020
Here you go. Used the packaged Simulator 2020.03 for Linux. Ran the quickstart example for drive in a circle in API mode.
dr563105
on 27 May 2020
@dr563105 Thanks for the log. I see that you are resizing the window, do you get the same issue if you leave full screen? I also see a GPU read failure. I think we have a fix for this in our next release. This could also be a cause.
EricBoiseLGSVL
on 27 May 2020
I reckon I was on full screen when I did the test. Any way this case, it was indeed in full screen mode. The problem exists. As you say there are a lot of GPU read errors. But, the resources increase immediately after Sim starting. May be the problem is also in those things that load upon clicking the Sim exe. Captured the log just till that.
Can you please also have a look at the system specs in the first post;especially graphics part? Can you tell me if the driver mode is right and properly installed?
Doing nvidia-smi while testing now, gave me this --

dr563105
on 27 May 2020
@dr563105 I'll ask some others about this but driver looks fine. I can't tell if it is installed correctly but if other team members are having the same issue, then it is more than likely not the problem. We will keep digging
EricBoiseLGSVL
on 28 May 2020
@dr563105 I was looking through our code and I realize we do not cap framerate during simulation. I wonder if you comment out RenderLimiter.RenderLimitDisabled(); in SimulatorManager.cs Awake(), this will prevent excess CPU cycles maybe.
EricBoiseLGSVL
on 4 Jun 2020
No luck @EricBoiseLGSVL. Still the same result. We discussed this and we feel somehow the CPU gets priority over GPU when Sim starts.
Do you know if I can run the Sim in a docker? Then we can confirm the problem is with NVIDIA driver and not the Sim.
Also it would be great to a system config of one of your working PCs to cross-check, install all the similar drivers afresh and see if it works. Can you please send me that?
dr563105
on 4 Jun 2020
@dr563105 Yes, you can run sim in docker, we are working on making it easier currently. Sure, I see if I can get one of our Linux users to send me a system config.
EricBoiseLGSVL
on 5 Jun 2020
Instructions for running in Docker are available in Docker folder.
 martins-mozeiko
on 5 Jun 2020
martins-mozeiko
on 5 Jun 2020
Thanks @martins-mozeiko . I tried it once, the problem still persists. We will continue to investigate further.
dr563105
on 7 Jun 2020
Closing this for now. We get varying results in linux and stable ones in Windows. We couldn't get conclusive results to point out the cause.
dr563105
on 6 Aug 2020
Related issues
 frontw
·
5Comments
frontw
·
5Comments
 mehmetdogru
·
7Comments
mehmetdogru
·
7Comments
 bage131
·
5Comments
bage131
·
5Comments
 yumianhuli2
·
6Comments
yumianhuli2
·
6Comments
 clepz
·
6Comments
clepz
·
6Comments