Scout: Help with coverage and understanding
Hi,
We are having some problems interpreting manually looked up variants in IVG. Hoping for some clarification / suggestions on how we should proceed.
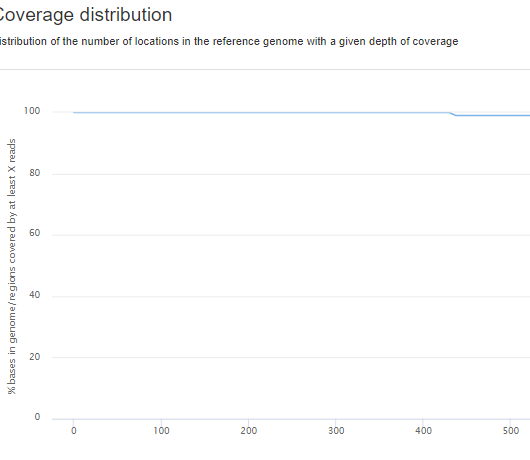
Here we have the coverage metrics in percentage over the whole panel, which is for this particular case: 429X 100%
If we go into a variant view and look at the GT call box we usually see a coverage of roughly ~1000-1500X, however if I go into IGV for that particular variant I see a coverage of ~2000-4000X. This is not variant or case specific.
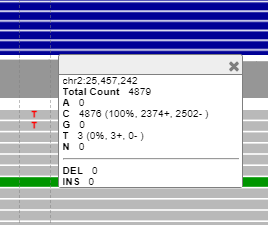
Our problem arises when we have follow up sample for the myeloid analysis, and for these patients we go manually into the genomics coordinates, like for this variant: Here we see 4879 reads and 3 reads for the alternatvie allele T.
The question here is first of all:
- Can we trust the 3 reads for T as IGV does not always represent the coverage metrics and the GT call (as described above)?
- How much reads from IGV is filtered out?
- How can me in a easy way monitor these manually genomic coordinates which we look up, due to the increpancies described above?
Thanks !!
Hälsningar Hero
 heronikdin
All 7 comments
Hi Hero, I think you should trust the numbers shown in the GT box (they come from the VCF file with the calls) and not counting from what you see in IGV (numbers computed dynamically from the cram alignment file every time you move to a new locus).
IGV desktop (and probably also the browser version we have integrated into Scout) allows even to substitute the computed coverage data with custom pre-computed data to have better coverage estimates, check the documentation here: http://software.broadinstitute.org/software/igv/alignmentdata#coverage
 northwestwitch
on 4 Jun 2021
northwestwitch
on 4 Jun 2021
Hi Hero! I believe we all had a long discussion on email and in person on a very similar theme back in April? Whats new? 😬
- You need to be very careful when counting bases in IGV, since it is prone to downsample. If the count for a high coverage sample (with downsampling disabled) is to be trusted is rather a question for the IGV developers, but let us say that we trust it until anyone proves differently, and if so we have that fixed?
- I think we covered that part well in the email conversation from April. At least all reads below Q<22.5 will not be used in VarDict. And then there is the Balsamic 1% noise filter.
- Let's see what we can do, but it depends on why you looking them up!
- Are you still using MPS for minimal residual disease testing? I thought we agreed targeted methods that offer a greater linear correlation to input at low fractions are better for this purpose; cf local digital droplet PCR projects by eg Cecilia Arthur? If you still want to do this, you probably need a more interactive approach where you submit positions to be tested - e.g. by indicating that all variants from a previous sample should be genotyped.
- Or is this for know hotspot positions where detection by screening has failed in some way before? If the latter, I would suggest also opening this on Balsamic and discussing the possibility to run it with a HotSpot-variant set, ensuring genotyping on all desired variants. That way you could have them represented in the variant call as well?
 dnil
on 4 Jun 2021
dnil
on 4 Jun 2021
😊 Did you also worry about the coverage vs % covered, since you show that picture? You would expect the average coverage at a locus to be considerably higher than the lowest depth at which the covered bases fraction is still 100%. Most bases will be covered more than the lowest covered one. In a PCR free wgs things are a little bit different, but in a panel I would expect wild differences.
dnil
on 4 Jun 2021
The variant in the picture she showed doesn't look to be in a downsampled area (no black bar under the coverage track) but I still wouldn't trust those 3 reads only because IGV shows that number. What you say about downsampling is true @dnil, never trust those IGV numbers, especially in the highly covered regions.
northwestwitch
on 4 Jun 2021
I know, but the last variant they asked about was. 😸
Do you have an example where the the count does not work, or is expected not to work, except when downsampling? The docs do give the option to override the track, but I believe that is mainly for if you want to show approximate coverage also on zoomed out views, where the built in count would be too slow.
dnil
on 4 Jun 2021
Hej!
I am so sorry for not answering, to be hones I completely forgot...
But you are right, we have had this conversation before and thank you both for the exaplanations. We are using this for MRD monitoring, but do mention in the report that the Myeloid panel is not optimal and has lower sensitivit. We have set up mrd monitoring with eg qpcr for certain variants, and we for some we can send then to uppsala for ddPCR.
Thank you again!
Hälsningar Hero
heronikdin
on 9 Jun 2021
No worries! 😃
northwestwitch
on 9 Jun 2021
Related issues
 ielvers
·
3Comments
ielvers
·
3Comments
 moonso
·
4Comments
northwestwitch
·
3Comments
moonso
·
4Comments
northwestwitch
·
3Comments
 4WGH
·
3Comments
heronikdin
·
4Comments
4WGH
·
3Comments
heronikdin
·
4Comments