I don't know what I'm missing here, but for some reason the gridlines don't seem to render with a XY Plot component. Not sure if I need to place the components in a certain order, or specify certain properties for the gridlines.
Here's a preview of what the graph looks like

and the ordering of my components.
class Graph extends Component {
  render() {
    return (
      <div className="graph">
        <XYPlot
          width={1100}
          height={300}>
          <HorizontalGridLines />
          <VerticalBarSeries
            data={impressions}
          />

          <VerticalGridLines />
          <XAxis tickTotal={10} tickSize={3} />

          <YAxis />
        </XYPlot>
      </div>
    );
  }
}
 rmammina
All 6 comments
Not sure if we can set a strokewidth property on this, right now there's no width.

rmammina
on 25 Apr 2017
I was able to get them to show by specifying the line thickness on the css class.
  .rv-xy-plot__grid-lines__line {
    stroke: gray;
    stroke-width: 1;
  }
Would be nice if these were set by default.
rmammina
on 25 Apr 2017
I know this issue is closed but to avoid other people wasting time (I've been trough the same problem!):
Do not forget to add the stylesheet to your app. There are instructions in the Readme.
 Lobosque
on 10 Sep 2017
Lobosque
on 10 Sep 2017
Thanks, @Lobosque. Where is this documented? I'm not seeing the instructions here, which is where I expected to find this kind of information.
 wpcarro
on 15 Mar 2018
wpcarro
on 15 Mar 2018
for anyone else coming here, like me, i found info on importing the styles here: https://github.com/uber/react-vis/blob/master/docs/getting-started/getting-started.md
i decided to import the styles into my component since it's only needed in one place:
import '../node_modules/react-vis/dist/style.css';
or just:
import 'react-vis/dist/style.css';
 vandosant
on 19 May 2018
vandosant
on 19 May 2018
It seems mine is loading the styles.css, also I can see in my dev tools the colors. However, this is how my demo graph is showing up.
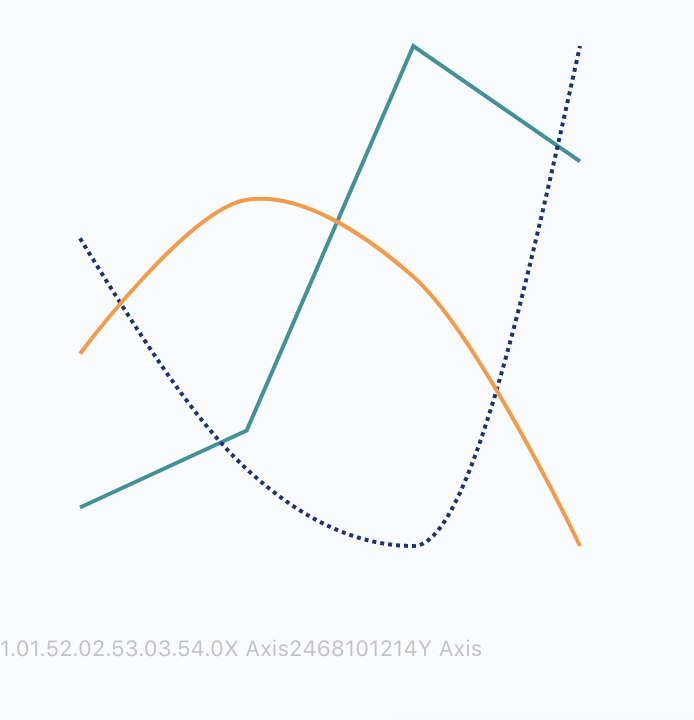
Did anyone have this problem before?
 squillace91
on 20 Jun 2018
squillace91
on 20 Jun 2018
Related issues
 codewithsk
·
5Comments
codewithsk
·
5Comments
 JayFields
·
5Comments
JayFields
·
5Comments
 samhogg
·
4Comments
samhogg
·
4Comments
 ZKruse
·
4Comments
ZKruse
·
4Comments
 cang-afero
·
4Comments
cang-afero
·
4Comments
Most helpful comment
I know this issue is closed but to avoid other people wasting time (I've been trough the same problem!):
Do not forget to add the stylesheet to your app. There are instructions in the Readme.