I am currently using the LineMarkSeries and having trouble applying Time into my x-axis scale. On my x-axis I want it to have a range between minTime and maxTime.
For example, on the x-axis it should have a range of : minTime = 5:50:00PM to maxTime = 5:55:00PM
My code as follow:
this.state = {
      minTime: format(new Date().toString(), "h:mm:ss"),
      maxTime: format(addMilliseconds(new Date().toString(), 100000),"h:mm:ss")
};

Let myData = [{x: "5:51:00" y: 0}, {x: "5:51:10" y: 30}, {x: "5:52:00" y: 10}]

<FlexibleXYPlot
  xType="time"
  yDomain={[-120, 100]}
  xDomain={[minTime, maxTime]}>
  <XAxis />
  <YAxis />
  <VerticalGridLines style={{ stroke: "transparent" }} />
  <HorizontalGridLines style={{ stroke: "transparent" }} />
  <LineMarkSeries data={myData} />
</FlexibleXYPlot>
Error I received on the console and what I noticed:
- Error:
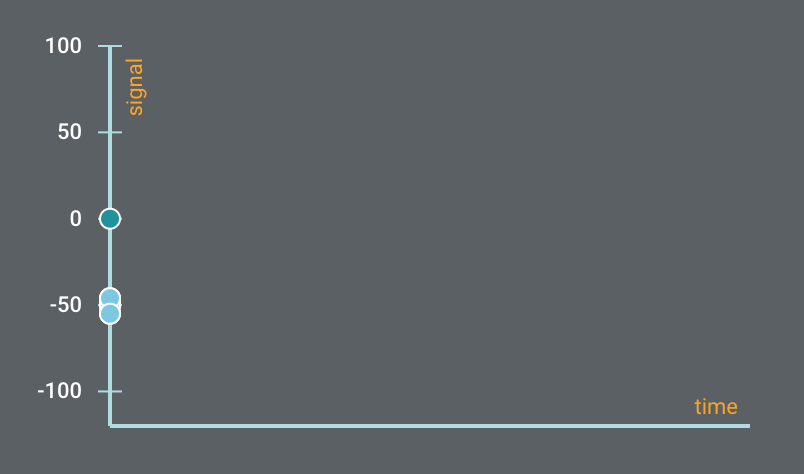
attribute d: Expected number, "MNaN,86.363636363…". - Label on the x-axis failed to contain minTime and maxTime, currently it is showing nothing.
- All of the data coming in are on stacking up on the 0 x-axis
- See image. please help?
 cang-afero
All 4 comments
If you iterate over your data and convert everything to a date object, it should work. To my knowledge, the d3 time scale functions are based on date objects, so you could just pick a random day, like Jan 1 2018 and make all your times on that day, and convert all of your x-axis points to times on Jan 1, 2018
 mathewleland
on 5 Nov 2018
mathewleland
on 5 Nov 2018
You could also flip everything to be epochs and then do the xAxis labeling yourself via tickFormat + moment (or which ever date formatter you like)
 mcnuttandrew
on 5 Nov 2018
mcnuttandrew
on 5 Nov 2018
We've seen this issue come up a handful of times, and while the work around above do get the job done, we should actually just address the issue. Invite a PR from anybody reading to add tests and enable our date handling to be less persnickety.
mcnuttandrew
on 5 Nov 2018
@mathewleland Thank you. Your recommendation helps!!
cang-afero
on 8 Nov 2018
Related issues
 yennycheung
·
4Comments
yennycheung
·
4Comments
 Falieson
·
3Comments
Falieson
·
3Comments
 ZKruse
·
4Comments
mcnuttandrew
·
3Comments
ZKruse
·
4Comments
mcnuttandrew
·
3Comments
 stroemdev
·
4Comments
stroemdev
·
4Comments
Most helpful comment
If you iterate over your data and convert everything to a date object, it should work. To my knowledge, the d3 time scale functions are based on date objects, so you could just pick a random day, like Jan 1 2018 and make all your times on that day, and convert all of your x-axis points to times on Jan 1, 2018