React-native-svg-charts: Is it possible to draw a LineChart with dots like this?
Hello I'm using the LineChart component to drawing a chart like in that picture with annotations and dots.
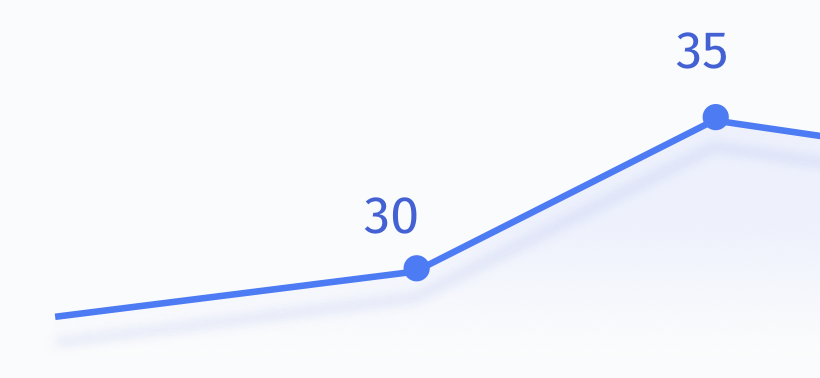
Basically what I've is this output:

<LineChart
style={{height: 80, width: '100%'}}
data={lineChartTemp}
svg={{stroke: Colors.brightBlue, strokeWidth: 2}}
 contentInset={{ top: 20, bottom: 20 }} />
Is there any way to extend this?
 mafiusu
All 3 comments
have you found solution for this issue?
 rizbud
on 10 Apr 2021
rizbud
on 10 Apr 2021
@rizbud Yes I have solved this. Here is the code for it:

App.js
import React from "react";
import { StyleSheet, View } from "react-native";
import LineChart from "./LineChart";

export default function App() {
  return (
    <View style={styles.container}>
      <LineChart
        data={[20, 25, 15, 30]}
        containerStyle={{ width: "100%", height: 150 }}
      />
    </View>
  );
}

const styles = StyleSheet.create({
  container: {
    flex: 1,
    justifyContent: "center",
    backgroundColor: "#fff",
  },
});
LineChart.js
import React from "react";
import { StyleSheet } from "react-native";
import {
  Circle,
  Path,
  Defs,
  LinearGradient,
  Stop,
  G,
  Text,
} from "react-native-svg";
import { AreaChart } from "react-native-svg-charts";

const Shadow = ({ line }) => (
  <Path
    key={"shadow"}
    y={5}
    d={line}
    fill={"none"}
    strokeWidth={2}
    stroke={"#E2E6FB"}
  />
);

const Decorator = ({ x, y, data }) => {
  return data.map((value, index) => {
    if (index === 0) return null;
    if (data.length - 1 === index)
      return (
        <G key={index}>
          <Text
            x={x(index) - 25}
            y={y(value) - 20}
            fontSize="26"
            fontWeight="bold"
            fill={"#4461D4"}
            textAnchor="middle"
          >
            {data[index]}
          </Text>
          <G fill="none" fillRule="evenodd">
            <Circle
              strokeOpacity={0.199}
              stroke="#4D7BF3"
              fillOpacity={0.079}
              fill="#4D7BF3"
              cx={x(index)}
              cy={y(value)}
              r={12.5}
            />
            <Circle fill="#4D7BF3" cx={x(index)} cy={y(value)} r={5} />
            <Circle fill="#FFF" cx={x(index)} cy={y(value)} r={2} />
          </G>
        </G>
      );
    return (
      <G key={index}>
        <Circle
          key={index}
          cx={x(index)}
          cy={y(value)}
          r={4}
          fill={"#4D7BF3"}
        />
        <Text
          x={x(index) - 10}
          y={y(value) - 10}
          fontSize="16"
          fill={"#4461D4"}
          textAnchor="middle"
        >
          {data[index]}
        </Text>
      </G>
    );
  });
};

const Line = ({ line }) => (
  <Path d={line} stroke={"#4D7BF3"} fill={"none"} strokeWidth={2} />
);

const Gradient = ({ index }) => (
  <Defs key={index}>
    <LinearGradient id={"gradient"} x1={"0%"} y={"0%"} x2={"100%"} y2={"0%"}>
      <Stop offset={"0%"} stopColor={"#FAFBFC"} />
      <Stop offset={"100%"} stopColor={"#EDF1FC"} />
    </LinearGradient>
  </Defs>
);

export default ({ containerStyle, data }) => (
  <AreaChart
    style={containerStyle}
    data={data}
    svg={{ fill: "url(#gradient)" }}
    contentInset={{ top: 50, bottom: 14, right: 16, left: 16 }}
  >
    <Shadow />
    <Line />
    <Gradient />
    <Decorator />
  </AreaChart>
);

const styles = StyleSheet.create({
  container: {
    width: "100%",
  },
});
Happy coding!
mafiusu
on 10 Apr 2021
❤1
🎉1
👍1
@rizbud Yes I have solved this. Here is the code for it:
App.js
import React from "react";
import { StyleSheet, View } from "react-native";
import LineChart from "./LineChart";

export default function App() {
  return (
    <View style={styles.container}>
      <LineChart
        data={[20, 25, 15, 30]}
        containerStyle={{ width: "100%", height: 150 }}
      />
    </View>
  );
}

const styles = StyleSheet.create({
  container: {
    flex: 1,
    justifyContent: "center",
    backgroundColor: "#fff",
  },
});
LineChart.js
import React from "react";
import { StyleSheet } from "react-native";
import {
  Circle,
  Path,
  Defs,
  LinearGradient,
  Stop,
  G,
  Text,
} from "react-native-svg";
import { AreaChart } from "react-native-svg-charts";

const Shadow = ({ line }) => (
  <Path
    key={"shadow"}
    y={5}
    d={line}
    fill={"none"}
    strokeWidth={2}
    stroke={"#E2E6FB"}
  />
);

const Decorator = ({ x, y, data }) => {
  return data.map((value, index) => {
    if (index === 0) return null;
    if (data.length - 1 === index)
      return (
        <G key={index}>
          <Text
            x={x(index) - 25}
            y={y(value) - 20}
            fontSize="26"
            fontWeight="bold"
            fill={"#4461D4"}
            textAnchor="middle"
          >
            {data[index]}
          </Text>
          <G fill="none" fillRule="evenodd">
            <Circle
              strokeOpacity={0.199}
              stroke="#4D7BF3"
              fillOpacity={0.079}
              fill="#4D7BF3"
              cx={x(index)}
              cy={y(value)}
              r={12.5}
            />
            <Circle fill="#4D7BF3" cx={x(index)} cy={y(value)} r={5} />
            <Circle fill="#FFF" cx={x(index)} cy={y(value)} r={2} />
          </G>
        </G>
      );
    return (
      <G key={index}>
        <Circle
          key={index}
          cx={x(index)}
          cy={y(value)}
          r={4}
          fill={"#4D7BF3"}
        />
        <Text
          x={x(index) - 10}
          y={y(value) - 10}
          fontSize="16"
          fill={"#4461D4"}
          textAnchor="middle"
        >
          {data[index]}
        </Text>
      </G>
    );
  });
};

const Line = ({ line }) => (
  <Path d={line} stroke={"#4D7BF3"} fill={"none"} strokeWidth={2} />
);

const Gradient = ({ index }) => (
  <Defs key={index}>
    <LinearGradient id={"gradient"} x1={"0%"} y={"0%"} x2={"100%"} y2={"0%"}>
      <Stop offset={"0%"} stopColor={"#FAFBFC"} />
      <Stop offset={"100%"} stopColor={"#EDF1FC"} />
    </LinearGradient>
  </Defs>
);

export default ({ containerStyle, data }) => (
  <AreaChart
    style={containerStyle}
    data={data}
    svg={{ fill: "url(#gradient)" }}
    contentInset={{ top: 50, bottom: 14, right: 16, left: 16 }}
  >
    <Shadow />
    <Line />
    <Gradient />
    <Decorator />
  </AreaChart>
);

const styles = StyleSheet.create({
  container: {
    width: "100%",
  },
});
Happy coding!
Thank you
rizbud
on 11 Apr 2021
Was this page helpful?
0 / 5 - 0 ratings
Related issues
 harikanammi
·
5Comments
harikanammi
·
5Comments
 themathiou
·
3Comments
themathiou
·
3Comments
 otusweb
·
6Comments
otusweb
·
6Comments
 MithunKakkara
·
3Comments
MithunKakkara
·
3Comments
 andrienpecson
·
5Comments
andrienpecson
·
5Comments
Most helpful comment
@rizbud Yes I have solved this. Here is the code for it:
App.js
LineChart.js
Happy coding!