React-native-svg-charts: Stacked Bar Chart: Different color for each bar.
How can I obtain to make every stacked bar chart different color from each other.
 andrienpecson
All 5 comments
This worked for me :
<StackedBarChart
style={style}
keys={ ['positive','negative']}
colors={['green','red']}
data={ data}
showGrid={ false }
horizontal={true}/>
 Unicity-Pimentel
on 25 Jun 2019
Unicity-Pimentel
on 25 Jun 2019
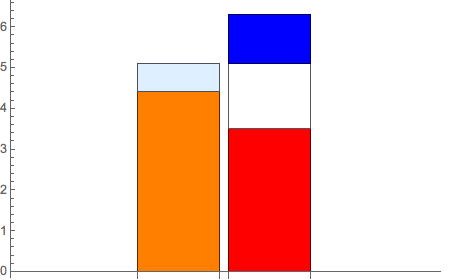
@Unicity-Pimentel currently that is what I am doing. But I need something like the image below.
andrienpecson
on 25 Jun 2019
yup same application. try setting the horizontal={false}
with the same code i created this one.
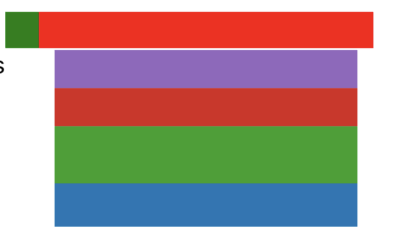
the upper part is when i set horizontal={false} and the other one is the one you needed
Unicity-Pimentel
on 26 Jun 2019
@Unicity-Pimentel how about for example, in the image I posted, the first bar's colors are blue and orange while for the second bar the colors are blue, white and red?
andrienpecson
on 26 Jun 2019
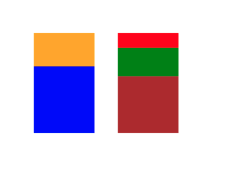
put your data in an array and map it in your stacked chart together with your color scheme.
like this one:
const data_sample = [{
  color : ['blue','orange'],
  data : [{
    positive: 3840,
    negative: 1920,
  }],
  keys : ['positive','negative'],
  label : 'test'
},
{
  color : ['brown','green','red'],
  data : [{
    positive: 3840,
    negative: 1920,
    neutral : 1000
  }],
  keys : ['positive','negative','neutral'],
  label : 'test2'
}]

<View style={[{flexDirection:'column',alignText : 'left', justifyContent : 'flex-start', borderWidth:0,flex:1}]}>
  <View style={[{flexDirection:'row',alignText : 'left', justifyContent : 'flex-start', borderWidth:0}]}>
  {data_sample.map(value => {
    return(<StackedBarChart
      style={{ height: 100, width:'20%' ,marginLeft: '5%'}}
      keys={ value.keys}
      colors={value.color}
      data={ value.data}
      showGrid={ false }
      horizontal={false}/>
      )
  })
  }
  </View>
</View>
this will produce this view :
Unicity-Pimentel
on 26 Jun 2019
Related issues
 zeroed-tech
·
4Comments
zeroed-tech
·
4Comments
 markedup
·
6Comments
markedup
·
6Comments
 rohithnair1996
·
3Comments
rohithnair1996
·
3Comments
 BBenGit
·
6Comments
BBenGit
·
6Comments
 escobar5
·
3Comments
escobar5
·
3Comments
Most helpful comment
put your data in an array and map it in your stacked chart together with your color scheme.
like this one:
this will produce this view :