React-native-svg-charts: How to change x-axis and y-axis values
What is the problem?
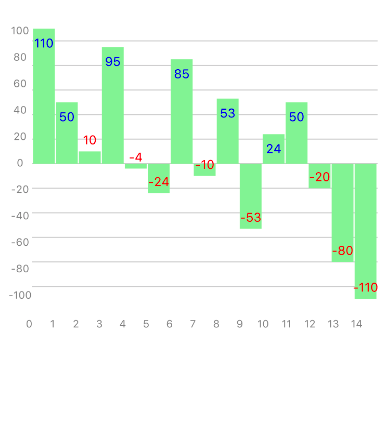
Hi, i am using this module it's working fine. But my question is how to change the x-axis values and y-axis values in Bar-Chart.
Initially takes x-axis values are 0,1,2,3,4------
Initially takes y-axis values are -80,-60,-40,-20,0,20,40-----
What platform?
- [x] iOS
- [x] Android
React Native version: 0.56.1
Code to reproduce
import React from 'react'
import { Grid, LineChart, XAxis, YAxis, BarChart } from 'react-native-svg-charts'
import { View, Text as RNText } from 'react-native'
import { Text } from 'react-native-svg'
class XYAxisBarChart extends React.PureComponent {
  render() {
    const data = [110, 50, 10, 95, -4, -24, 85, -10, 53, -53, 24, 50, -20, -80, -110]

    const axesSvg = { fontSize: 10, fill: 'grey' }
    const verticalContentInset = { top: 10, bottom: 10 }
    const xAxisHeight = 30
    const CUT_OFF = 20

    const Labels = ({ x, y, bandwidth, data }) =>
      data.map((value, index) => {

        return (
          <Text
            key={index}
            x={x(index) + bandwidth / 2}
            y={value < CUT_OFF ? y(value) - 10 : y(value) + 15}
            fontSize={12}
            fill={value >= CUT_OFF ? 'blue' : 'red'}
            alignmentBaseline={'middle'}
            textAnchor={'middle'}
          >
            {value}
          </Text>
        )
      })


    return (
      <View style={{ flex: 1, padding: 10 }}>
        <View style={{ height: 300, flexDirection: 'row' }}>
          <YAxis data={data} style={{ marginBottom: 0 }} contentInset={verticalContentInset} svg={axesSvg} />
          <View style={{ flex: 1 }}>
            <BarChart
              style={{ flex: 1 }}
              data={data}
              contentInset={{ top: 20, bottom: 20 }}
              svg={{
                fill: 'lightgreen'
              }}
            >
              <Grid />
              <Labels />
            </BarChart>
          </View>
        </View>
        <XAxis style={{ marginHorizontal: -10, height: 30 }} data={data} formatLabel={(value, index) => index} svg={axesSvg} contentInset={{ left: 30, right: 30 }} />
      </View>
    )
  }
}

export default XYAxisBarChart
Here is my screenshot:-
 harikanammi
All 5 comments
have you solve above one. if yes then please share us.
 reactdevrocks
on 17 Jun 2019
reactdevrocks
on 17 Jun 2019
Not solved!!!!
harikanammi
on 17 Jun 2019
If you want a different output in your axis, you would give a different function for the formalLabel property.
What do you want to change them to?
 purplegamba
on 18 Nov 2019
purplegamba
on 18 Nov 2019
To Change X and Y axis value use object to store the data:
import React from 'react';
import {SafeAreaView, StyleSheet, ScrollView, View} from 'react-native';
import {BarChart, Grid, XAxis, YAxis} from 'react-native-svg-charts';
import * as scale from 'd3-scale';
import {Text} from 'react-native-svg';
class App extends React.Component {
render() {
const data = [
{
value: 50,
labelX: 'A',
labelY: 'One',
},
{
value: 10,
labelX: 'B',
labelY: 'Two',
},
{
value: 40,
labelX: 'C',
labelY: 'Three',
},
{
value: 95,
labelX: 'D',
labelY: 'Four',
},
{
value: 85,
labelX: 'E',
labelY: 'Five',
},
];
const CUT_OFF = 20;
const Labels = ({x, y, bandwidth, data}) =>
  data.map((item, index) => (
    <Text
      key={index}
      x={x(index) + bandwidth / 2}
      y={item.value < CUT_OFF ? y(item.value) - 10 : y(item.value) + 15}
      fontSize={14}
      fill={item.value >= CUT_OFF ? 'white' : 'black'}
      alignmentBaseline={'middle'}
      textAnchor={'middle'}>
      {item.value}
    </Text>
  ));

return (
  <>
    <SafeAreaView>
      <ScrollView
        contentInsetAdjustmentBehavior="automatic"
        style={styles.scrollView}>
        <View style={{flexDirection: 'row', height: 200}}>
          <View style={{width: 50, flexDirection: 'column'}}>
            <YAxis
              data={data}
              scale={scale.scaleBand}
              svg={{
                fill: 'grey',
                fontSize: 20,
              }}
              style={{flex: 1}}
              min={0}
              yAccessor={({index}) => index}
              formatLabel={(_, index) => data[index].labelY}
            />
            <View style={{flex: 0.1}} />
          </View>

          <View style={{flex: 1, flexDirection: 'column'}}>
            <BarChart
              style={{flex: 1}}
              data={data}
              gridMin={0}
              yAccessor={({item}) => item.value}
              svg={{fill: 'rgb(134, 65, 244)'}}>
              <Labels />
              <Grid direction={Grid.Direction.HORIZONTAL} />
            </BarChart>
            <XAxis
              data={data}
              scale={scale.scaleBand}
              svg={{
                fill: 'grey',
                fontSize: 20,
              }}
              min={0}
              style={{flex: 0.1}}
              yAccessor={({index}) => index}
              formatLabel={(_, index) => data[index].labelX}
            />
          </View>
        </View>
      </ScrollView>
    </SafeAreaView>
  </>
);
}
}
const styles = StyleSheet.create({
scrollView: {
backgroundColor: '#f9f9f9',
padding: 10,
},
});
export default App;

 guruuliya
on 10 Oct 2020
guruuliya
on 10 Oct 2020
To Change X and Y axis value use object to store the data:
import React from 'react';
import {SafeAreaView, StyleSheet, ScrollView, View} from 'react-native';
import {BarChart, Grid, XAxis, YAxis} from 'react-native-svg-charts';
import * as scale from 'd3-scale';
import {Text} from 'react-native-svg';
class App extends React.Component {
render() {
const data = [
{
value: 50,
labelX: 'A',
labelY: 'One',
},
{
value: 10,
labelX: 'B',
labelY: 'Two',
},
{
value: 40,
labelX: 'C',
labelY: 'Three',
},
{
value: 95,
labelX: 'D',
labelY: 'Four',
},
{
value: 85,
labelX: 'E',
labelY: 'Five',
},
];const CUT_OFF = 20; const Labels = ({x, y, bandwidth, data}) => data.map((item, index) => ( <Text key={index} x={x(index) + bandwidth / 2} y={item.value < CUT_OFF ? y(item.value) - 10 : y(item.value) + 15} fontSize={14} fill={item.value >= CUT_OFF ? 'white' : 'black'} alignmentBaseline={'middle'} textAnchor={'middle'}> {item.value} </Text> )); return ( <> <SafeAreaView> <ScrollView contentInsetAdjustmentBehavior="automatic" style={styles.scrollView}> <View style={{flexDirection: 'row', height: 200}}> <View style={{width: 50, flexDirection: 'column'}}> <YAxis data={data} scale={scale.scaleBand} svg={{ fill: 'grey', fontSize: 20, }} style={{flex: 1}} min={0} yAccessor={({index}) => index} formatLabel={(_, index) => data[index].labelY} /> <View style={{flex: 0.1}} /> </View> <View style={{flex: 1, flexDirection: 'column'}}> <BarChart style={{flex: 1}} data={data} gridMin={0} yAccessor={({item}) => item.value} svg={{fill: 'rgb(134, 65, 244)'}}> <Labels /> <Grid direction={Grid.Direction.HORIZONTAL} /> </BarChart> <XAxis data={data} scale={scale.scaleBand} svg={{ fill: 'grey', fontSize: 20, }} min={0} style={{flex: 0.1}} yAccessor={({index}) => index} formatLabel={(_, index) => data[index].labelX} /> </View> </View> </ScrollView> </SafeAreaView> </> );}
}const styles = StyleSheet.create({
scrollView: {
backgroundColor: '#f9f9f9',
padding: 10,
},
});export default App;
TEXT IS CREATING ISSUE WITH NORMAL TEXT FROM REACT-NATIVE
 visheshsprinzo
on 19 Jun 2021
visheshsprinzo
on 19 Jun 2021
Related issues
 andrienpecson
·
5Comments
andrienpecson
·
5Comments
 MithunKakkara
·
3Comments
MithunKakkara
·
3Comments
 antoinerousseau
·
4Comments
antoinerousseau
·
4Comments
 rohithnair1996
·
3Comments
rohithnair1996
·
3Comments
 BBenGit
·
6Comments
BBenGit
·
6Comments
Most helpful comment
To Change X and Y axis value use object to store the data:
import React from 'react';
import {SafeAreaView, StyleSheet, ScrollView, View} from 'react-native';
import {BarChart, Grid, XAxis, YAxis} from 'react-native-svg-charts';
import * as scale from 'd3-scale';
import {Text} from 'react-native-svg';
class App extends React.Component {
render() {
const data = [
{
value: 50,
labelX: 'A',
labelY: 'One',
},
{
value: 10,
labelX: 'B',
labelY: 'Two',
},
{
value: 40,
labelX: 'C',
labelY: 'Three',
},
{
value: 95,
labelX: 'D',
labelY: 'Four',
},
{
value: 85,
labelX: 'E',
labelY: 'Five',
},
];
}
}
const styles = StyleSheet.create({
scrollView: {
backgroundColor: '#f9f9f9',
padding: 10,
},
});
export default App;