Prometheus: TSDB Compaction issue - 2.2.1
As discussed on the Prometheus users group:
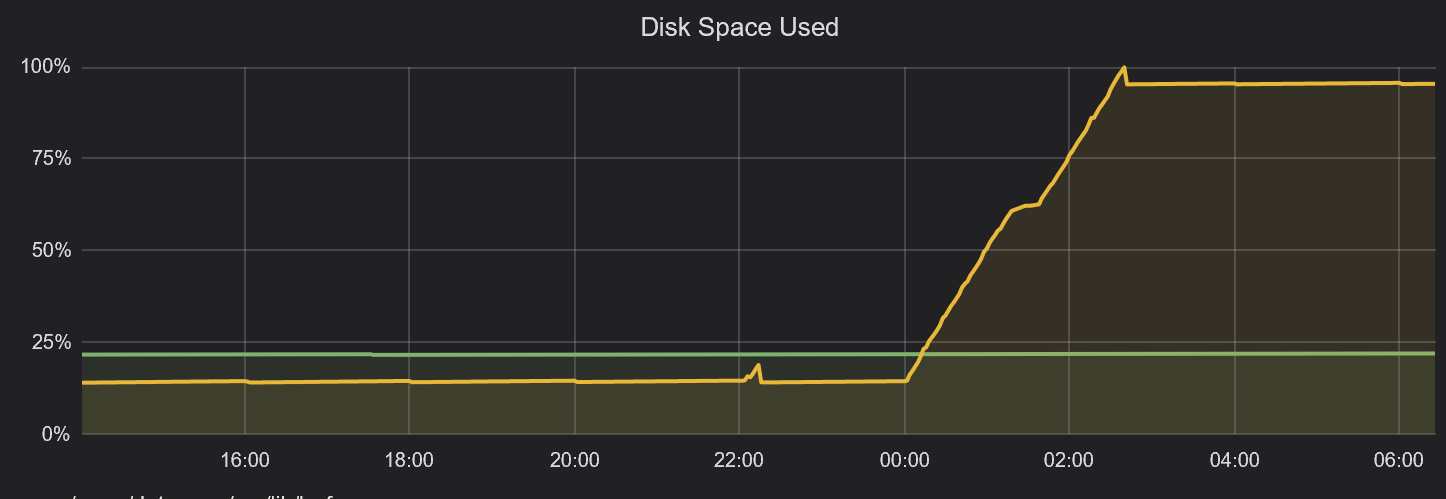
All storage consumed on 500GB volume shortly after midnight.
https://groups.google.com/forum/#!topic/prometheus-users/uAZ6ALu9AbU
Version: 2.2.1
I have outputted all information requested by Ben into the thread;
- meta.json output
- find . -ls ouput
- du -s * ouput
- visual representation of the issue (Grafana graph)
 VR6Pete
All 44 comments
Please attach any log files you can to this issue.
 SuperQ
on 23 Apr 2018
SuperQ
on 23 Apr 2018
unfortunately I cannot locate any Prometheus logs on my server, had to power off the instance as the server became unresponsive and cannot find any service logs for Prometheus.
VR6Pete
on 23 Apr 2018
Can you pull some metrics for me? I have a suspicion that RSS may be an issue for these large compactions.
@VR6Pete, I would be interested in seeing a graph of process_resident_memory_bytes for the Prometheus process for the time range covered by the original graph you posted.
SuperQ
on 24 Apr 2018
Hi There @SuperQ
https://snapshot.raintank.io/dashboard/snapshot/MJJf2xYBrfsGjh4YCXcLyGb2A6XrpbOE
I have set to expire after 7 days.
VR6Pete
on 24 Apr 2018
@VR6Pete That's not exactly what I was looking for, but I think it's close enough to show that this is indeed an OOM-related failure, possibly related to the large compaction.
Having a snapshot of this dashboard would be useful:
SuperQ
on 24 Apr 2018
Also confirming here happening to me. Prometheus V 2.2.1 with fresh new database.
level=error ts=2018-04-25T15:34:18.059820099Z caller=db.go:281 component=tsdb msg="compaction failed" err="persist head block: write compaction: add series: out-of-order series added with label set
 colonha
on 25 Apr 2018
colonha
on 25 Apr 2018
We are seeing the same issue and the same error log in our cluster.
persist head block: write compaction: add series: out-of-order series added with label set
 shuz
on 30 Apr 2018
shuz
on 30 Apr 2018
Can you give some info and steps how to replicate?
without a minimal config and steps to replicate it would be difficult to find the culprit.
 krasi-georgiev
on 30 Apr 2018
krasi-georgiev
on 30 Apr 2018
This is from our production logs. Hope it would help in investigation.
Version: 2.2.1
level=error ts=2018-05-08T12:23:40.579187722Z caller=db.go:281 component=tsdb msg="compaction failed" err="persist head block: write compaction: add series: out-of-order series added with label set {__name__="api_tracker_request_count", app="dmp", endpoint="api", instance="10.4.50.98:1323", job="kubernetes-pods", kubernetes_namespace="production", kubernetes_pod_name="dmp-tracker-69b6cd945-fpfg6", pod_template_hash="256278501", svc="tracker", version="201801011710"}
proto: no encoder for wall uint64 [GetProperties]
proto: no encoder for ext int64 [GetProperties]
proto: no encoder for loc *time.Location [GetProperties]
proto: no slice oenc for *reflect.rtype = []*reflect.rtype
proto: no encoder for Matchers []prompb.LabelMatcher [GetProperties]
panic: runtime error: index out of range

goroutine 10035 [running]:
github.com/prometheus/prometheus/vendor/github.com/prometheus/tsdb.(*memSeries).minTime(...)
    /go/src/github.com/prometheus/prometheus/vendor/github.com/prometheus/tsdb/head.go:1109
github.com/prometheus/prometheus/vendor/github.com/prometheus/tsdb.(*Head).Delete(0xc4202683c0, 0x80003883122cdf10, 0x7fffc77cedd324d7, 0xc4886eecb0, 0x1, 0x1, 0xc67c203788, 0xc67c203790)
    /go/src/github.com/prometheus/prometheus/vendor/github.com/prometheus/tsdb/head.go:591 +0x50d
github.com/prometheus/prometheus/vendor/github.com/prometheus/tsdb.(*DB).Delete.func2(0xc600000008, 0x1b6e848)
    /go/src/github.com/prometheus/prometheus/vendor/github.com/prometheus/tsdb/db.go:726 +0x5e
github.com/prometheus/prometheus/vendor/golang.org/x/sync/errgroup.(*Group).Go.func1(0xc668236040, 0xc668236640)
    /go/src/github.com/prometheus/prometheus/vendor/golang.org/x/sync/errgroup/errgroup.go:58 +0x57
created by github.com/prometheus/prometheus/vendor/golang.org/x/sync/errgroup.(*Group).Go
    /go/src/github.com/prometheus/prometheus/vendor/golang.org/x/sync/errgroup/errgroup.go:55 +0x66
 matejkloska
on 8 May 2018
matejkloska
on 8 May 2018
@matejkloska how often does it happen and do you remember any details what triggered it?
krasi-georgiev
on 9 May 2018
The panic you see @matejkloska is coming from a different place and has been fixed. Need to update the vendored TSDB.
Coming to the out of order compaction, I'll take a deeper look now.
 gouthamve
on 9 May 2018
gouthamve
on 9 May 2018
Also, are any of you doing deletes on the servers?
gouthamve
on 9 May 2018
What kind of deletes?
Since my server crashed and I don't want to start with a empty DB. I delete the corrupted series in order to have back and running my Prometheus setup. Not sure if this kind of delete you are talking about. Please let me know if you required detailed information.
colonha
on 9 May 2018
Yes, we had an incident that it keeps compacting the same set of blocks, and we deleted that folder as a work around.
It only happened to us 2-3 times in past 2 months. And usually we end up either find the bad block and delete it, or if it's not production data we just start clean. But we also don't know what's the repro steps to trigger it.
shuz
on 9 May 2018
@krasi-georgiev I see this error every time I try to remove series mentioned in compaction error.
@gouthamve please, how can I update vendored tsdb in prometheus which is deployed in k8s?
matejkloska
on 9 May 2018
@colonha I meant the Delete series API: POST /api/v1/admin/tsdb/delete_series
One of the reasons I am asking is because the error "should" never happen at all. We are sorting the series before adding them, so just trying to figure out why this is happening is a little weird.
gouthamve
on 9 May 2018
@shuz @matejkloska @colonha
After spending several hours scratching my head, I still have no idea why this is happening, and am not able to reproduce it. I would really appreciate it if you provide the data directory when you hit the error again so that I can reproduce it locally and see why this is happening.
I would only need the wal directory zipped (share over email to: [email protected] ?), but please keep in mind that this would contain all the information and series for the past 2hrs.
gouthamve
on 10 May 2018
Maybe this is related to #3487?
 strowi
on 10 May 2018
strowi
on 10 May 2018
Running docker image prom/prometheus:v2.2.1 in a pod in OpenShift Origin 3.7 and with /prometheus mounted to a local hostPath (backing storage provided to the hypervisor by a SAN, so NFS is not involved), I encountered OOM errors due to Prometheus exceeding the 3Gi of RAM it had been allocated.
After resolving the OOM condition (not sure if RAM consumption is tied to the same issue), I saw this in the logs:
level=info ts=2018-05-16T14:28:05.998068386Z caller=compact.go:393 component=tsdb msg="compact blocks" count=1 mint=1525446900000 maxt=1525447800000
level=error ts=2018-05-16T14:28:08.965051049Z caller=db.go:281 component=tsdb msg="compaction failed" err="persist head block: write compaction: add series: out-of-order series added with label set \"{__name__=\\\"go_gc_duration_seconds\\\",instance=\\\"10.128.0.220:9090\\\",job=\\\"kubernetes-service-endpoints\\\",kubernetes_name=\\\"prometheus\\\",kubernetes_namespace=\\\"prometheus\\\",name=\\\"prometheus\\\",quantile=\\\"0\\\"}\""
I recovered over 10GB disk space by deleting the .tmp directories Prometheus had generated, but the compaction errors continue to be logged. I can provide some data if this is considered the same issue.
 mysteryegg
on 16 May 2018
mysteryegg
on 16 May 2018
Reproduced the compaction errors after upgrading another instance from prom/prometheus:v2.0.0 to prom/prometheus:v2.2.1 in Docker Swarm Mode (Docker 17.12.0-ce on CentOS 7.4) with bind mount to host path for for /prometheus data directory; block device (virtual hard disk) formatted as XFS.
In this instance, it seemed to be related to deleting the /prometheus data while preserving the rest of the Prometheus data. I falsely assumed that wiping /prometheus would result in a fresh TSDB, but in the logs I saw: level=warn ts=2018-05-16T18:56:38.2690792Z caller=head.go:320 component=tsdb msg="unknown series references in WAL samples" count=557 on startup despite the bind mount for /prometheus being completely empty. Upon wiping the Docker storage for that container completely, the compaction error messages went away.
mysteryegg
on 16 May 2018
if you still have the data I would like to take a look [email protected]
krasi-georgiev
on 17 May 2018
Is it possible that an out-of-order series could be introduced by an orchestrator running a second replica of Prometheus writing to a common location?
mysteryegg
on 17 May 2018
The file locking on the tsdb should catch that.
 brian-brazil
on 17 May 2018
brian-brazil
on 17 May 2018
@mysteryegg Actually this might be a very good suggestion I had a quick look and it seems that the lock check will ignore the lock file when the PID from the file doesn't match a running process which might be the case when running inside 2 different containers.
krasi-georgiev
on 17 May 2018
Well that's a bug. We should be able to rely on just normal file locking rather than inventing our own thing.
brian-brazil
on 17 May 2018
we are using github.com/nightlyone/lockfile , but lets see if this is the real culprit.
krasi-georgiev
on 17 May 2018
See also https://github.com/prometheus/tsdb/issues/178 and https://github.com/prometheus/prometheus/issues/2689.
We should be able to rely on just normal file locking rather than inventing our own thing.
+1
 simonpasquier
on 18 May 2018
simonpasquier
on 18 May 2018
@mysteryegg I have checked the WAL you sent me and it replicates the error unknown series references in WAL samples
What I found so far confirms your suggestion that more than one Prometheus instance has written to the WAL files at the same time.
the twist here is there is a incorrect matching with the series hashes and the samples references.
I will try to replicate it by running more than one Prometheus instance to confirm.
krasi-georgiev
on 18 May 2018
Although the logs look similar I think we have few different issues here
@VR6Pete your issue seems to be caused by OOM-ing Prometheus which doesn't allow a complete compaction resulting in lots of
.tmpfiles. As per @SuperQ suggestion some fine tuning of your configs or increasing the RAM should resolve the issue.- @matejkloska according to @gouthamve this should be fixed in the latest tsdb so I updated the vendored tsdb package in #4179 and once merged you can test the master docker image or just build from source. Ping me on IRC if you need any help there.
@mysteryegg the only way I could replicate your issues is when the WAL files are messed up. So I think as per your comments this is caused by some weird race with the orchestrator running additional replicas.Unless someone suggest some other way to replicate I wouldn't consider this as a bug.
I managed to replicate it like this:- more than one Prometheus servers creating WAL files without reading the existing WAL files.
- deleting some of the WAL files in between restarts.
@colonha ,@shuz I think although the issues is during compaction as well , the cause for this looks different than the original report so could you please open a new issue with as much details as possible and some suggestions how to replicate and I will try to find the culprit.
It bugs me how to find a better way to replicate these since sharing the DATA is always an issue for exposing company details.
Suggestions will be rewarded with Ice Cream :ice_cream: :smile:
krasi-georgiev
on 22 May 2018
Hi, I managed to replicate it thanks to the data sent to me by @mysteryegg (sorry I couldn't take a look earlier). This could be caused by two prometheus writing to the same directory.
So from your data what I see is, there are two different series with the same series-id in the WAL. Now what happens then is that this gets called twice with the same id but different series.
So we essentially create series1 with id and then overwrite it with series2 with id too. But what happens when we add series2 is that this called both times, adding the same id twice to allPostingsKey. Which means we get the same series twice when iterating over the list of series, causing this issue.
Again, huge thanks to @mysteryegg for shipping me the data! I am pretty sure there is no way that two series could have the same id in the WAL unless two different prometheus are writing to it. Though I'll keep digging to confirm it is the case.
gouthamve
on 22 May 2018
It feels like we hit the same issue, because when it happens, we got some wrong query results.
For example, we are querying metric a, and we got response from prometheus with a totally unrelated metric name.
However we are running Prometheus as statefulset in k8s, and uses PVC for Prometheus. I don't feel two Prometheus are writing to the same data folder. When the issue happens, Prometheus is usually in running status.
shuz
on 24 May 2018
@shuz the issue might be caused by allowing more than one Prometheus writing to the same files at any time and not exactly at the time you are seeing the error logs.
In other words if more than one Prometheus instance wrote to the same folder at any given time expect the unexpected at any given time after that :smile:
krasi-georgiev
on 28 May 2018
@krasi-georgiev Thank you, we reviewed the prometheus metrics and did find another prometheus 2.0.0 is running for a short period of time and then disappeared. And finally tracked down an issue in our k8s cluster that lead to some unexpected pods get run on our cluster.
Thank you for the big hint or we can never track down the issue!
shuz
on 31 May 2018
@shuz glad we could resolve it :+1:
krasi-georgiev
on 1 Jun 2018
added in the wiki FAQ section
https://github.com/prometheus/prometheus/wiki/FAQ#error-logs-for-out-of-order-series
krasi-georgiev
on 1 Jun 2018
I think we managed to find the cause for this so closing now.
Feel free to reopen if you face this again.
as a side note Fabian replaced the file locking with a different package so in theory this should prevent starting more than one Prometheus instance with the same data folder
https://github.com/prometheus/tsdb/pull/337
this is merged in the current master and will be added in the new release which is currently baking and will be out in few days.
krasi-georgiev
on 5 Jun 2018
@krasi-georgiev I have prometheus-federation running which gathers metrics from 5 different prometheus-servers running on different clusters. As, i am only persisting data on the prometheus-federation. All metrics data is written in one persistent volume/data/tsdb. As i understand below issues appears if you are writing muilple prometheus-server metrics data to one single location. So, what is the best approach to setup a prometheus-federated to avoid below issue . As currently my prometheus-federation server crashed every few hours.
drwxr-xr-x. 3 4294967294 4294967294  4096 Jun  5 14:44 01CF86GMDEWDS84GCVF4BJ5ZEN.tmp
drwxr-xr-x. 3 4294967294 4294967294  4096 Jun  5 14:51 01CF86W3M2MT8KB6S9G5G97PJ1.tmp
drwxr-xr-x. 3 4294967294 4294967294  4096 Jun  5 14:51 01CF86VQJJZR2EM2270KF09FK4.tmp
drwxr-xr-x. 3 4294967294 4294967294  4096 Jun  5 14:51 01CF86VC6W387E57TP2N09J9H5.tmp
drwxr-xr-x. 3 4294967294 4294967294  4096 Jun  5 14:58 01CF879DM7X73Z422F5XQ3BW3J.tmp
drwxr-xr-x. 3 4294967294 4294967294  4096 Jun  5 14:58 01CF878VZ2SARPW1RMR3P7FS2R.tmp
drwxr-xr-x. 3 4294967294 4294967294  4096 Jun  5 14:58 01CF878DTD6W7WMEZBAF4M7GBX.tmp
drwxr-xr-x. 3 4294967294 4294967294  4096 Jun  5 14:58 01CF877NNRRDFXSGGESG3KBP67.tmp
drwxr-xr-x. 3 4294967294 4294967294  4096 Jun  5 14:58 01CF877AP32NSBGCES53YMG9AF.tmp
drwxr-xr-x. 2 4294967294 4294967294 24576 Jun  5 15:04 wal
drwxr-xr-x. 3 4294967294 4294967294  4096 Jun  5 15:04 01CF87N9TNG8587WVMWZD2BJMT.tmp
drwxr-xr-x. 3 4294967294 4294967294  4096 Jun  5 15:05 01CF87NMR9T0PQQDDH7VBYYMJR.tmp
drwxr-xr-x. 3 4294967294 4294967294  4096 Jun  5 15:05 01CF87P0SHGTV3DWBAN23B23T2.tmp
drwxr-xr-x. 3 4294967294 4294967294  4096 Jun  5 15:05 01CF87PF95NKBA2K44YSEC40B1.tmp
drwxr-xr-x. 3 4294967294 4294967294  4096 Jun  5 15:05 01CF87Q11R6T3RW7ZJZ6BQRA9N.tmp
Logs Snippet
{"log":"level=error ts=2018-06-05T15:15:38.429923414Z caller=db.go:281 component=tsdb msg=\"compaction failed\" err=\"persist head block: write compaction: add series: out-of-order series added with label set \\\"{__name__=\\\\\\\"go_gc_duration_seconds\\\\\\\",instance=\\\\\\\"127.0.0.1:9090\\\\\\\",job=\\\\\\\"prometheus-federation-server\\\\\\\",quantile=\\\\\\\"0\\\\\\\"}\\\"\"\n","stream":"stderr","time":"2018-06-05T15:15:38.430308709Z"}
{"log":"level=info ts=2018-06-05T15:15:47.035262269Z caller=compact.go:393 component=tsdb msg=\"compact blocks\" count=1 mint=1528209000000 maxt=1528210800000\n","stream":"stderr","time":"2018-06-05T15:15:47.037755154Z"}
{"log":"level=error ts=2018-06-05T15:16:00.997470295Z caller=compact.go:403 component=tsdb msg=\"removed tmp folder after failed compaction\" err=\"remove /data/tsdb/01CF889C6V5NFJFTZZGP1A66ST.tmp/chunks: directory not empty\"\n","stream":"stderr","time":"2018-06-05T15:16:00.997728157Z"}
{"log":"level=error ts=2018-06-05T15:16:00.99756307Z caller=db.go:281 component=tsdb msg=\"compaction failed\" err=\"persist head block: write compaction: add series: out-of-order series added with label set \\\"{__name__=\\\\\\\"go_gc_duration_seconds\\\\\\\",instance=\\\\\\\"127.0.0.1:9090\\\\\\\",job=\\\\\\\"prometheus-federation-server\\\\\\\",quantile=\\\\\\\"0\\\\\\\"}\\\"\"\n","stream":"stderr","time":"2018-06-05T15:16:00.997785401Z"}
{"log":"level=info ts=2018-06-05T15:16:05.013762522Z caller=compact.go:393 component=tsdb msg=\"compact blocks\" count=1 mint=1528209000000 maxt=1528210800000\n","stream":"stderr","time":"2018-06-05T15:16:05.020413735Z"}
 amitsingla
on 5 Jun 2018
amitsingla
on 5 Jun 2018
@amitsingla this issue got a bit mixed up and covers report for few different issues as per my comment above.
https://github.com/prometheus/prometheus/issues/4108#issuecomment-390953187
in your case it doesn't matter that the prometheus server gathers data from different servers. As long as only a single server writes the collected data to the disk folder than it will all work as planed.
now in your case I suspect you are hitting the first issue in my comment
@VR6Pete your issue seems to be caused by OOM-ing Prometheus which doesn't allow a complete compaction resulting in lots of .tmp files. As per @SuperQ suggestion some fine tuning of your configs or increasing the RAM should resolve the issue.
If you believe that your issues is different would you mind opening a new issues with a bit more details as this one is quite mixed already.
krasi-georgiev
on 5 Jun 2018
@krasi-georgiev As you suggested , i have increased the MEM for my prometheus federation from 8GB to 12 GB & monitored for 2 weeks. I did not faced the *.tmp files issues in last 2 weeks.
Prometheus-Server version : 2.2.0
/bin/prometheus \
--config.file=/etc/config/prometheus.yml \
--storage.tsdb.path=/data/tsdb \
--storage.tsdb.retention=30d \
--storage.tsdb.no-lockfile \
--storage.tsdb.min-block-duration=30m \
--storage.tsdb.max-block-duration=1d \
--web.external-url=http://
--web.enable-lifecycle \
--web.console.libraries=/etc/prometheus/console_libraries \
--web.console.templates=/etc/prometheus/consoles
Also i have upgraded my prometheus federation from 2.2.0 to 2.3.0 few days back & till now no issues with 2.3.0.
amitsingla
on 25 Jun 2018
@amitsingla thanks for the update , much appreciated.
We have also started discussing how to decrease the memory usage during compaction.
Would need to do some profiling and see where most memory gets used.
krasi-georgiev
on 25 Jun 2018
@krasi-georgiev After 3 weeks & upgrade to 2.3.0 . I faced a CLBO issue today with below error.
looks like , its still open https://github.com/prometheus/prometheus/issues/4302
After rollback to 2.2.0 fixed the below issue. So , i will wait for an upgrade till above issue fix.
{"log":"level=info ts=2018-06-26T16:06:30.927238649Z caller=repair.go:39 component=tsdb msg=\"found healthy block\" mint=1530005400000 maxt=1530007200000 ulid=01CGY3J66ZFC9GXQXYV2T1CKN
D\n","stream":"stderr","time":"2018-06-26T16:06:30.927369297Z"}
{"log":"level=info ts=2018-06-26T16:06:43.574795702Z caller=main.go:402 msg=\"Stopping scrape discovery manager...\"\n","stream":"stderr","time":"2018-06-26T16:06:43.575061692Z"}
{"log":"level=info ts=2018-06-26T16:06:43.574871998Z caller=main.go:416 msg=\"Stopping notify discovery manager...\"\n","stream":"stderr","time":"2018-06-26T16:06:43.575098549Z"}
{"log":"level=info ts=2018-06-26T16:06:43.574882096Z caller=main.go:438 msg=\"Stopping scrape manager...\"\n","stream":"stderr","time":"2018-06-26T16:06:43.575114098Z"}
{"log":"level=info ts=2018-06-26T16:06:43.574896042Z caller=manager.go:464 component=\"rule manager\" msg=\"Stopping rule manager...\"\n","stream":"stderr","time":"2018-06-26T16:06:43.
575118431Z"}
{"log":"level=info ts=2018-06-26T16:06:43.574908457Z caller=manager.go:470 component=\"rule manager\" msg=\"Rule manager stopped\"\n","stream":"stderr","time":"2018-06-26T16:06:43.5751
22304Z"}
{"log":"level=info ts=2018-06-26T16:06:43.574916293Z caller=notifier.go:512 component=notifier msg=\"Stopping notification manager...\"\n","stream":"stderr","time":"2018-06-26T16:06:43
.575127411Z"}
{"log":"level=info ts=2018-06-26T16:06:43.574926579Z caller=main.go:588 msg=\"Notifier manager stopped\"\n","stream":"stderr","time":"2018-06-26T16:06:43.575131078Z"}
{"log":"level=info ts=2018-06-26T16:06:43.57491723Z caller=main.go:603 msg=\"Loading configuration file\" filename=/etc/config/prometheus.yml\n","stream":"stderr","time":"2018-06-26T16:06:43.575134641Z"}
{"log":"level=info ts=2018-06-26T16:06:43.574910524Z caller=main.go:432 msg=\"Scrape manager stopped\"\n","stream":"stderr","time":"2018-06-26T16:06:43.575138231Z"}
{"log":"level=info ts=2018-06-26T16:06:43.574974598Z caller=main.go:412 msg=\"Notify discovery manager stopped\"\n","stream":"stderr","time":"2018-06-26T16:06:43.57514593Z"}
{"log":"level=info ts=2018-06-26T16:06:43.574985776Z caller=main.go:398 msg=\"Scrape discovery manager stopped\"\n","stream":"stderr","time":"2018-06-26T16:06:43.575149861Z"}
{"log":"level=error ts=2018-06-26T16:06:43.577292136Z caller=main.go:597 err=\"Opening storage failed invalid block sequence: block time ranges overlap: [mint: 1530005400000, maxt: 1530007200000, range: 30m0s, blocks: 141]: \u003culid: 01CGXSFD81W2CY7G2VY8JETATR, mint: 1530005400000, maxt: 1530007200000, range: 30m0s\u003e, \u003culid: 01CGXSED5MR9WQMQZ15QBNM9M7, mint: 1530005400000, maxt: 1530007200000, range: 30m0s\u003e, \u003culid: 01CGXSEWNEMYB67C7NAVFQGEWB, mint: 1530005400000, maxt: 1530007200000, range: 30m0s\u003e, \u003culid: 01CGXZ9P4RGPE6BB3S5B8WDQ9K, mint: 1530005400000, maxt: 1530007200000, range: 30m0s\u003e, \u003culid: 01CGXSFZQ70N7QCXPS3HJGEE2Q, mint: 1530005400000, maxt: 1530007200000, range: 30m0s\u003d
amitsingla
on 26 Jun 2018
what is CLBO?
was this caused by another OOM?
Usually you should have some .tmp files when Prometheus was killed or crashed during a compaction.
krasi-georgiev
on 26 Jun 2018
@amitsingla is not the OP, and their log file is different. This is a different issue. Please file new issues as new bugs rather than chiming in on unrelated closed bugs.
brian-brazil
on 26 Jun 2018
This thread has been automatically locked since there has not been any recent activity after it was closed. Please open a new issue for related bugs.
![lock[bot] picture](https://avatars1.githubusercontent.com/in/6672?v=4&s=40) lock[bot]
on 22 Mar 2019
lock[bot]
on 22 Mar 2019
Related issues
 dannyk81
·
45Comments
dannyk81
·
45Comments
 LordFPL
·
50Comments
LordFPL
·
50Comments
 fabxc
·
46Comments
brian-brazil
·
102Comments
fabxc
·
46Comments
brian-brazil
·
102Comments
 bandesz
·
50Comments
bandesz
·
50Comments
Most helpful comment
Also confirming here happening to me. Prometheus V 2.2.1 with fresh new database.
level=error ts=2018-04-25T15:34:18.059820099Z caller=db.go:281 component=tsdb msg="compaction failed" err="persist head block: write compaction: add series: out-of-order series added with label set