Prometheus: CPU Usage triples after upgrade to v2.1.0
What did you do?
Upgraded Prometheus from v2.0.0 to v2.1.0 (using the official Docker image)
What did you expect to see?
Similar or better performance figures.
What did you see instead? Under which circumstances?
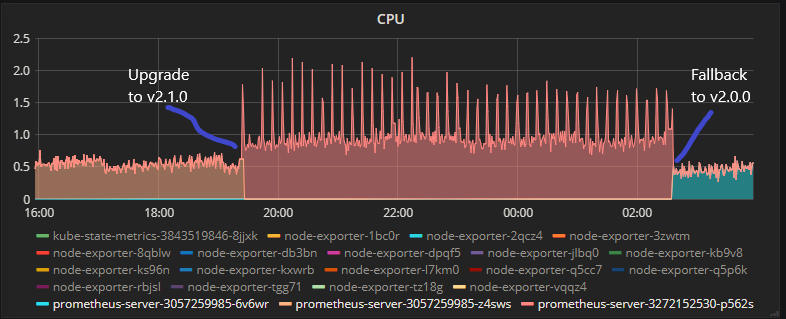
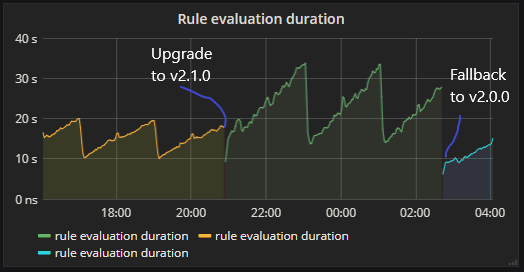
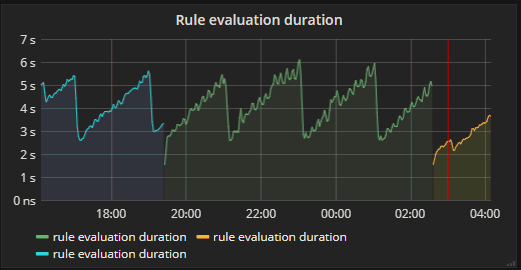
CPU Usage almost tripled and rule evaluation times increased, we observed the same on two different deployment (two separate K8s clusters), after failing back to v2.0.0 figures are back to normal.
Cluster 1 [CPU]:

Cluster 2 [CPU]:
Cluster 1 [Rule evluation duration]:
Cluster 2 [Rule evluation duration]: graph looks about the same, but this cluster is smaller:
Except changing the docker image version, everything remained unchanged.
Environment
- System information:
Linux 4.12.10-coreos x86_64 (Runs in K8s 1.5.3 Cluster)
- Prometheus version:
prometheus, version 2.1.0 (branch: HEAD, revision: 85f23d82a045d103ea7f3c89a91fba4a93e6367a)
  build user:       root@6e784304d3ff
  build date:       20180119-12:01:23
  go version:       go1.9.2
Alertmanager version:
N/A
Prometheus configuration file:
Can provide if needed
- Alertmanager configuration file:
N/A
- Logs:
Can provide if needed
 dannyk81
All 45 comments
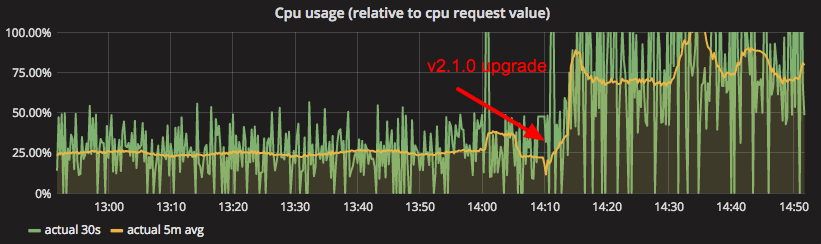
I see the same thing on Kubernetes Engine 1.8.6-gke.0 going from Prometheus 2.0.0 to 2.1.0:
The logs don't indicate there's anything special going on:
level=info ts=2018-01-20T13:09:22.585447311Z caller=main.go:225 msg="Starting Prometheus" version="(version=2.1.0, branch=HEAD, revision=85f23d82a045d103ea7f3c89a91fba4a93e6367a)"
level=info ts=2018-01-20T13:09:22.585523718Z caller=main.go:226 build_context="(go=go1.9.2, user=root@6e784304d3ff, date=20180119-12:01:23)"
level=info ts=2018-01-20T13:09:22.585546075Z caller=main.go:227 host_details="(Linux 4.4.86+ #1 SMP Thu Dec 7 20:11:11 PST 2017 x86_64 prometheus-1 (none))"
level=info ts=2018-01-20T13:09:22.585564529Z caller=main.go:228 fd_limits="(soft=1048576, hard=1048576)"
level=info ts=2018-01-20T13:09:22.588658792Z caller=main.go:499 msg="Starting TSDB ..."
level=info ts=2018-01-20T13:09:22.588686556Z caller=web.go:383 component=web msg="Start listening for connections" address=0.0.0.0:9090
level=info ts=2018-01-20T13:09:50.424774629Z caller=main.go:509 msg="TSDB started"
level=info ts=2018-01-20T13:09:50.42494659Z caller=main.go:585 msg="Loading configuration file" filename=/prometheus-config/prometheus.yml
level=info ts=2018-01-20T13:09:50.432711846Z caller=kubernetes.go:191 component="discovery manager scrape" discovery=k8s msg="Using pod service account via in-cluster config"
level=info ts=2018-01-20T13:09:50.433969004Z caller=kubernetes.go:191 component="discovery manager scrape" discovery=k8s msg="Using pod service account via in-cluster config"
level=info ts=2018-01-20T13:09:50.434900141Z caller=kubernetes.go:191 component="discovery manager scrape" discovery=k8s msg="Using pod service account via in-cluster config"
level=info ts=2018-01-20T13:09:50.435884965Z caller=kubernetes.go:191 component="discovery manager scrape" discovery=k8s msg="Using pod service account via in-cluster config"
level=info ts=2018-01-20T13:09:50.437116695Z caller=kubernetes.go:191 component="discovery manager scrape" discovery=k8s msg="Using pod service account via in-cluster config"
level=info ts=2018-01-20T13:09:50.438063243Z caller=kubernetes.go:191 component="discovery manager scrape" discovery=k8s msg="Using pod service account via in-cluster config"
level=info ts=2018-01-20T13:09:50.438998843Z caller=kubernetes.go:191 component="discovery manager scrape" discovery=k8s msg="Using pod service account via in-cluster config"
level=info ts=2018-01-20T13:09:50.459854142Z caller=main.go:486 msg="Server is ready to receive web requests."
level=info ts=2018-01-20T13:09:50.459854122Z caller=manager.go:59 component="scrape manager" msg="Starting scrape manager..."
 JorritSalverda
on 20 Jan 2018
JorritSalverda
on 20 Jan 2018
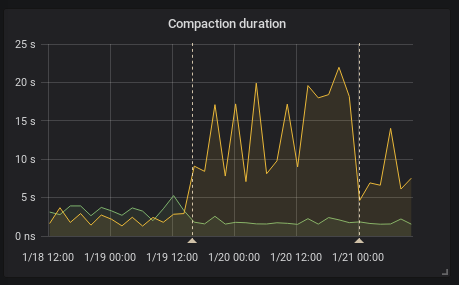
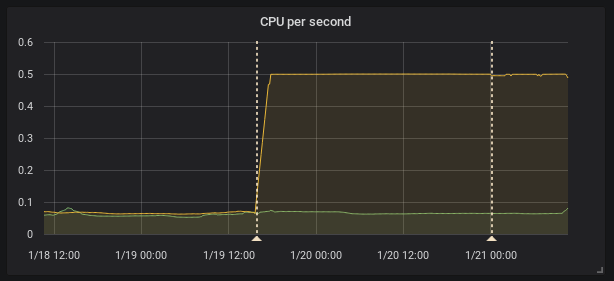
I see the same thing in our kubernetes cluster running official docker image and also changing only the image tag.
(the firts annotation is upgrade from 2.0.0 to 2.1.0 the second one is restart due to the OOM kill by kuberrnetes)
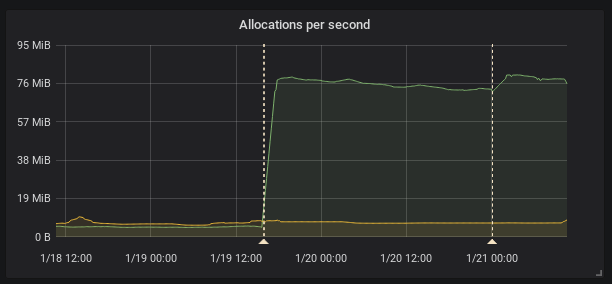
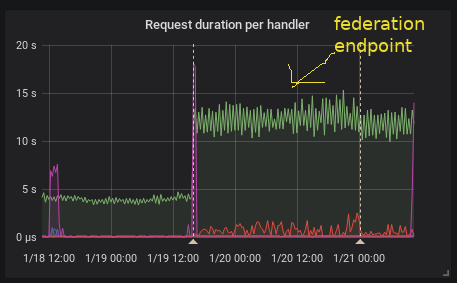
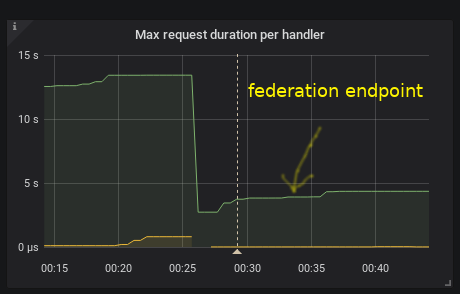
This is interesting because according to the release note the federation should be faster
[ENHANCEMENT] Federation is now much faster for large numbers of series.
To provide HA I federate all timeseries (I know it's not right it's just temporary solution) so it is I think exactly this case as stated and the federation is even slower.
Recording rules evaluation time did not change in my case.
 FUSAKLA
on 21 Jan 2018
FUSAKLA
on 21 Jan 2018
Running a test setup where I am federating 380K series, there is indeed a CPU gain and allocs increase of about 20% and slight slowdown (~10%). While nowhere close to the numbers reported, this certainly mandates a look.
This is one of the changes in the federation code-path: https://github.com/prometheus/prometheus/pull/3569
 gouthamve
on 22 Jan 2018
gouthamve
on 22 Jan 2018
may i ask what's the min time interval of this tool ? can i set scrape_interval to sub second?
 goddog1118
on 23 Jan 2018
goddog1118
on 23 Jan 2018
@goddog1118 Please don't ask unrelated questions on bugs, use the prometheus-users mailing list.
 brian-brazil
on 23 Jan 2018
brian-brazil
on 23 Jan 2018
I'm also seeing similar problems, in case it helps with prioritisation.
Here's a graph showing the difference in resource utilisation at our site. The only change was to upgrade from 2.0 to 2.1:
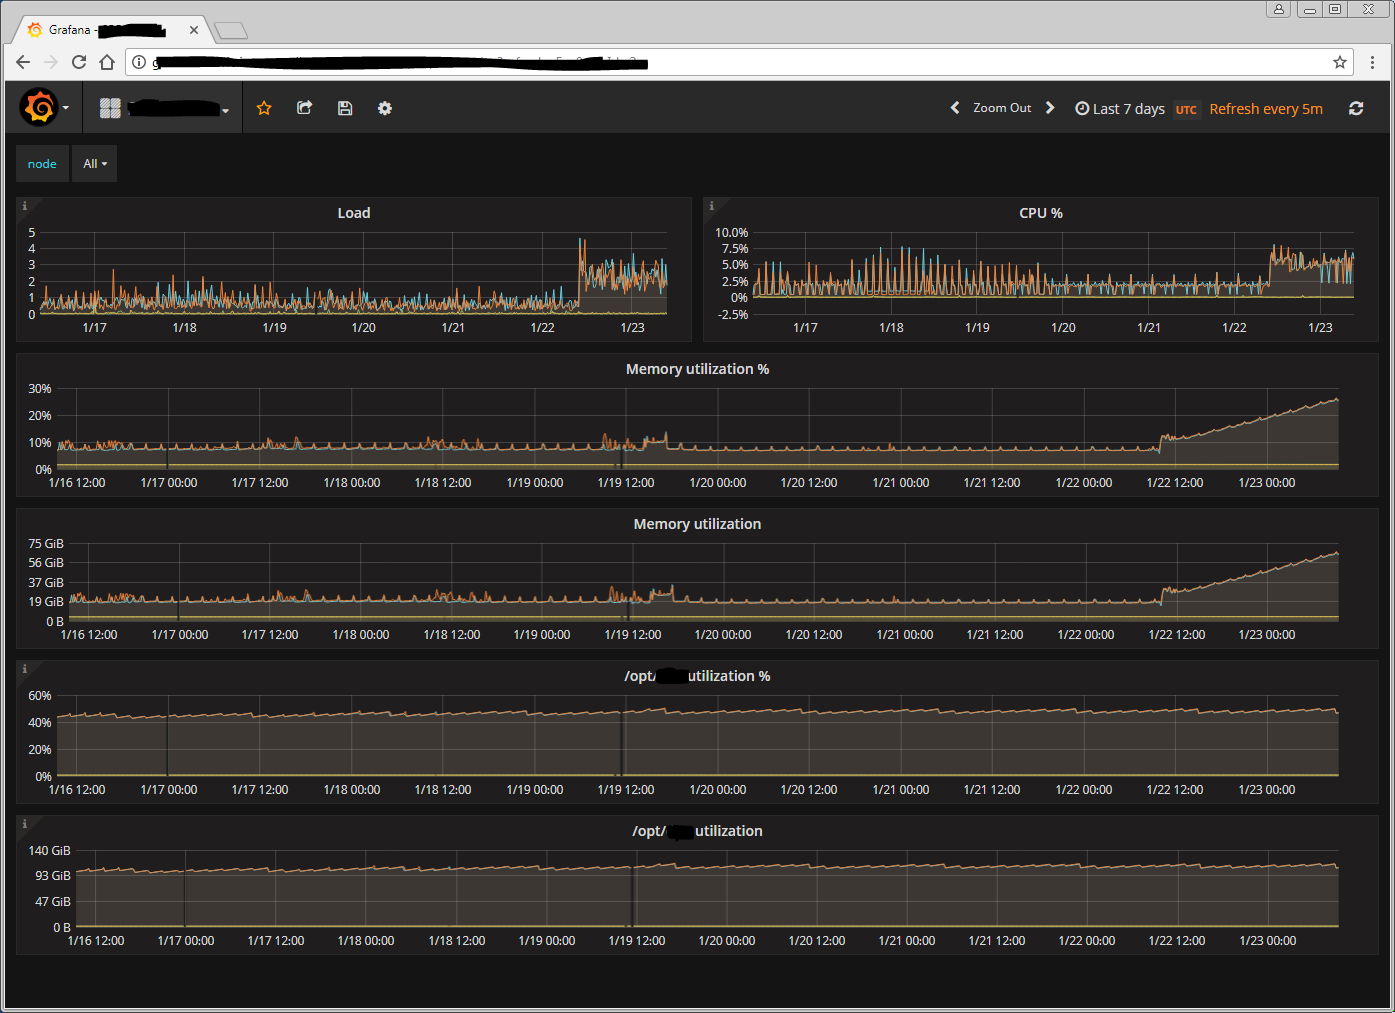
 paddynewman
on 24 Jan 2018
paddynewman
on 24 Jan 2018
Can someone share their configuration and a pprof?
brian-brazil
on 24 Jan 2018
Here's our configuration. I've had to heavily redact it; I hope it's still useful. The codeshare will expire in 24 hours.
I'm not sure how to take a pprof but I'm investigating that now.
paddynewman
on 24 Jan 2018
@paddynewman thanks I will try to look into this in the next few days and will let you know if I find anything.
mem and cpu pprof would really help narrow it down.
If it is not too much to ask please generate mem and cpu pprof with 2.0 (normal performance) and 2.1 higher cpu and mem usage to compare the results.
 krasi-georgiev
on 24 Jan 2018
krasi-georgiev
on 24 Jan 2018
@FUSAKLA the graph you showed on memory allocations also looks interesting.
In general as @krasi-georgiev mentioned cpu profile as well as memory allocation profiles would be great. If you have a go runtime installed you can collect a memory profile (note that you may need to make sure your go runtime running these commands is the same version as the Prometheus server was compiled with):
go tool pprof http://<your prometheus server>/debug/pprof/heap
And a 30s CPU profile with
go tool pprof http://<your prometheus server>/debug/pprof/profile
These commands will write profiles to disk, you can upload that profile for us to analyze.
 brancz
on 24 Jan 2018
brancz
on 24 Jan 2018
I have the profiling output, at least for 2.1, but my $employer will not allow me to share it. I can generate the output for 2.0 as well but again, I won't be allowed to share it.
Is there anything else I can do to help while I figure out how to use pprof myself?
paddynewman
on 24 Jan 2018
Profiling output will not contain anything sensitive, it's mainly function names.
brian-brazil
on 24 Jan 2018
I can create those profiles and share them but have no experience using pprof. When I run it it puts me in an interactive mode. Are there any flags to pass so it collects what you need in a non-interactive way?
JorritSalverda
on 24 Jan 2018
you can leave the interactive mode right away, the first line or so should say that the full profile has been written to ~/pprof/<profile-name>. Simply share that file.
brancz
on 24 Jan 2018
Prometheus 2.1 profiles:
https://drive.google.com/folderview?id=13_Scu9wS2u_odOyXvbhJMAZsgXk9yOIr
paddynewman
on 24 Jan 2018
I've created profiles for both versions although they're from different servers. None of the servers uses federation.
https://drive.google.com/file/d/1fXE64oJ8uA86a47nqD_23BQ2nuaKB6XR/view?usp=sharing
JorritSalverda
on 24 Jan 2018
Sorry for the delay
I managed to get pprof data from the federated 2.1.0 prometheus instance
Unfortunately the instance got OOM kill recently so the memory usage is not SO high.
I'll get more critical data tomorrow if needed.
link here (I hope i don't break any rules in my company :) )
i also added prometheus metrics and configurations (both the federated and the federating instances)
Sadly a tried to downgrade back to 2.0.0 version but end up with (using official upstream docker images)
level=info ts=2018-01-24T17:32:57.106618248Z caller=main.go:314 msg="Starting TSDB"
level=info ts=2018-01-24T17:32:57.106646142Z caller=targetmanager.go:71 component="target manager" msg="Starting target manager..."
level=error ts=2018-01-24T17:32:57.187507378Z caller=main.go:323 msg="Opening storage failed" err="read meta information /prometheus/01C4MHVPYRN7THY4KS3KAZP1A5: unexpected meta file version 2"
the metafile.json contains:
{
    "ulid": "01C4MHVPYRN7THY4KS3KAZP1A5",
    "minTime": 1516802400000,
    "maxTime": 1516809600000,
    "stats": {
        "numSamples": 13784198,
        "numSeries": 42773,
        "numChunks": 117088
    },
    "compaction": {
        "level": 1,
        "sources": [
            "01C4MHVPYRN7THY4KS3KAZP1A5"
        ]
    },
    "version": 2
}
So it looks like i have problem with downgrade from 2.1.0 to 2.0.0 but in changelog was no mention about backward incompatibility in storage?
This would mean more problems and minor data loss for me which won't be so critical but I would prefer to solve this some better way. Than I'll gladly give the pprof data from 2.0.0 version.
FUSAKLA
on 24 Jan 2018
I suspect this is a side effect of the switch to mergeseriesset over dedupeseriesset - the latter would just drop equivalent series, whilst the former merges them. This should be easy to test - but can someone share the federation match params they use? If they have multiple matchers returns the same series that might explain it.
 tomwilkie
on 25 Jan 2018
tomwilkie
on 25 Jan 2018
If someone experiencing the issue could test the above PR, I think that might fix this.
tomwilkie
on 25 Jan 2018
my federation uses '{job=~"(.+)"}' the configuration is in the file i posted
I can try the PR version but i need docker image is it built automatically or do i have to build it by myself?
FUSAKLA
on 25 Jan 2018
@FUSAKLA thats a single match, so shouldn't cause the original issue I suspected, although my PR might speed things up.
I'll build you a docker image.
tomwilkie
on 25 Jan 2018
It's ok i can do it by myself i just didn't know if you have some CI docker repository with branch builds.
FUSAKLA
on 25 Jan 2018
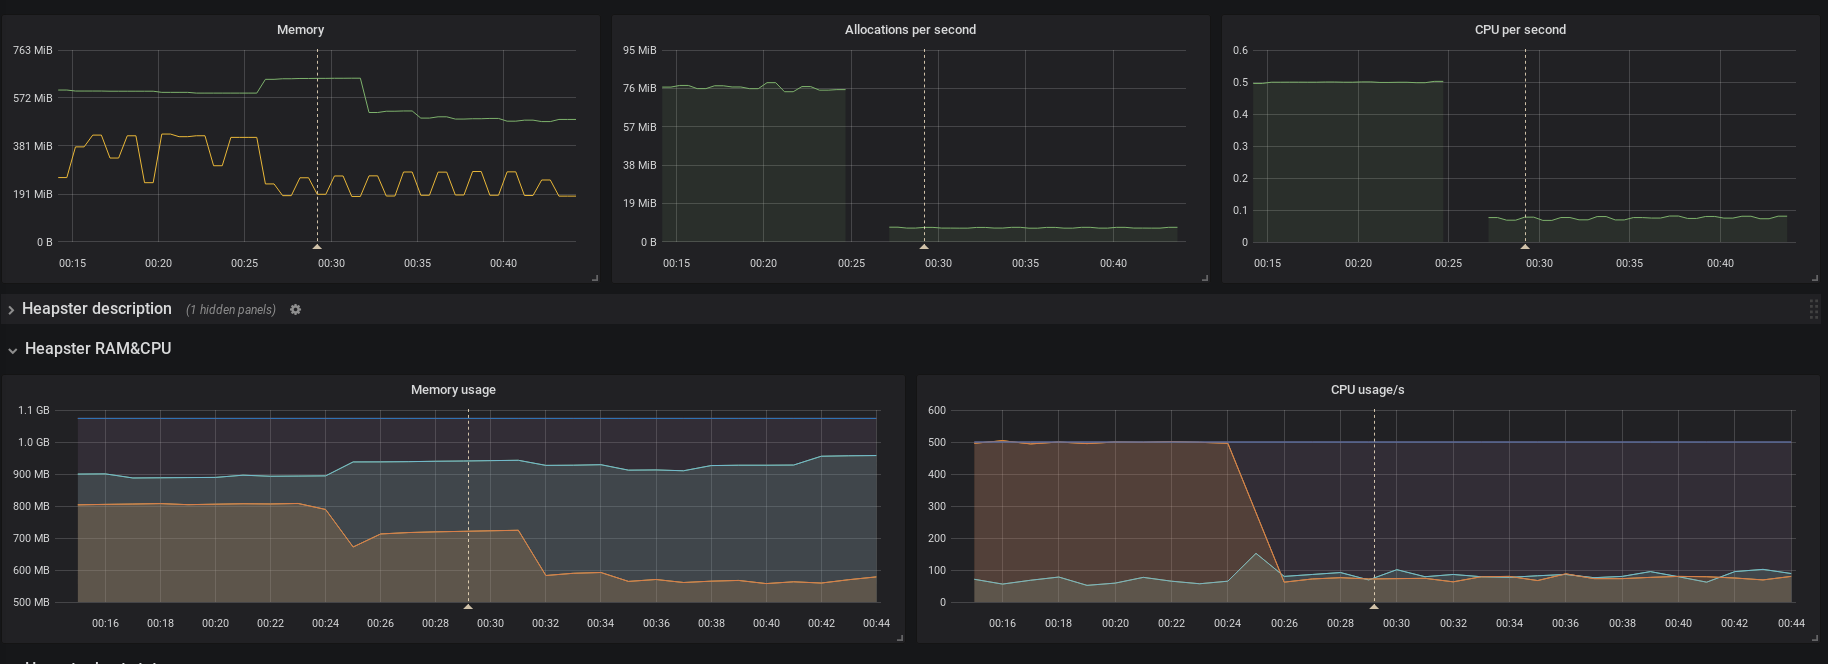
Just pushed tomwilkie/prometheus:3715-2.1-cpu-749781ed, let me know if it helps!
tomwilkie
on 25 Jan 2018
There is some improvement in memory usage but I'm not sure if significant enough to say it caused by the fix. The CPU and allocations seems to by untouched by the fix.
FUSAKLA
on 25 Jan 2018
Okay, I think that probably rules out the federation changes as the cause - with that fix they should be strictly better than 2.0. Thanks for your help.
tomwilkie
on 25 Jan 2018
No problem, I'll be glad to help sort this out. I was waiting for those bugfixes introduced in 2.1.0.
FUSAKLA
on 25 Jan 2018
https://github.com/prometheus/client_golang/issues/366~~
maybe the gzip cause the high cpu usage?
federate and client_golang promhttp use same writeSample funcstions.
 tinytub
on 25 Jan 2018
tinytub
on 25 Jan 2018
The gzip code hasn't changed in a long time.
brian-brazil
on 25 Jan 2018
sorry I am wrong,
I take a pprof when curl "http://mdb73:9090/federate?match[]{__name__=~"disk.*"}" -H 'Accept-Encoding: gzip'
It's about 637342 line series
https://drive.google.com/file/d/1QLAcmxbbkovc7h9EStlG37_AwvNer4hR/view?usp=sharing
Hope it helps
tinytub
on 25 Jan 2018
I just opened https://github.com/prometheus/prometheus/pull/3740 which I believe fixes the primary issue (and elaborates on another one, which shouldn't be a problem though except for higher allocations). If someone could test it, that would be great! :slightly_smiling_face:
brancz
on 25 Jan 2018
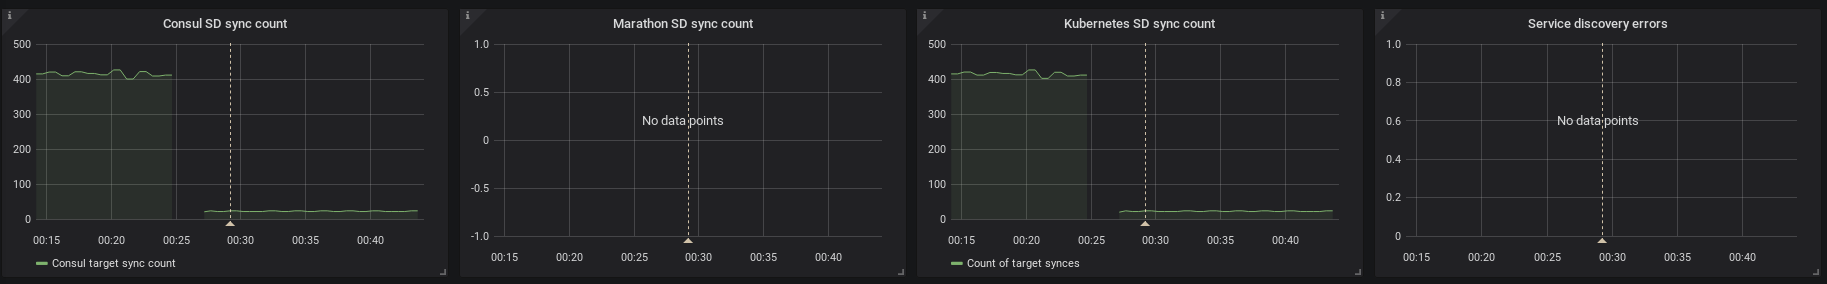
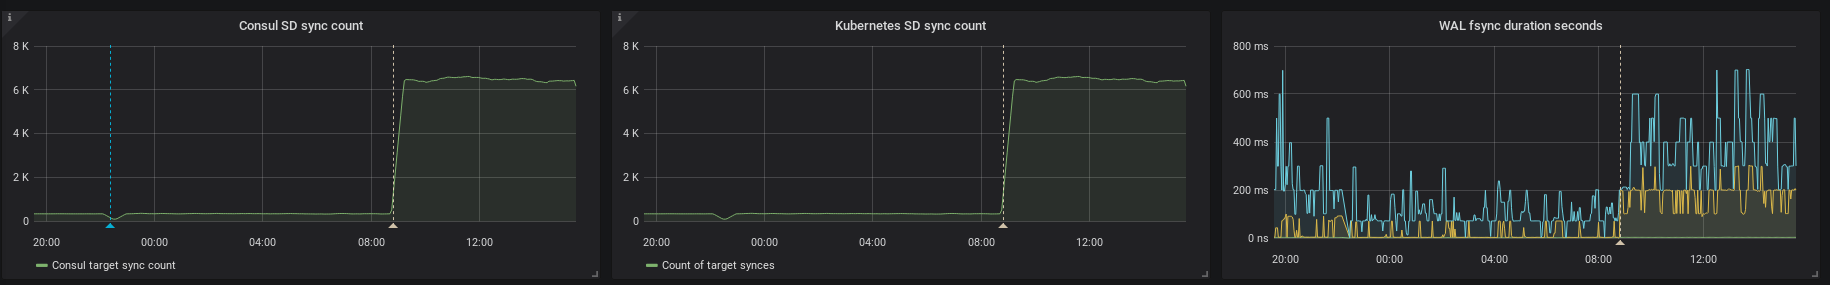
Actually SD went pretty crazy also after the update but I didnt consider it so important.
There is graph of the upgrade influence on SD
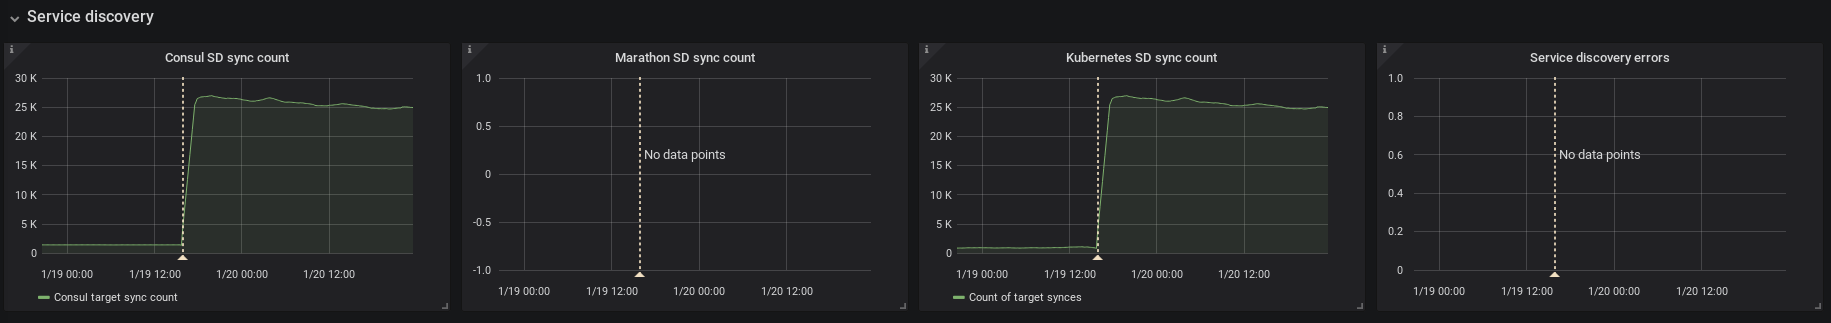
I'll test the PR asap
FUSAKLA
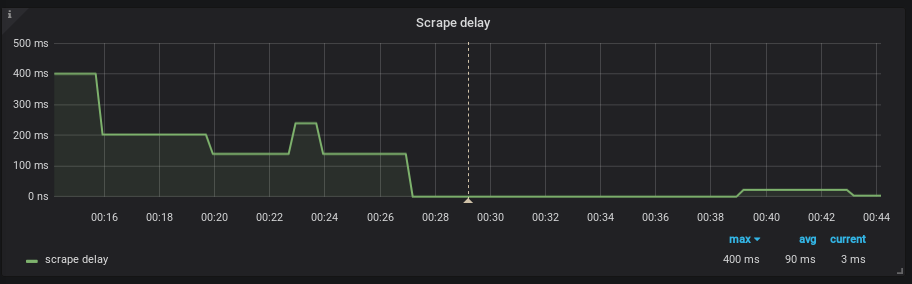
on 25 Jan 2018
seems that this was the main cause, when I did the refactoring I removed the throttling which caused the increased mem and cpu usage.
krasi-georgiev
on 26 Jan 2018
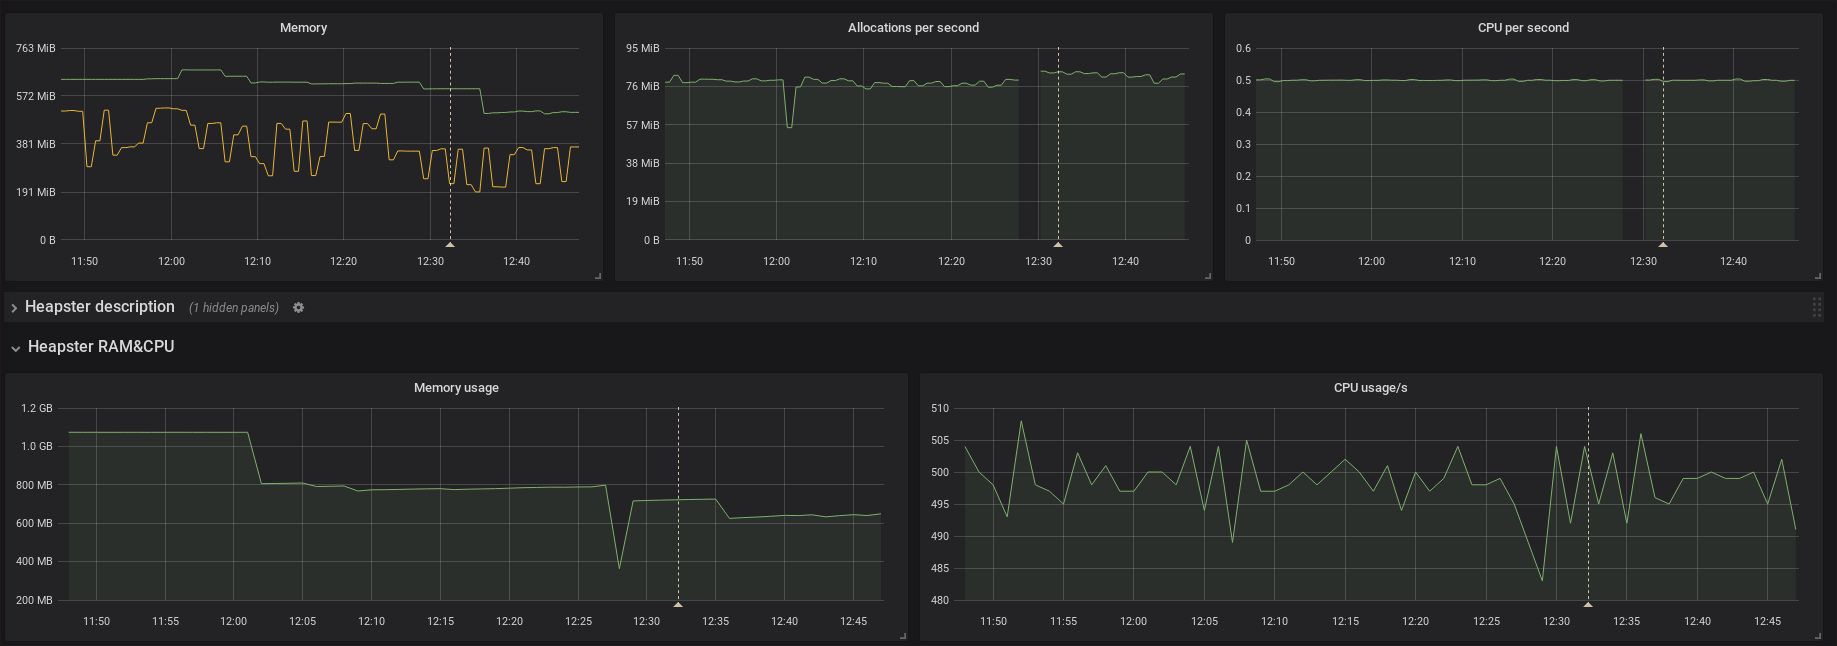
I'm testing it and it looks really promising.
In few minutes I'll post the results. Sorry for not posting the SD figures at the first time.
FUSAKLA
on 26 Jan 2018
I think this pretty much confirms it.
All values are back to 2.0.0 normal
prometheus, version 2.1.0 (branch: HEAD, revision: 3a8f87304adca830dfba46ae3ea0d7ce72e0d47c)
  build user:       fusakla@FUSAKLA
  build date:       20180125-23:09:18
  go version:       go1.9.2
even the federation is back to the previous values
Do you want pprof or any other data to verify this?
Thanks for the PR it looks promissing!
FUSAKLA
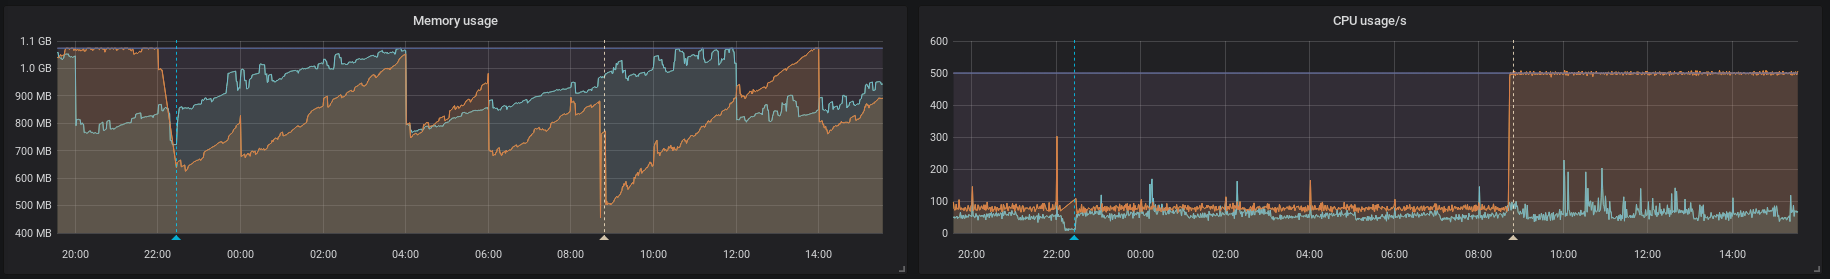
on 26 Jan 2018
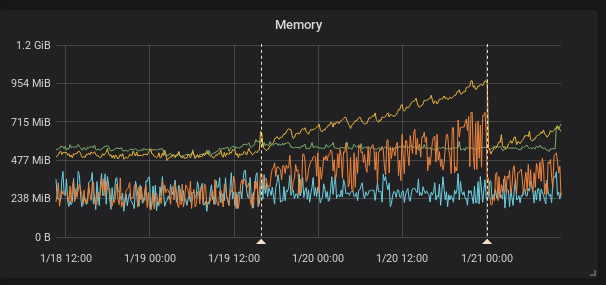
Do you think this PR will resolve (what I'm assuming is) a memory leak that appeared in 2.1 as well?
We've configured a midnight restart, hence the saw-tooth pattern.
paddynewman
on 26 Jan 2018
as far as i can tell from metrics probably not.. this figure shows impact on memory since 2.1.0 upgrade and the last annotation is upgrade to the mentioned PR and memory is still rising although the CPU and so on seems to be ok
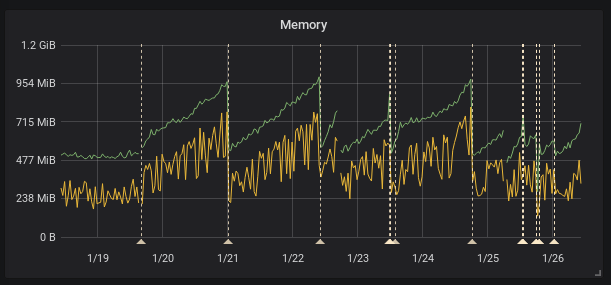
FUSAKLA
on 26 Jan 2018
Are you looking at memory allocated and exposed by the go runtime, or from the view of the operating system? If it's the latter then this looks like a pretty normal GC behavior (albeit still optimizable).
brancz
on 26 Jan 2018
this figure shows process_resident_memory_bytes and go_memstats_alloc_bytes. And data from cadvisor looks the same.
FUSAKLA
on 26 Jan 2018
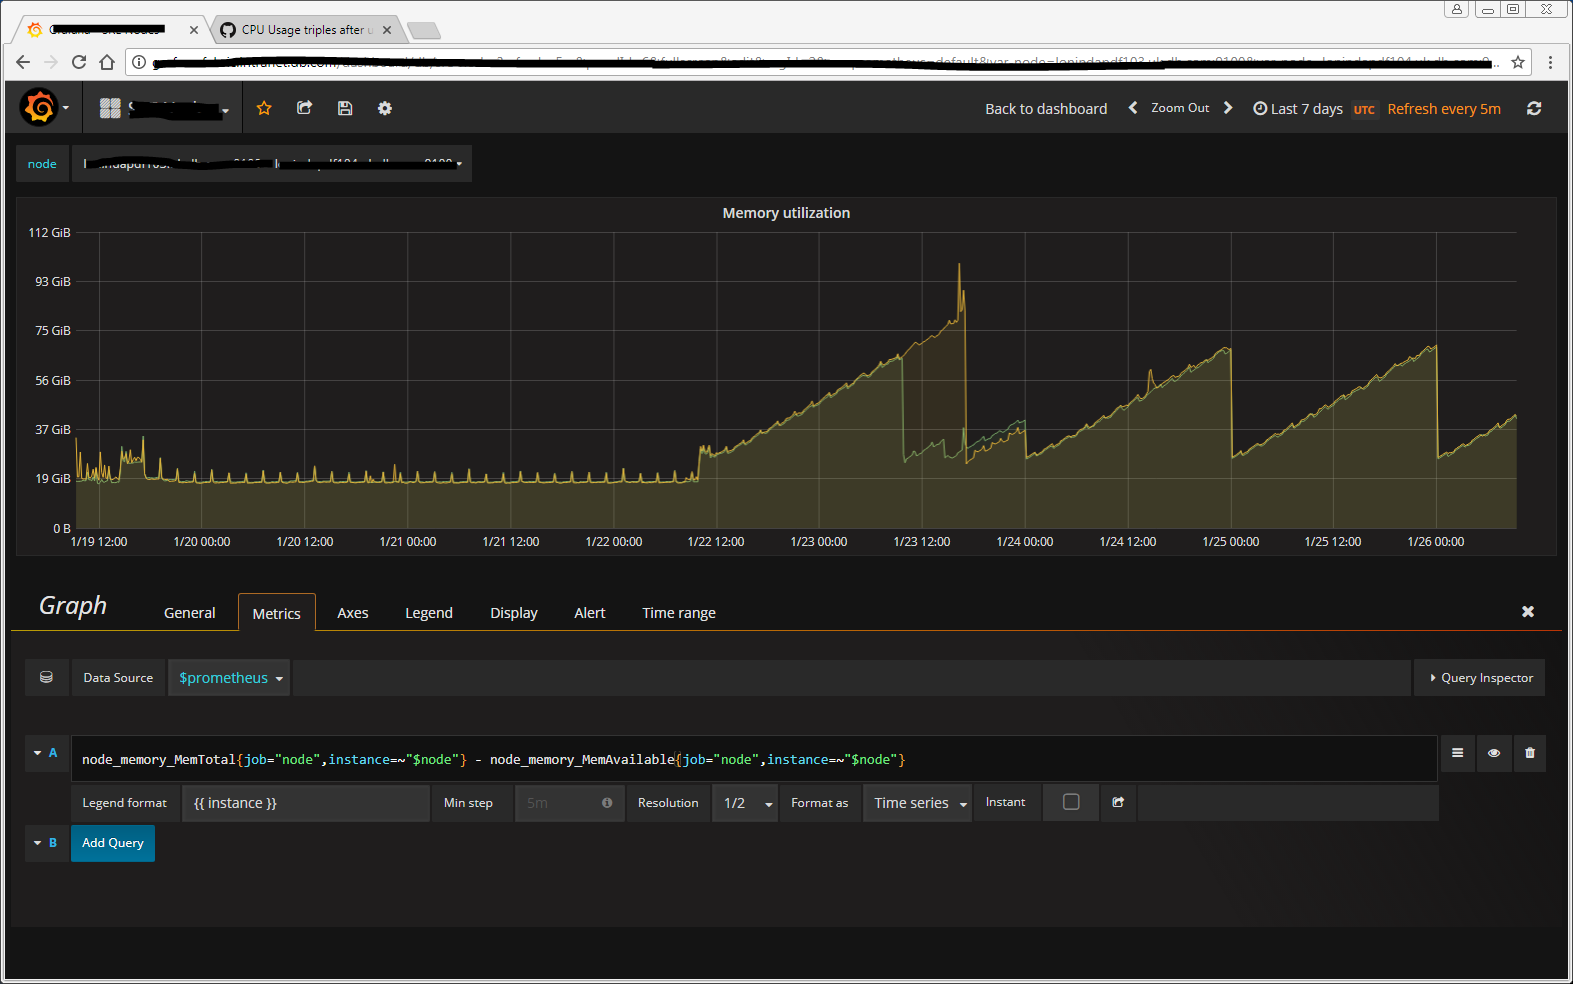
I'm fairly certain there's a memory leak. In my previous comment/graph I am showing the OS's view of memory but the consumption never goes down.
I have a midnight restart enabled via cron which is why you see the saw-tooth pattern and this was only required after upgrading from 2.0 to 2.1. Before that the cosumption was very stable at ~ 17.5GiB.
We're now reaching ~ 65GiB in a 24-hour period before our cron job restarts our instances.
paddynewman
on 26 Jan 2018
After another day of benchmarking we've come up with this: https://github.com/prometheus/prometheus/pull/3747
Please try it out and give us feedback! :slightly_smiling_face:
brancz
on 26 Jan 2018
Thank`s for the effort!
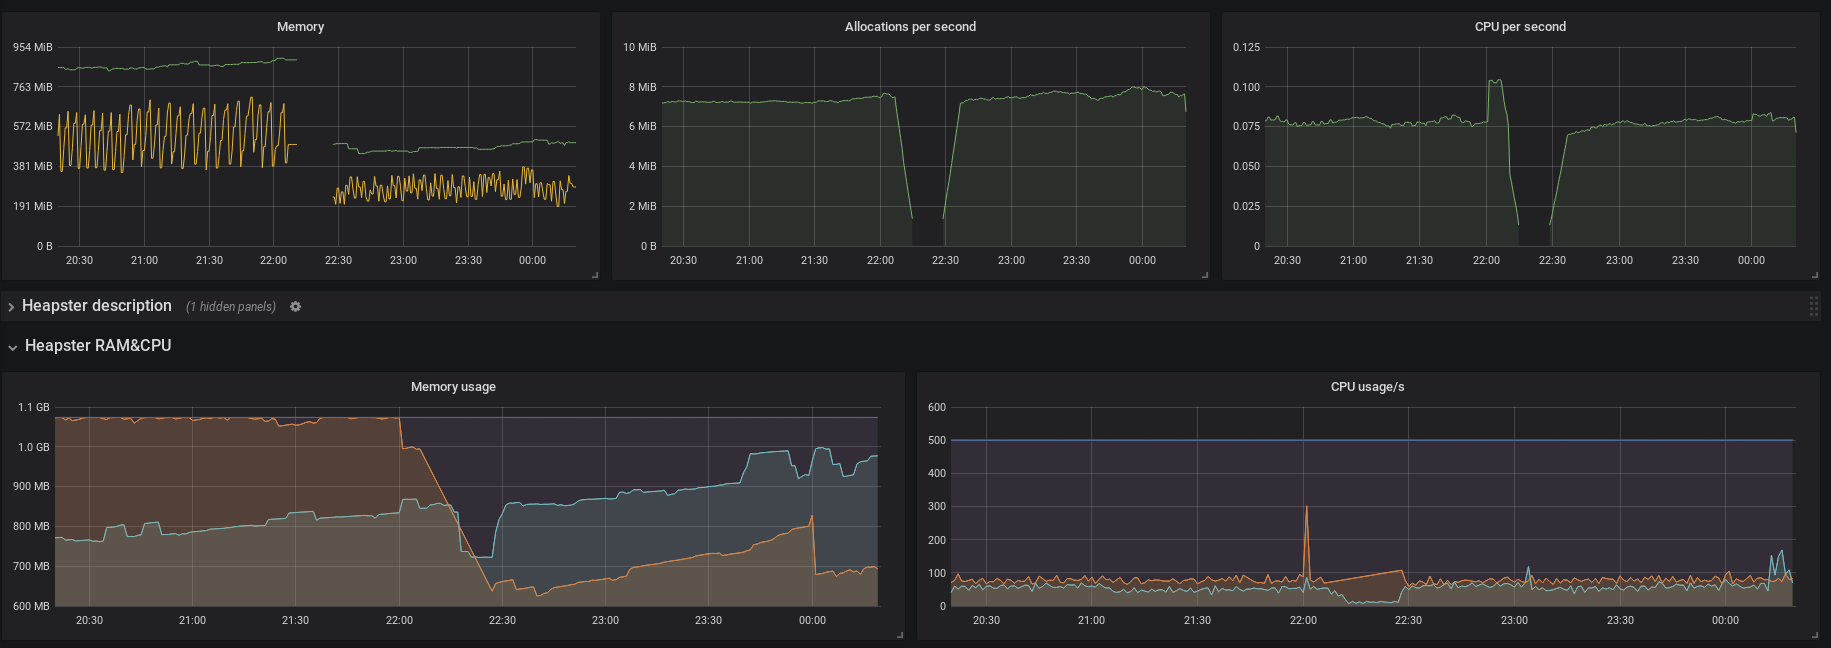
Unfortunately I left the previous PR version deployed so this is not compared to the official 2.1.0 release but to the proof of concept version in https://github.com/prometheus/prometheus/pull/3740
Tomorrow I'll switch to the official 2.1.0 and send those results.
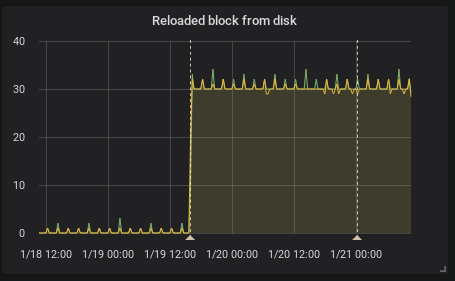
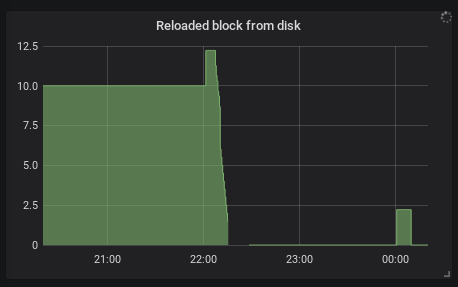
But again it looks good. Memory usage fell down and hopefully wont spike anymore
also reloading blocks from disk mentioned in https://github.com/prometheus/prometheus/issues/3725 fell to minimum
The rest like SD, federation and so on looks the same as in the previous fix
FUSAKLA
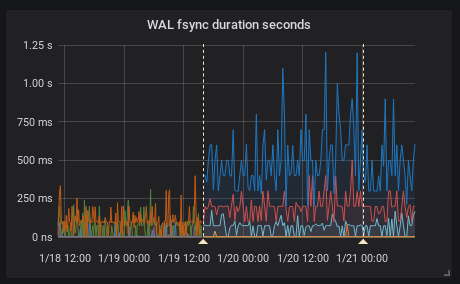
on 27 Jan 2018
So i have the results.. There are 3 versions in those figures:
(from left to right separated by annotations)
- The first PR already deleted
- This PR now requested to benchmark from branch
sched-update-throttle - official
2.1.0release
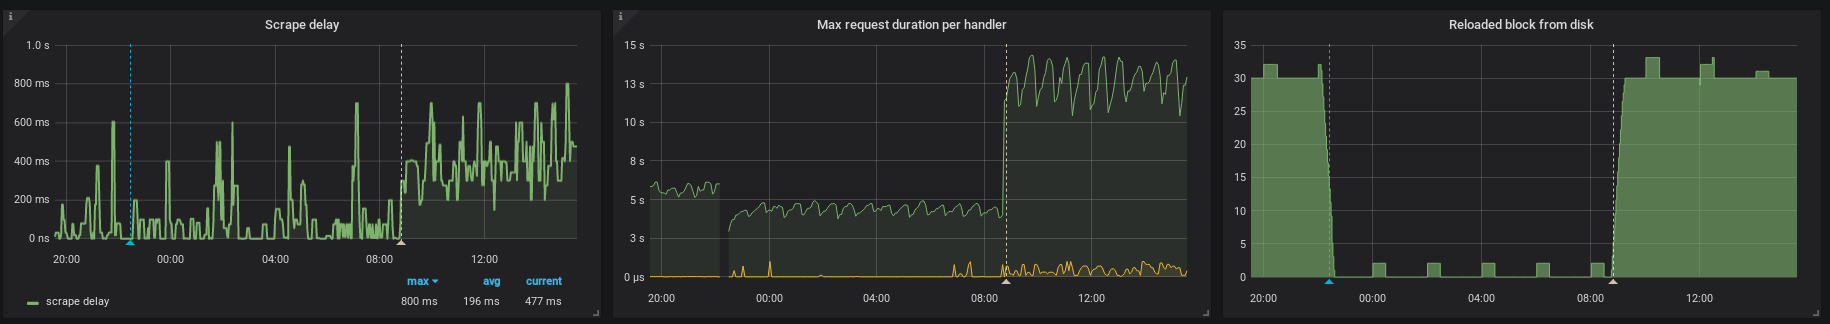
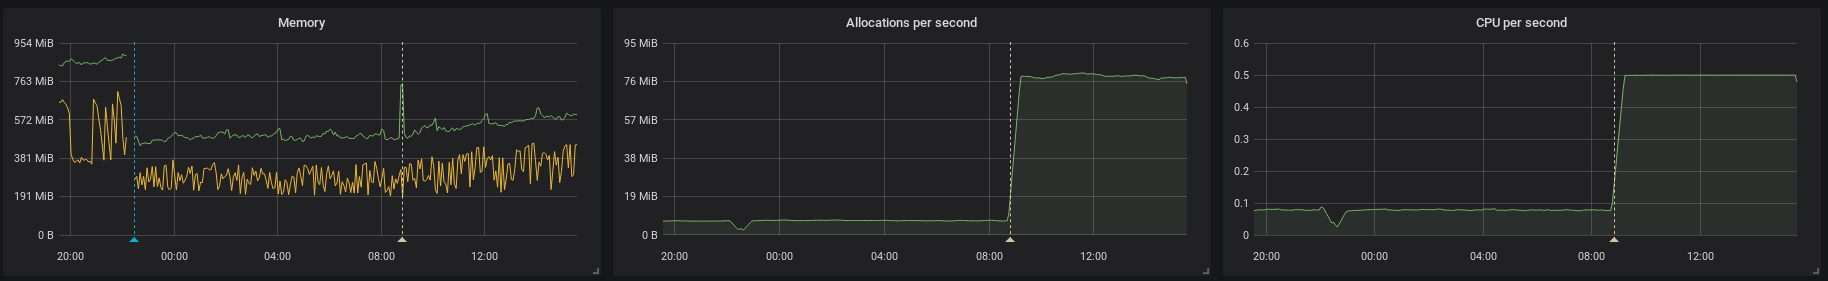
FUSAKLA
on 27 Jan 2018
Should be closed in #3747
gouthamve
on 1 Feb 2018
Guys! I dropped this bomb on went on vacation 😛 but was amazed to follow remotely how this was tackled and finally resolved.
One of the main reasons I love Prometheus so much is thanks to the incredible core team and community!!! ❤️
Can't wait for the next release with the fixes 👏 👏
dannyk81
on 1 Feb 2018
This thread has been automatically locked since there has not been any recent activity after it was closed. Please open a new issue for related bugs.
![lock[bot] picture](https://avatars1.githubusercontent.com/in/6672?v=4&s=40) lock[bot]
on 23 Mar 2019
lock[bot]
on 23 Mar 2019
Related issues
 martivo
·
52Comments
martivo
·
52Comments
 juliusv
·
112Comments
juliusv
·
112Comments
 hgranillo
·
59Comments
hgranillo
·
59Comments
 dopuskh3
·
71Comments
dopuskh3
·
71Comments
 bandesz
·
50Comments
bandesz
·
50Comments
Most helpful comment
Guys! I dropped this bomb on went on vacation 😛 but was amazed to follow remotely how this was tackled and finally resolved.
One of the main reasons I love Prometheus so much is thanks to the incredible core team and community!!! ❤️
Can't wait for the next release with the fixes 👏 👏