Prometheus: Prometheus 2.2.0 missing metrics after upgrade
What did you do?
- Upgraded Prometheus to 2.2.0 from 2.1.0. I have Prometheus running on a container.
What did you expect to see?
All metrics except the ones missing during container reload and start. No more than a few minutes.
What did you see instead? Under which circumstances?
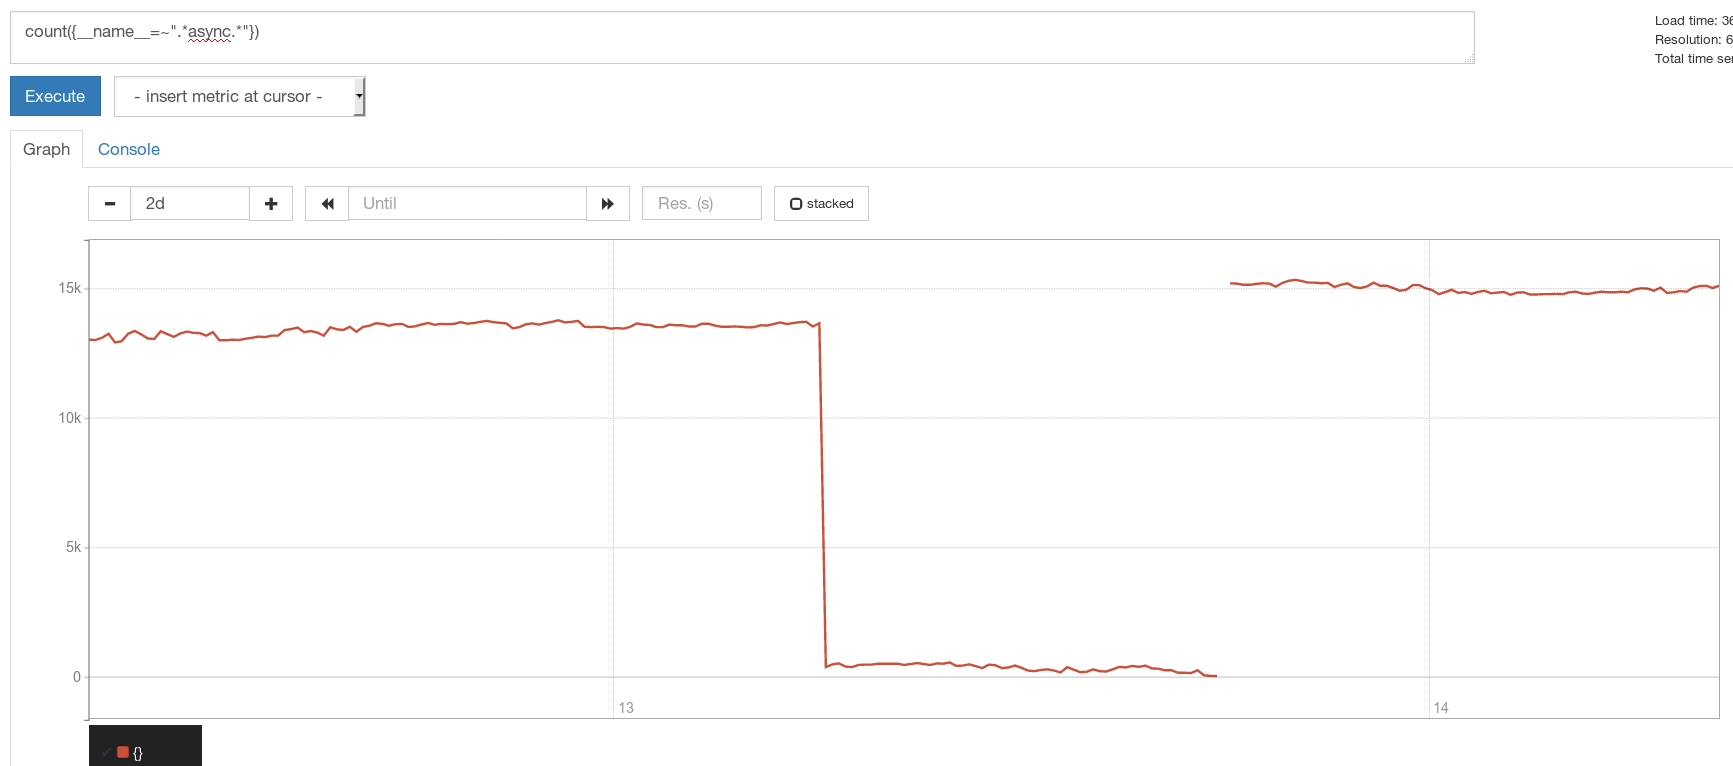
After I updated everything was running fine. New metrics were being collected and stored. A day after a gap of metrics went missing. A few hours ago I was able to see the now missing metrics. They were there and a second after they not.
The really weird thing here is that I have 4 Prometheus running and all 4 have the same issue, they were upgraded almost at the same time. Theres a long missing gap of metrics (all kind of metrics from different exporters) and no errors on logs.
These 4 Prometheus are running on separated environments on two different AWS regions.
Environment
- System information:
Linux 4.4.0-1050-aws x86_64
- Prometheus version:
prometheus, version 2.2.0 (branch: HEAD, revision: f63e7db4cbdb616337ca877b306b9b96f7f4e381)
  build user:       root@52af9f66ce71
  build date:       20180308-16:40:42
  go version:       go1.10
- Prometheus configuration file:
global:
  scrape_interval:     30s
  evaluation_interval: 30s

rule_files:
  - "/etc/prometheus-rules/*.yaml"
I cut the scrap rules here. I can include some of them.
- Logs:
➜  ~ oc logs prometheus-0
level=info ts=2018-03-08T19:58:19.858089342Z caller=main.go:220 msg="Starting Prometheus" version="(version=2.2.0, branch=HEAD, revision=f63e7db4cbdb616337ca877b306b9b96f7f4e381)"
level=info ts=2018-03-08T19:58:19.858143946Z caller=main.go:221 build_context="(go=go1.10, user=root@52af9f66ce71, date=20180308-16:40:42)"
level=info ts=2018-03-08T19:58:19.85817058Z caller=main.go:222 host_details="(Linux 4.4.0-1050-aws #59-Ubuntu SMP Tue Jan 30 19:57:10 UTC 2018 x86_64 prometheus-0 (none))"
level=info ts=2018-03-08T19:58:19.858192518Z caller=main.go:223 fd_limits="(soft=1048576, hard=1048576)"
level=info ts=2018-03-08T19:58:19.860731333Z caller=main.go:504 msg="Starting TSDB ..."
level=info ts=2018-03-08T19:58:19.860805283Z caller=web.go:382 component=web msg="Start listening for connections" address=0.0.0.0:9090
level=info ts=2018-03-08T19:58:19.861098766Z caller=repair.go:41 component=tsdb msg="fixing broken block" ulid=01C6BPGD3E1EH9N7XPAVWD3NSE
level=info ts=2018-03-08T19:59:25.431695736Z caller=repair.go:41 component=tsdb msg="fixing broken block" ulid=01C7ZP0PKNFRPMFKCSZ482VQ4C
level=info ts=2018-03-08T20:01:31.382327527Z caller=repair.go:41 component=tsdb msg="fixing broken block" ulid=01C81J69ME1Y5WSSAPERH4C94V
level=info ts=2018-03-08T20:01:43.390153611Z caller=repair.go:41 component=tsdb msg="fixing broken block" ulid=01C83FYTCPZS7KMSM2FR4A98V6
level=info ts=2018-03-08T20:04:04.520191875Z caller=main.go:514 msg="TSDB started"
level=info ts=2018-03-08T20:04:04.520258667Z caller=main.go:588 msg="Loading configuration file" filename=/etc/prometheus/prometheus.yml
level=info ts=2018-03-08T20:04:04.523593179Z caller=kubernetes.go:191 component="discovery manager scrape" discovery=k8s msg="Using pod service account via in-cluster config"
level=info ts=2018-03-08T20:04:04.525461109Z caller=kubernetes.go:191 component="discovery manager scrape" discovery=k8s msg="Using pod service account via in-cluster config"
level=info ts=2018-03-08T20:04:04.526788217Z caller=kubernetes.go:191 component="discovery manager scrape" discovery=k8s msg="Using pod service account via in-cluster config"
level=info ts=2018-03-08T20:04:04.527932416Z caller=kubernetes.go:191 component="discovery manager scrape" discovery=k8s msg="Using pod service account via in-cluster config"
level=info ts=2018-03-08T20:04:04.528997091Z caller=kubernetes.go:191 component="discovery manager scrape" discovery=k8s msg="Using pod service account via in-cluster config"
level=info ts=2018-03-08T20:04:04.530311675Z caller=kubernetes.go:191 component="discovery manager scrape" discovery=k8s msg="Using pod service account via in-cluster config"
level=info ts=2018-03-08T20:04:04.535204808Z caller=main.go:491 msg="Server is ready to receive web requests."
level=info ts=2018-03-08T21:00:00.34165268Z caller=compact.go:394 component=tsdb msg="compact blocks" count=1 mint=1520532000000 maxt=1520539200000
level=info ts=2018-03-08T21:01:52.439372087Z caller=head.go:348 component=tsdb msg="head GC completed" duration=8.816932002s
level=info ts=2018-03-08T21:02:44.010010328Z caller=head.go:357 component=tsdb msg="WAL truncation completed" duration=51.570547607s
level=info ts=2018-03-08T23:00:00.347972278Z caller=compact.go:394 component=tsdb msg="compact blocks" count=1 mint=1520539200000 maxt=1520546400000
level=info ts=2018-03-08T23:01:32.876783605Z caller=head.go:348 component=tsdb msg="head GC completed" duration=6.039842235s
level=info ts=2018-03-08T23:02:32.551701808Z caller=head.go:357 component=tsdb msg="WAL truncation completed" duration=59.674864681s
level=info ts=2018-03-09T01:00:00.388711357Z caller=compact.go:394 component=tsdb msg="compact blocks" count=1 mint=1520546400000 maxt=1520553600000
level=info ts=2018-03-09T01:00:59.131562889Z caller=head.go:348 component=tsdb msg="head GC completed" duration=2.507758629s
level=info ts=2018-03-09T01:01:18.039357855Z caller=head.go:357 component=tsdb msg="WAL truncation completed" duration=18.907736139s
level=info ts=2018-03-09T03:00:00.380318607Z caller=compact.go:394 component=tsdb msg="compact blocks" count=1 mint=1520553600000 maxt=1520560800000
level=info ts=2018-03-09T03:00:58.488065341Z caller=head.go:348 component=tsdb msg="head GC completed" duration=2.314473094s
level=info ts=2018-03-09T03:01:13.31888004Z caller=head.go:357 component=tsdb msg="WAL truncation completed" duration=14.830755016s
level=info ts=2018-03-09T03:01:18.881154001Z caller=compact.go:394 component=tsdb msg="compact blocks" count=3 mint=1520532000000 maxt=1520553600000
level=info ts=2018-03-09T05:00:00.388120222Z caller=compact.go:394 component=tsdb msg="compact blocks" count=1 mint=1520560800000 maxt=1520568000000
level=info ts=2018-03-09T05:00:57.704584177Z caller=head.go:348 component=tsdb msg="head GC completed" duration=2.51049056s
level=info ts=2018-03-09T05:01:12.057612041Z caller=head.go:357 component=tsdb msg="WAL truncation completed" duration=14.352969524s
level=info ts=2018-03-09T07:00:00.387250785Z caller=compact.go:394 component=tsdb msg="compact blocks" count=1 mint=1520568000000 maxt=1520575200000
level=info ts=2018-03-09T07:00:58.776859178Z caller=head.go:348 component=tsdb msg="head GC completed" duration=2.339181202s
level=info ts=2018-03-09T07:01:13.64668469Z caller=head.go:357 component=tsdb msg="WAL truncation completed" duration=14.869760955s
level=info ts=2018-03-09T09:00:00.398864782Z caller=compact.go:394 component=tsdb msg="compact blocks" count=1 mint=1520575200000 maxt=1520582400000
level=info ts=2018-03-09T09:00:58.889449072Z caller=head.go:348 component=tsdb msg="head GC completed" duration=2.79196883s
level=info ts=2018-03-09T09:01:13.508749265Z caller=head.go:357 component=tsdb msg="WAL truncation completed" duration=14.619235883s
level=info ts=2018-03-09T09:01:18.898146261Z caller=compact.go:394 component=tsdb msg="compact blocks" count=3 mint=1520553600000 maxt=1520575200000
level=info ts=2018-03-09T11:00:00.387036989Z caller=compact.go:394 component=tsdb msg="compact blocks" count=1 mint=1520582400000 maxt=1520589600000
level=info ts=2018-03-09T11:00:57.685609508Z caller=head.go:348 component=tsdb msg="head GC completed" duration=2.371068823s
level=info ts=2018-03-09T11:01:12.734211593Z caller=head.go:357 component=tsdb msg="WAL truncation completed" duration=15.048545238s
level=info ts=2018-03-09T13:00:00.389210695Z caller=compact.go:394 component=tsdb msg="compact blocks" count=1 mint=1520589600000 maxt=1520596800000
level=info ts=2018-03-09T13:00:58.341825994Z caller=head.go:348 component=tsdb msg="head GC completed" duration=2.466301791s
level=info ts=2018-03-09T13:01:13.191514211Z caller=head.go:357 component=tsdb msg="WAL truncation completed" duration=14.849637465s
level=info ts=2018-03-09T15:00:00.373007915Z caller=compact.go:394 component=tsdb msg="compact blocks" count=1 mint=1520596800000 maxt=1520604000000
level=info ts=2018-03-09T15:01:30.790025421Z caller=head.go:348 component=tsdb msg="head GC completed" duration=4.111489989s
level=info ts=2018-03-09T15:02:04.571961721Z caller=head.go:357 component=tsdb msg="WAL truncation completed" duration=33.7818842s
level=info ts=2018-03-09T15:02:18.425767053Z caller=compact.go:394 component=tsdb msg="compact blocks" count=3 mint=1520575200000 maxt=1520596800000
level=info ts=2018-03-09T15:03:30.118738573Z caller=compact.go:394 component=tsdb msg="compact blocks" count=2 mint=1520532000000 maxt=1520575200000
level=info ts=2018-03-09T15:05:31.944625635Z caller=compact.go:394 component=tsdb msg="compact blocks" count=3 mint=1520402400000 maxt=1520596800000
level=info ts=2018-03-09T17:00:00.347731895Z caller=compact.go:394 component=tsdb msg="compact blocks" count=1 mint=1520604000000 maxt=1520611200000
level=info ts=2018-03-09T17:01:35.110319556Z caller=head.go:348 component=tsdb msg="head GC completed" duration=6.699952835s
level=info ts=2018-03-09T17:02:46.732035127Z caller=head.go:357 component=tsdb msg="WAL truncation completed" duration=1m11.62087854s
level=info ts=2018-03-09T17:02:51.604621507Z caller=compact.go:394 component=tsdb msg="compact blocks" count=2 mint=1520402400000 maxt=1520575200000
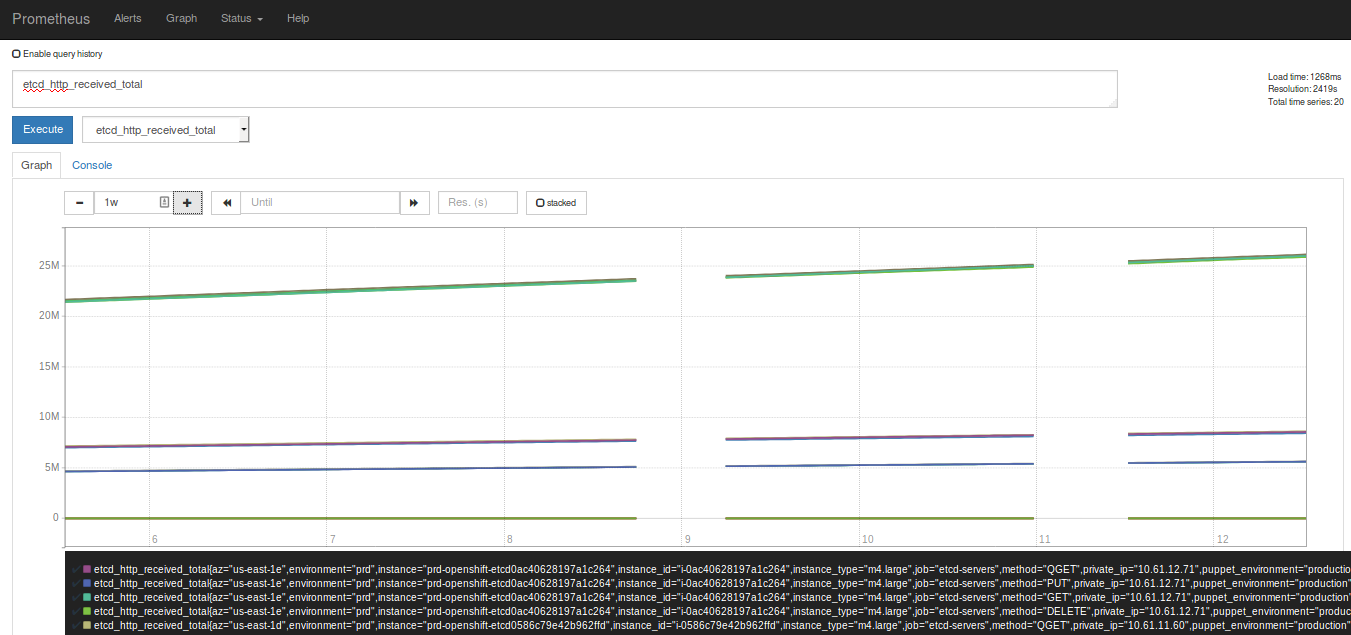
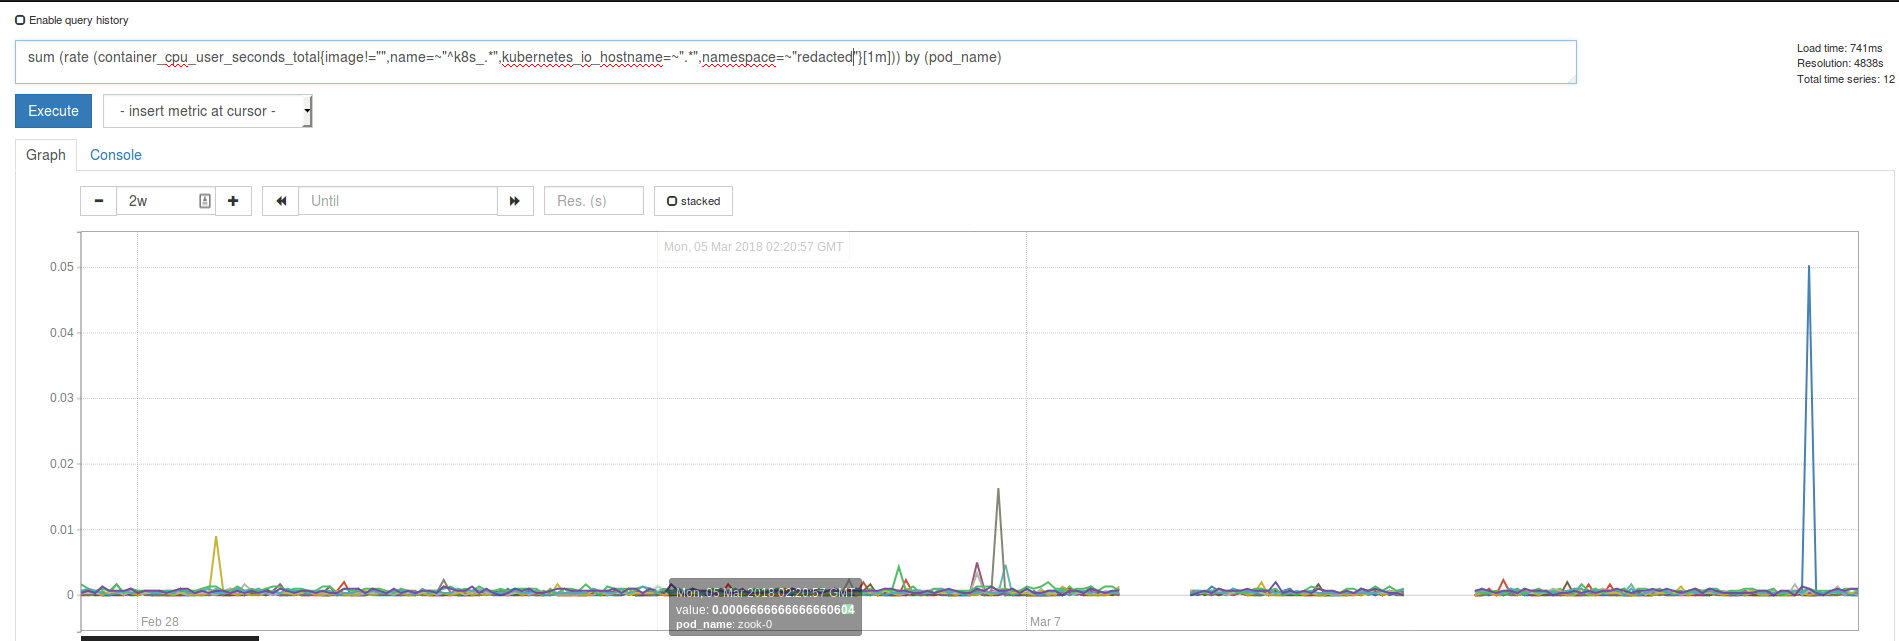
Production Ireland
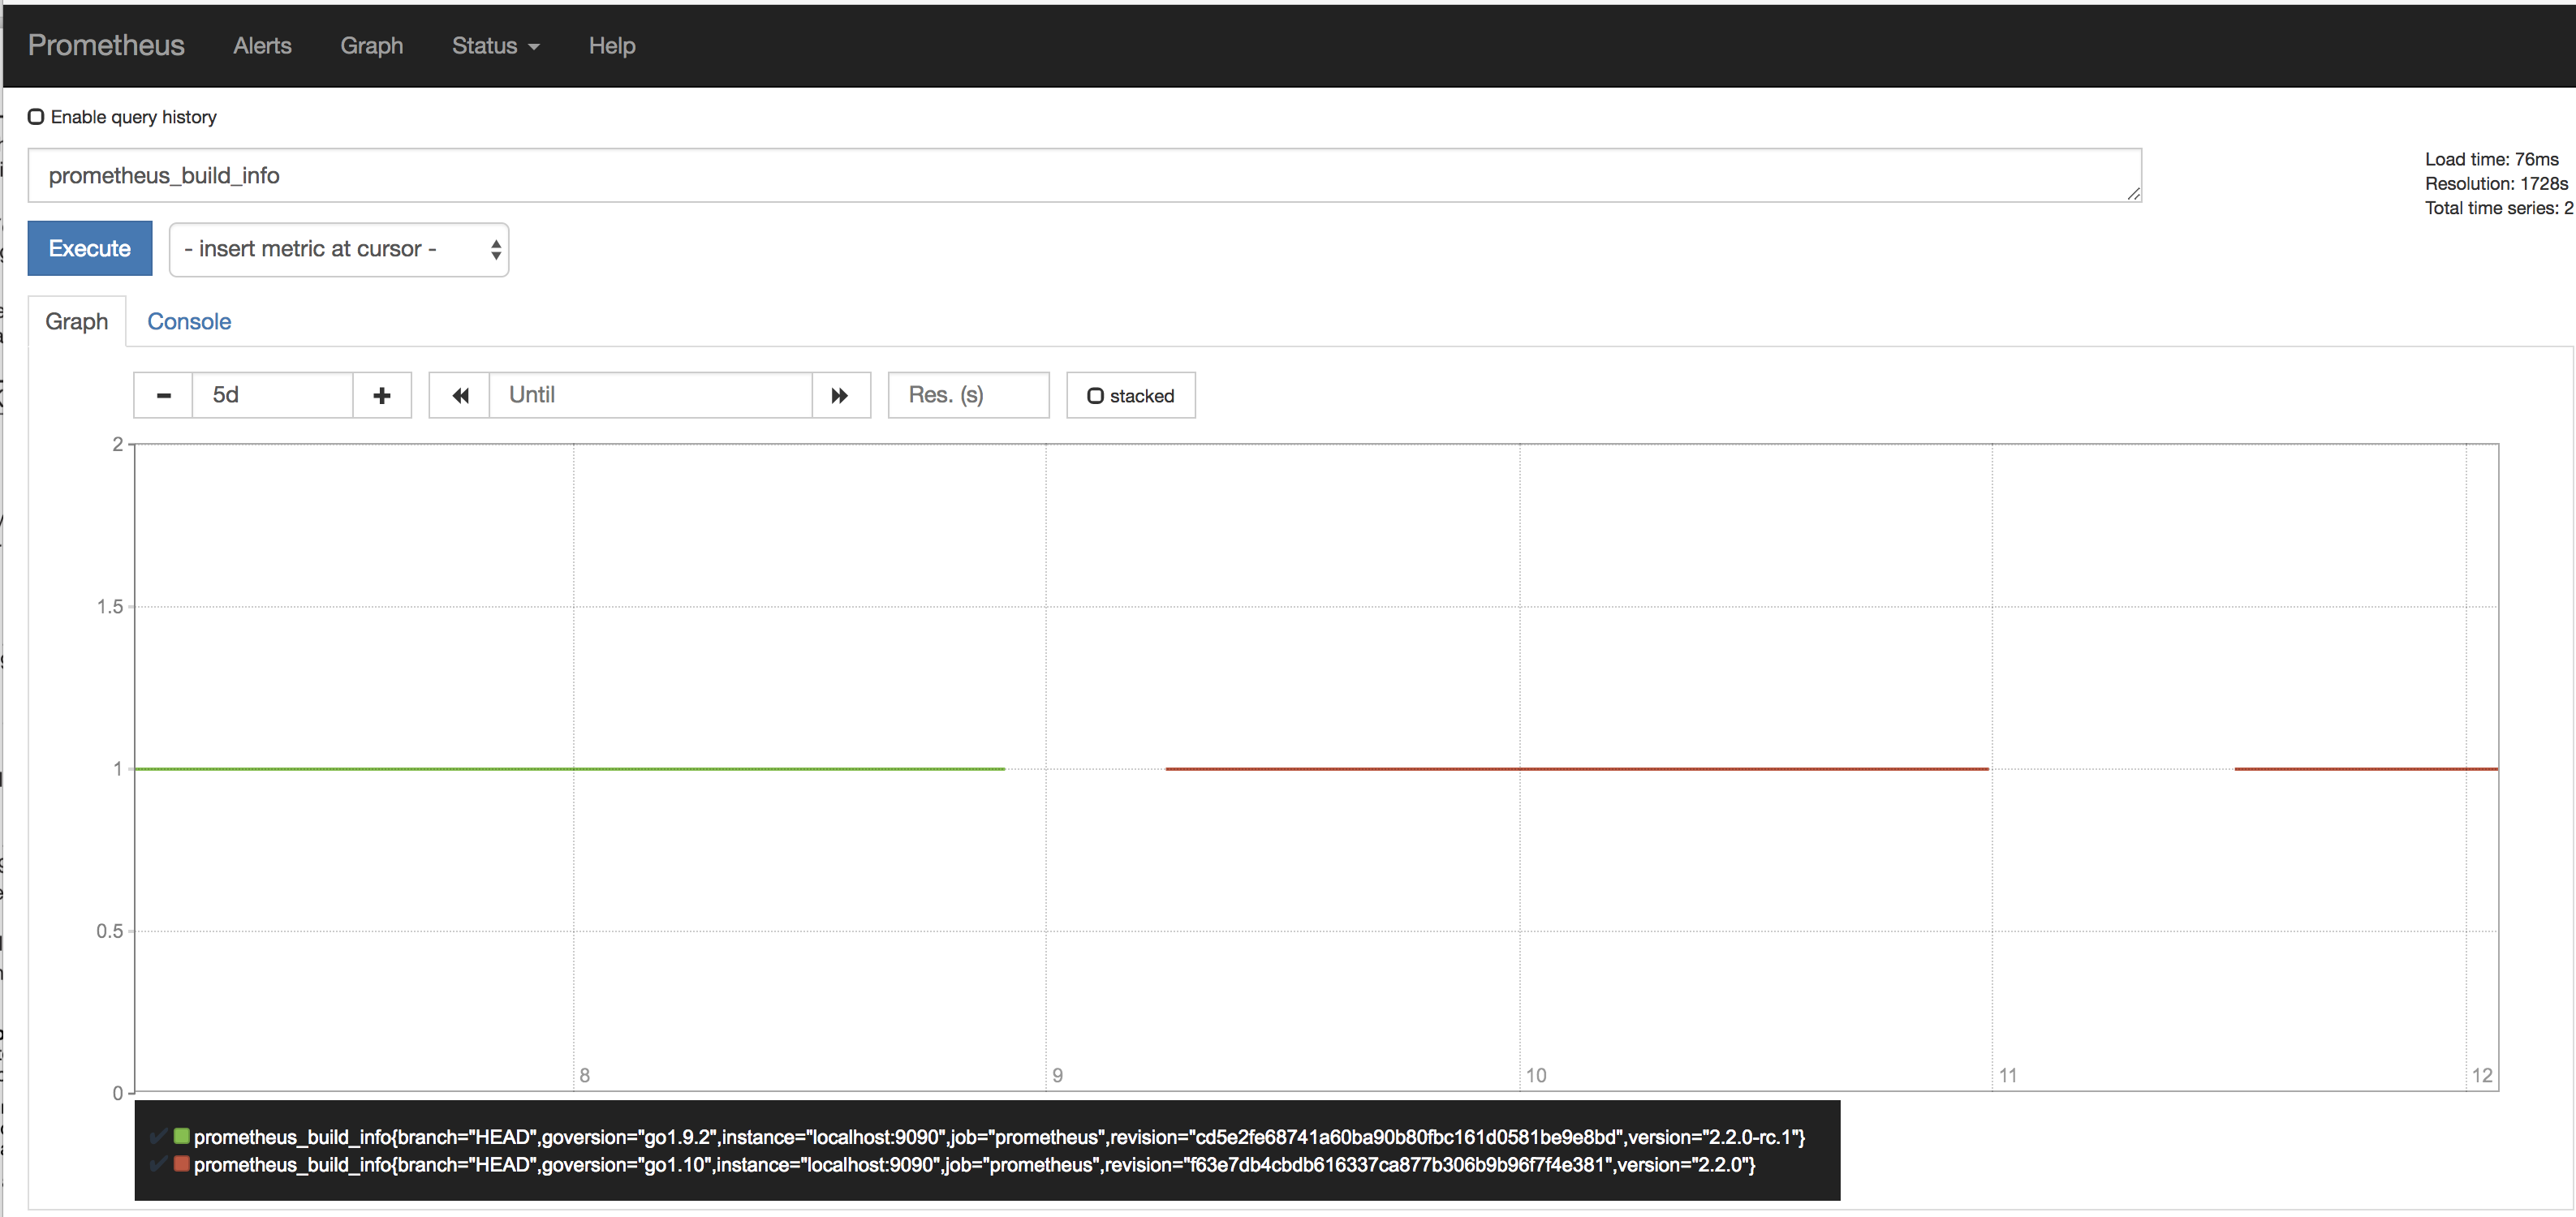
The last metric of 2.1.0 is the green one and ends when I upgraded Prometheus (19:58). On the logs you can see that the cointainer started at 19:58:19


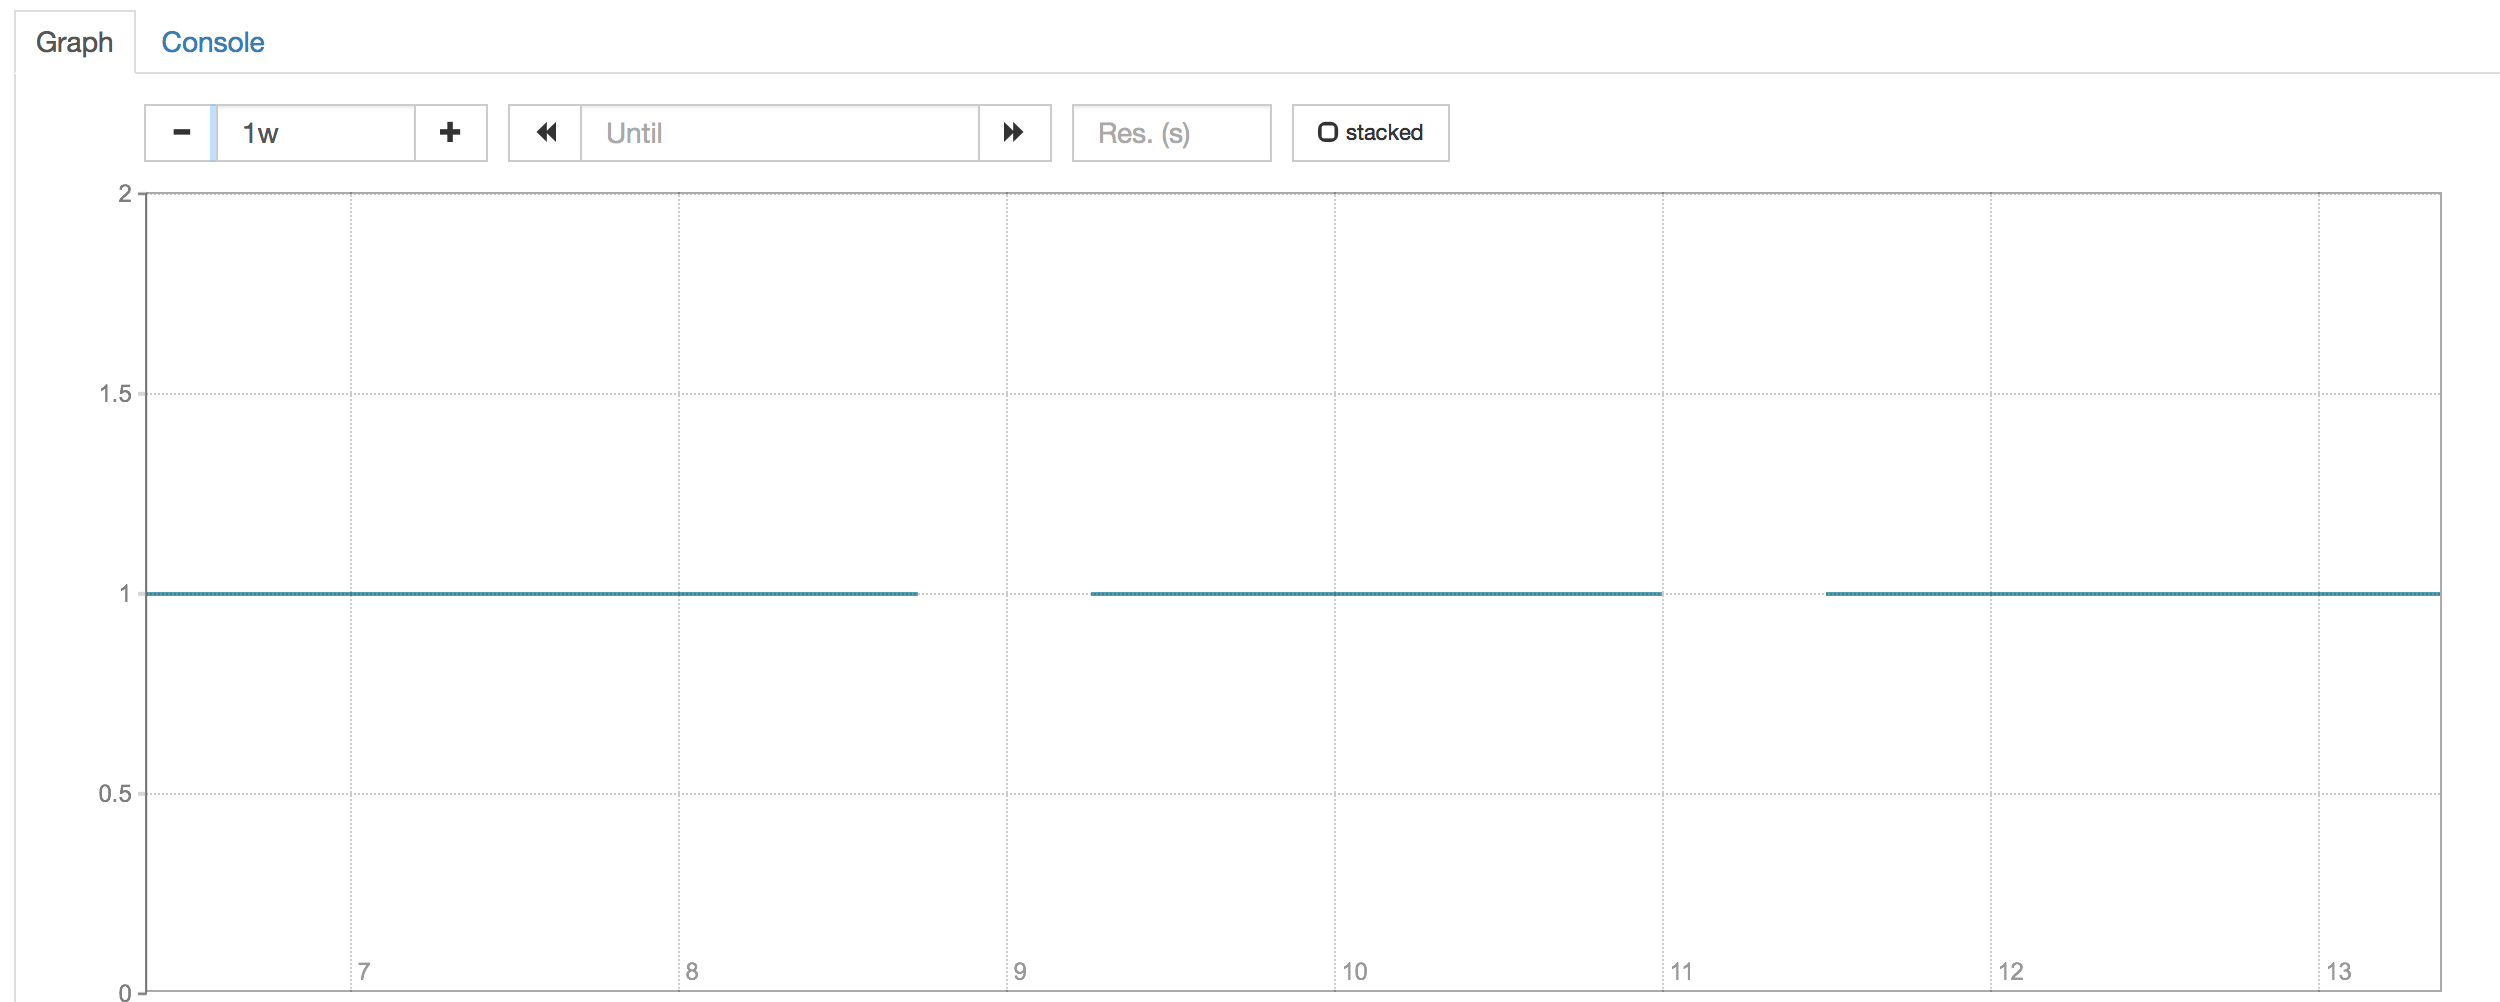
Staging Virginia
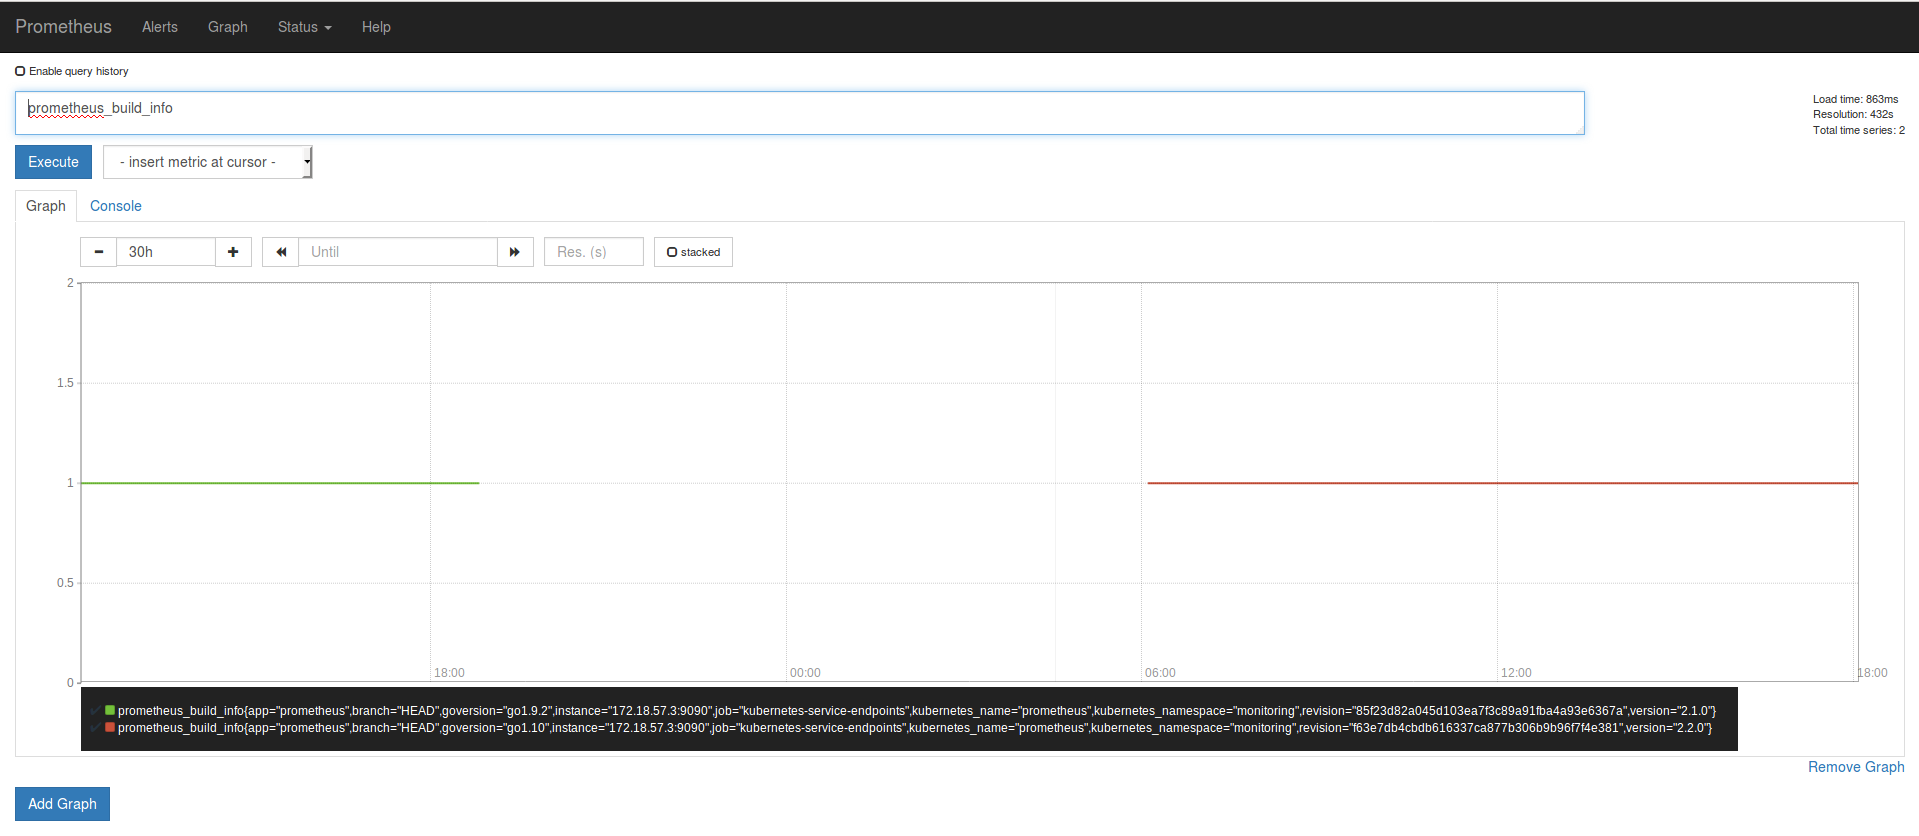
Prometheus Dashboard Production Ireland

I know this look really sketchy. But I didnt had restart or network error on the environments that run Prometheus. Thats why I choose a Prometheus metric as a example but all metrics where affected.
 hgranillo
All 59 comments
I'm seeing a similar issue; updated to 2.2 at 2018-03-08 22:02:17 UTC - there's a big hole in my metrics until about 8 hours later. Fortunately, this is just a pilot, but concerning nonetheless. Nothing stands out in the logs other than, perhaps:
Mar 8 22:02:19 xxx prometheus: level=warn ts=2018-03-08T22:02:19.54858458Z caller=head.go:320 component=tsdb msg="unknown series references in WAL samples" count=7
right after the upgrade
 britcey
on 9 Mar 2018
britcey
on 9 Mar 2018
@fabxc
 brian-brazil
on 10 Mar 2018
brian-brazil
on 10 Mar 2018
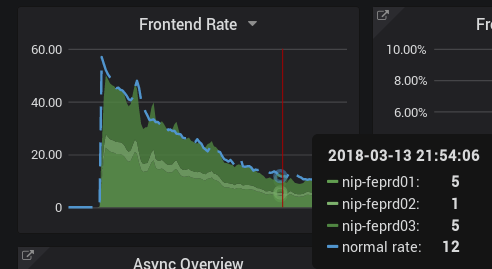
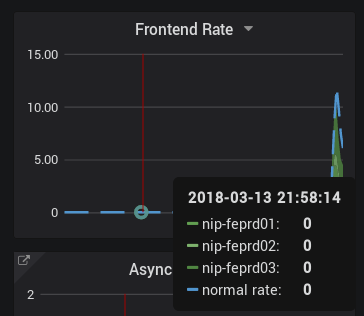
Ooof - just happened again - not a one-off upgrade bug, lost another 12 hours of metrics:
britcey
on 12 Mar 2018
@britcey can you share the meta.json files and size of your index files in the storage dir? You are only experiencing data loss of some metrics right?
Could your verify whether this happens to metrics in lexicographic order? For example, all metrics starting with a to s are there but anything starting with t to z is lost
Could you set the --storage.tsdb.max-block-duration=6h flag and see whether this at least prevents this from happening again until we found the issue.
@hgranillo same thing would probably apply to you as well.
 fabxc
on 12 Mar 2018
fabxc
on 12 Mar 2018
I have the same issue here. I didn't check all series, but can't find one that does not suffer the data loss.
At start, I have the same warning:
caller=head.go:320 component=tsdb msg="unknown series references in WAL samples" count=10174
I attach a list of all my index dir with the corresponding meta.json
 Jean-Daniel
on 12 Mar 2018
Jean-Daniel
on 12 Mar 2018
@Jean-Daniel is this an upgrade or a fresh 2.2 Prometheus installation?
 krasi-georgiev
on 12 Mar 2018
krasi-georgiev
on 12 Mar 2018
can you share some more configs. it might help replicate it.
krasi-georgiev
on 12 Mar 2018
@fabxc It seems to affect all metrics.
Heres the prometheus_metas2.txt and the index sizes prometheus_sizes.txt
I also se a few .tmp dir in one on my Prometheus. Are these safe to delete?
Heres a few metrics from A to Z
I have a second gap now, similar to @britcey
The duration is also ~12hs
hgranillo
on 12 Mar 2018
Metafile info attached; it appears to be all metrics that are missing data. I'll set storage.tsdb.max-block-duration shortly.
Not sure if it's a coincidence, but there was a restart of prometheus sometime before the second data loss - not sure if the other folks were running continuously or not.
britcey
on 12 Mar 2018
One thing I see is that we all loss data at the same time.
Jean-Daniel
on 13 Mar 2018
@Jean-Daniel The suspicion is that you all upgraded to 2.2.0 in similar time (within couple of hours) - that's (maybe) why same time loss might happen more likely
 bwplotka
on 13 Mar 2018
bwplotka
on 13 Mar 2018
This logs are worrying:
level=info ts=2018-03-09T15:05:31.944625635Z caller=compact.go:394 component=tsdb msg="compact blocks" count=3 mint=1520402400000 maxt=1520596800000
and couple of logs after:
level=info ts=2018-03-09T17:02:51.604621507Z caller=compact.go:394 component=tsdb msg="compact blocks" count=2 mint=1520402400000 maxt=1520575200000
Compaction somehow reduced a block O.o
bwplotka
on 13 Mar 2018
Ok, we found bug & root cause. No block was deleted - just compaction wrongly ignores some blocks in certain cases. The ignored block (12h) is most likely laying around, but no one is using it.
Debugging repro: https://github.com/prometheus/tsdb/pull/298
Fix in progress.
EDIT: Fix in review https://github.com/prometheus/tsdb/pull/299
bwplotka
on 13 Mar 2018
BTW In theory we can still repair the wrong blocks and recover these metrics. That will need some extra work, but it might be possible.
EDIT: That might be incorrect actually ):
bwplotka
on 13 Mar 2018
The question is if that should be carried in prometheus or promtool.
 RichiH
on 13 Mar 2018
RichiH
on 13 Mar 2018
@RichiH ...and if it's necessary. Depends on impact.
bwplotka
on 13 Mar 2018
Impact will be hard to measure; one would hope that any organizations that _depend_ on data in the longer would be more conservative in running .0 releases; I know we are.
If it's done, it probably makes more sense to put the functionality in promtool. Otherwise, it becomes a game of "when can we drop this again".
RichiH
on 13 Mar 2018
If it matters - mine's just a pilot setup, I don't need the data recovered (just a nice-to-have)
britcey
on 13 Mar 2018
@Bplotka, are you gonna make 2.2.1 release with that?
 trnl
on 13 Mar 2018
trnl
on 13 Mar 2018
As it would be nice to recover these metrics is not that critical. At least for me.
hgranillo
on 13 Mar 2018
That's good, because on second glance by looking on @hgranillo meta files you gave me this "ignored" block might be actually dropped. ): So, I am no longer sure if this missing block is actually recoverable.
bwplotka
on 13 Mar 2018
@trnl yes as far as I know, after my fix will land.
bwplotka
on 13 Mar 2018
@Bplotka, are you gonna make 2.2.1 release with that?
Same question here. Will it be included in 2.2.1? If yes, do you have any estimated date?
 n0guest
on 13 Mar 2018
n0guest
on 13 Mar 2018
the release will include this fix and it should be ready tomorrow
here is the PR for the cut https://github.com/prometheus/prometheus/pull/3952
krasi-georgiev
on 13 Mar 2018
So what's the final word on recovering the missing blocks?
 mheggeseth
on 13 Mar 2018
mheggeseth
on 13 Mar 2018
It looks like, problem also includes random symptoms of "eating" RAM and disk space. Within less than 3 hours 2 empty "testing" instances and 1 "production" instance (which was monitoring real objects) grow up from 200Mb up to ~2Gb of RAM each and eat ~600Gb of disk space in total (usually 3-4Gb is normal for such instances).
Does anyone faced the same behaviour?
PS: And this isn't a first time, because it already happened before with the same symptops. But before this moment, I thought it was a random bug and just wiped datadir. Now, i guess it's a consequences of the same bug we're discussing right here.
n0guest
on 14 Mar 2018
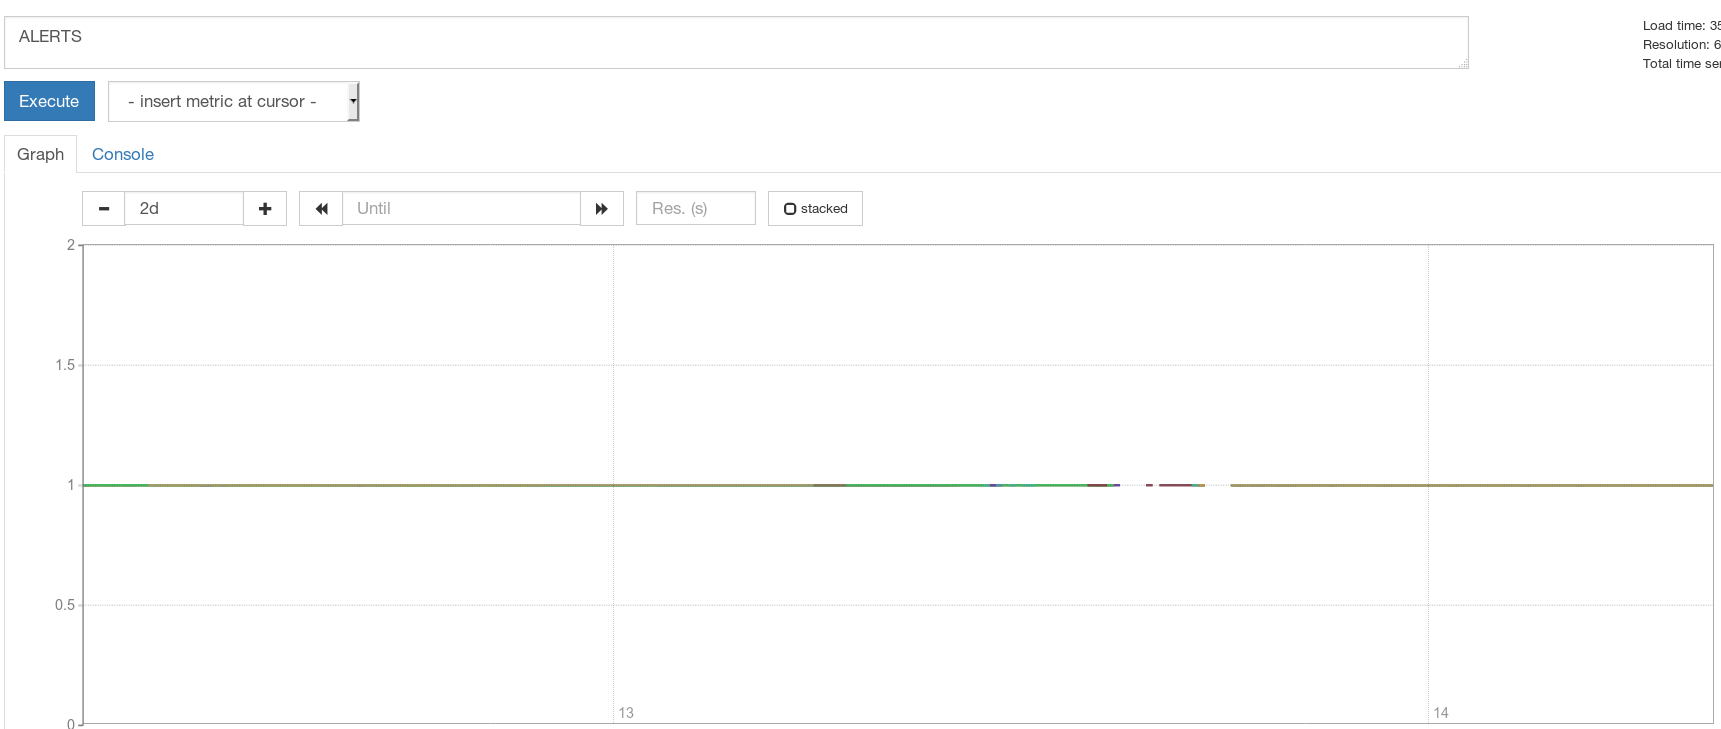
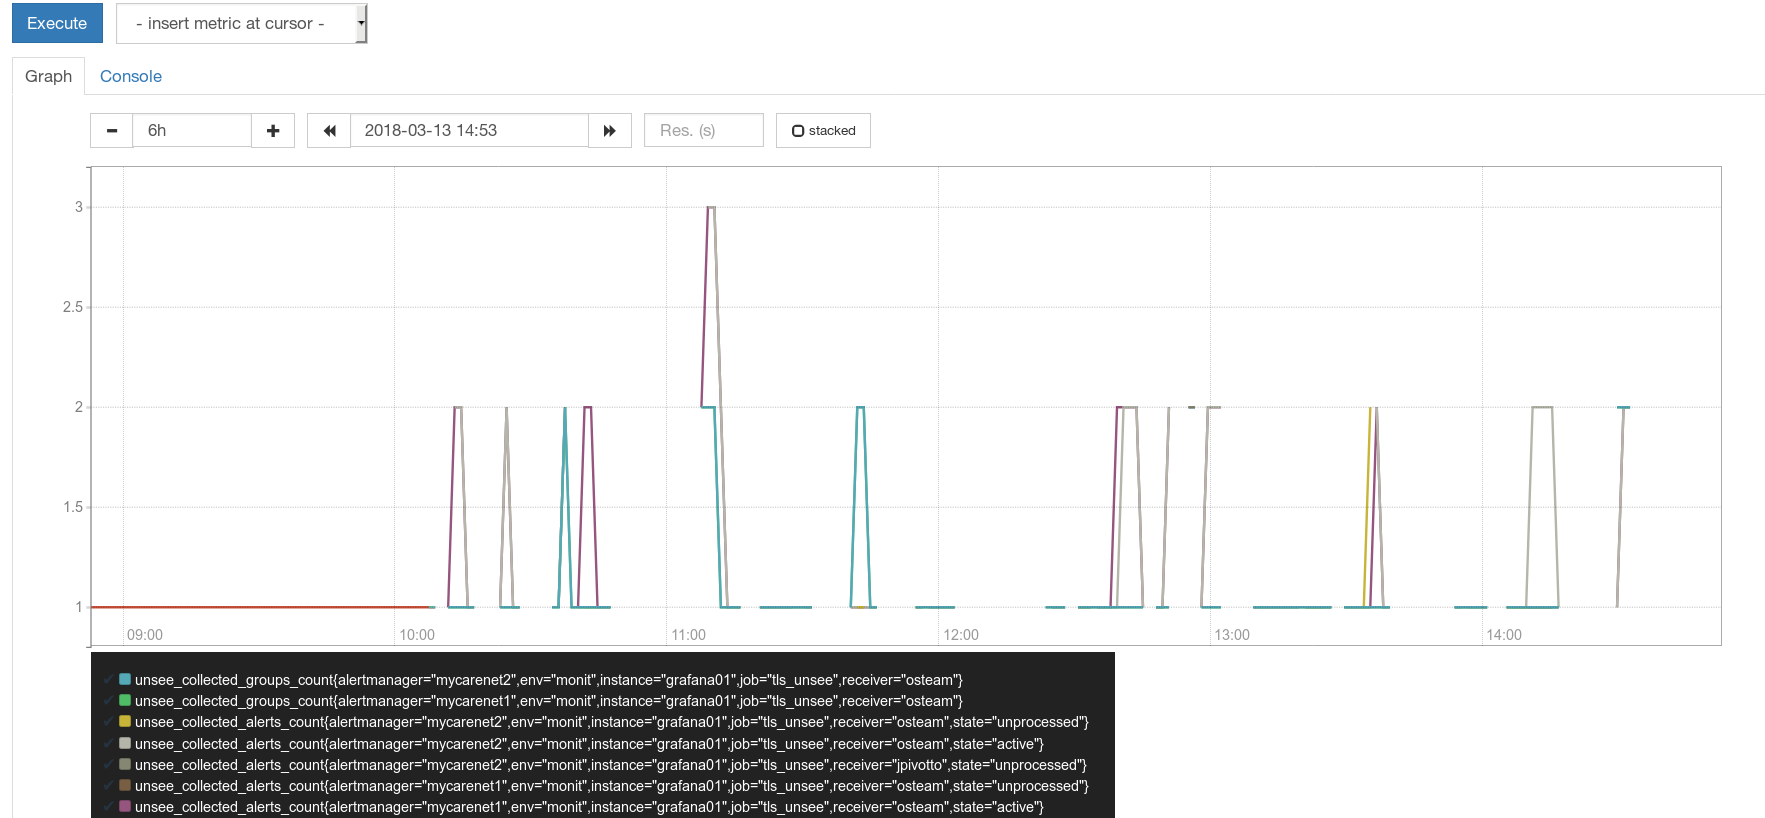
What I do not understand is why we lose only SOME metrics....
 roidelapluie
on 14 Mar 2018
roidelapluie
on 14 Mar 2018
Interesting @roidelapluie Others claimed that all metrics are missing. Can you show any other metric than ALERTS?
bwplotka
on 14 Mar 2018
roidelapluie
on 14 Mar 2018
Yea, so these all weirdnesses can potentially happen when storage is in wrong state of overlapping blocks and hopefully https://github.com/prometheus/tsdb/issues/299 fixes the root cause of overlaps.
Could you @roidelapluie and @n0guest test same on v2.2.1 once released (or just build docker from release-2.2 branch which includes the fix)?
bwplotka
on 14 Mar 2018
I have to wait for 2.2.1 because we do not use docker
roidelapluie
on 14 Mar 2018
Could you @roidelapluie and @n0guest test same on v2.2.1 once released (or just build docker from release-2.2 branch which includes the fix)?
Same as @roidelapluie - we aren't using docker. I'm waiting eagerly the releasy of 2.2.1. Because of that:
Yea, so these all weirdnesses can potentially happen when storage is in wrong state of overlapping blocks and hopefully prometheus/tsdb#299 fixes the root cause of overlaps.
Yep, also hoping for this to be a fix of current issue.
n0guest
on 14 Mar 2018
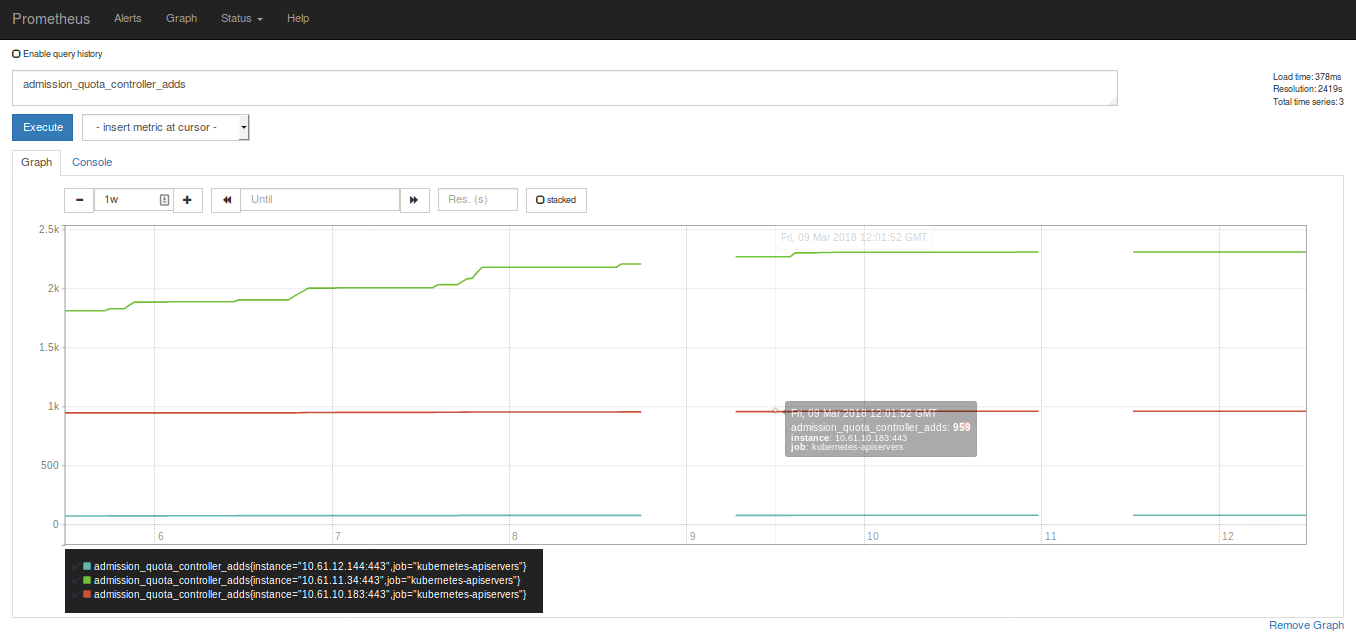
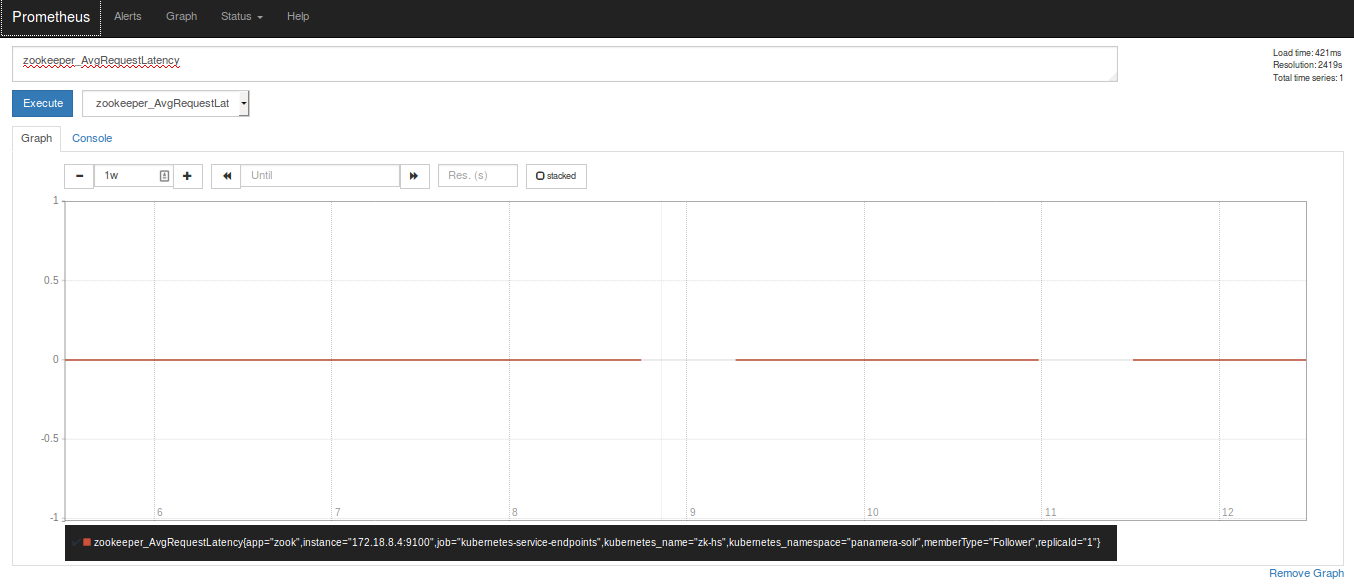
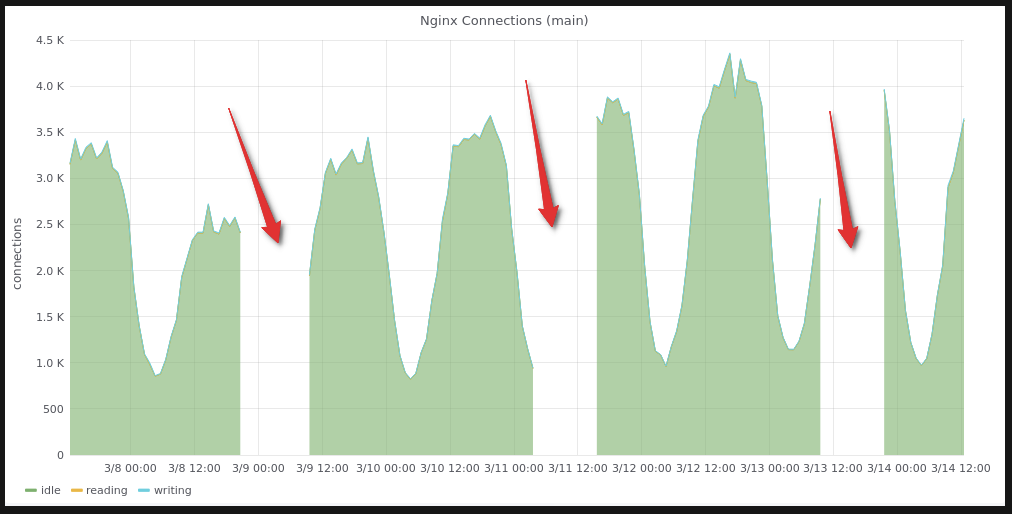
@Bplotka today I saw something similar to what @roidelapluie just shared
Some metrics seem to appear in the long gap.
Also setting --storage.tsdb.max-block-duration=6h seems to prevent this from happening, or atleast in the environment I set it up didn't chew metrics.
Env with --storage.tsdb.max-block-duration=6h:
 ghost
on 14 Mar 2018
ghost
on 14 Mar 2018
I have upgraded to 2.2.1. The metrics are sometimes there, sometimes not, depending on the query window.
roidelapluie
on 14 Mar 2018
Does that apply to the time range when 2.2.0 was running. The fix only prevents this from happening again but anything before that unfortunately remains potentially broken.
fabxc
on 14 Mar 2018
Yes. Just pointing out that the data is still very well on disk and that sometimes prometheus picks the "correct" block, sometimes the "incorrect" one.
roidelapluie
on 14 Mar 2018
@Bplotka first of all, thank you for fixing this issue! I know you mentioned this before but it is not clear to me if there is any way to re-read/recover those metrics? we have a quite large infrastructure and we use prometheus heavily and unfortunately we have some important gaps since we upgraded to 2.2.0 (we have just upgrade to 2.2.1 though) like a week ago.
 kamusin
on 21 Mar 2018
kamusin
on 21 Mar 2018
Hey @kamusin. Glad all works for you now. I will try to explain here why we are not sure if we can recover these gaps.
So the recovery potentially depends on when that issue happened vs when you upgraded to fix that.
Let's take for an example broken compaction for 2.2.0 (the issue I fixed):
Blocks in the system:
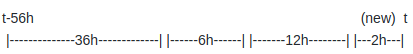
When new block appeared a wrong compaction resulted in:
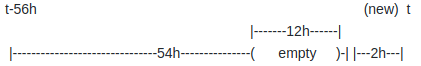
As you can see we ended up in case where we have overlapped blocks (54h block with 12h gap and 12h block itself) in the system. Also these time ranges are from @hgranillo case. Issue could happen on any other blocks based on your case, however, it was inevitable.
Now the fun begins. Nothing is prepared for overlap, so we have all sorts of problems there.. and TBH I am unable to predict what results one can have with these (:
As we could see so far:
- @hgranillo got some magic compactions:
level=info ts=2018-03-09T15:05:31.944625635Z caller=compact.go:394 component=tsdb msg="compact blocks" count=3 mint=1520402400000 maxt=1520596800000
level=info ts=2018-03-09T17:02:51.604621507Z caller=compact.go:394 component=tsdb msg="compact blocks" count=2 mint=1520402400000 maxt=1520575200000
and there is no longer overlapped blocks visible on his disk (from what we could see from meta files). We don't have enough logs, something bad seemed to happened after the log lines we have.
- @roidelapluie and others were "lucky" and if query switches from correct to incorrect blocks it means there is still something on disk which is 100% recoverable.
So I don't know the answer if generally this issue is recoverable. But we can go with this case by case.
If you @kamusin can print all the meta.txt files on your disk, you can simply check maxTime and minTime against overlaps. You can post your meta files here, so we can help with that check here.
bwplotka
on 21 Mar 2018
Maybe writing some short tool/script for this would be helpful
bwplotka
on 21 Mar 2018
I think I should be able to post the data @Bplotka, however if you have a snipper ready to share please let me know (so far so good with the upgrade, however every time we need to restart prometheus (we do have a small gap of no data that varies between 2-10 minutes, some nodes seem to not be affected though but this might be a different problem).
kamusin
on 23 Mar 2018
Dear All,
I am also facing similar issue as per my recently closed case #4002 , what is the fix for the issue?
Should i git clone the master branch and build the Prometheus binary with the fix provided by Bplotka? Or i need to make configuration changes
 hmmxp
on 23 Mar 2018
hmmxp
on 23 Mar 2018
@hmmxp 2.2.1 should include the fix, so let's move to your issue to investigate.
EDIT: Can see this is just missing gap from the time when you were on 2.2.0 so we can only discuss how to recover it. Can you see the missing gap on data produced by 2.2.1 Prometheus?
@kamusin yea, restart of Prometheus will always lose some data. Maybe you can make it faster because 2-10 minutes sounds long, but still - unless you use HA (multiple Prometheus) replicas, there will be some data missing. We use https://github.com/improbable-eng/thanos to provide Prometheus HA (it has query layer with deduplication feature)
bwplotka
on 23 Mar 2018
@Bplotka At the moment version 2.2.1 not seeing any missing data, but still monitoring closely. The data that was missing, is it possible to recover it or what are the options available?
hmmxp
on 23 Mar 2018
@hmmxp See few comments above: https://github.com/prometheus/prometheus/issues/3943#issuecomment-375095111
If you check all your metafiles from your disk and there will be overlapping block somewhere -> we will be able to recover it. You can post them here, we can help.
bwplotka
on 23 Mar 2018
I saw the "block time ranges overlap" error with Prometheus 2.2.0 within a day or two after a fresh install. I upgraded to 2.2.1 and nuked the DB. It ran fine for about 36 hours, then I saw the error occur. The filesystem fills up during a compaction, and if I restart Prometheus at that point, it never comes back up.
This bug seems to be a regression since 2.1.0.
 dswarbrick
on 27 Mar 2018
dswarbrick
on 27 Mar 2018
Hi @dswarbrick, would you be able to share the logs?
The bug that caused it in 2.2.0 has been identified and fixed in 2.2.1.
 gouthamve
on 27 Mar 2018
gouthamve
on 27 Mar 2018
then I saw the error occur.
@dswarbrick what exactly error?
What exactly are you expecting to see and what are you seeing?
bwplotka
on 27 Mar 2018
@dswarbrick would this summary be correct:
- Installed whatever 2.x
- Upgrade to 2.2.1
- "Nuke DB" << please specify what, exactly, you kept and deleted
- Run for 36h
- Compaction starts, disk is full
- You restart Prometheus while disk full
- Prometheus does not actually start while disk full and compaction half finished
RichiH
on 28 Mar 2018
I installed 2.2.0 last Friday, around midday. It ran fine until Sunday, when the log started to report these:
Mar 25 11:00:00 fkb-prom prometheus[20055]: level=info ts=2018-03-25T09:00:00.371572247Z caller=compact.go:394 component=tsdb msg="compact blocks" count=1 mint=1521957600000 maxt=1521964800000
Mar 25 11:00:01 fkb-prom prometheus[20055]: level=info ts=2018-03-25T09:00:01.652055946Z caller=head.go:348 component=tsdb msg="head GC completed" duration=64.254505ms
Mar 25 11:00:02 fkb-prom prometheus[20055]: level=info ts=2018-03-25T09:00:02.26184745Z caller=head.go:357 component=tsdb msg="WAL truncation completed" duration=609.038738ms
Mar 25 11:00:02 fkb-prom prometheus[20055]: level=info ts=2018-03-25T09:00:02.388959377Z caller=compact.go:394 component=tsdb msg="compact blocks" count=3 mint=1521936000000 maxt=1521957600000
Mar 25 11:00:04 fkb-prom prometheus[20055]: level=info ts=2018-03-25T09:00:04.082174394Z caller=compact.go:394 component=tsdb msg="compact blocks" count=2 mint=1521892800000 maxt=1521936000000
Mar 25 11:00:06 fkb-prom prometheus[20055]: level=info ts=2018-03-25T09:00:06.414524076Z caller=compact.go:394 component=tsdb msg="compact blocks" count=3 mint=1521799200000 maxt=1521957600000
Mar 25 11:00:11 fkb-prom prometheus[20055]: level=error ts=2018-03-25T09:00:11.083160017Z caller=db.go:281 component=tsdb msg="compaction failed" err="reload blocks: invalid block sequence: block time ranges overlap (1521892800000, 1521957600000)"
Mar 25 11:00:12 fkb-prom prometheus[20055]: level=info ts=2018-03-25T09:00:12.09218052Z caller=compact.go:394 component=tsdb msg="compact blocks" count=2 mint=1521892800000 maxt=1521957600000
Mar 25 11:00:15 fkb-prom prometheus[20055]: level=error ts=2018-03-25T09:00:15.18509509Z caller=db.go:281 component=tsdb msg="compaction failed" err="reload blocks: invalid block sequence: block time ranges overlap (1521799200000, 1521828000000)"
At one point it ran out of space on the 50 GB filesystem:
Mar 25 11:30:04 fkb-prom prometheus[20055]: level=info ts=2018-03-25T09:30:04.488714476Z caller=compact.go:394 component=tsdb msg="compact blocks" count=11 mint=1521892800000 maxt=1521957600000
Mar 25 11:34:33 fkb-prom prometheus[20055]: level=error ts=2018-03-25T09:34:33.128006388Z caller=db.go:281 component=tsdb msg="compaction failed" err="compact [/srv/prometheus/metrics2/01C9E67YYV73KNNCWD01TAYSFT /srv/prometheus/metrics2/01C9E65NKJ8AFP6NJSYQVPKNJX /srv/prometheus/metrics2/01C9E6SZNNAABH0KW6A4KZXV2J /srv/prometheus/metrics2/01C9E65XDW74BHDR7NPBNAGXJ2 /srv/prometheus/metrics2/01C9E70R0XAT2QG2BEENG2FD11 /srv/prometheus/metrics2/01C9E6A4H1FPAAGRW8SRKDWNTE /srv/prometheus/metrics2/01C9E6CKZ9452ERA52VPHWKK41 /srv/prometheus/metrics2/01C9E6FMJY0C2Y1KYJPNRHBXAT /srv/prometheus/metrics2/01C9E6KRHFMXV5K3SES7QX72X6 /srv/prometheus/metrics2/01C9E788ESAF5F2AT1YAX51HZY /srv/prometheus/metrics2/01C9E65KYME9TEKF8J212QK38J]: write compaction: write chunks: no space left on device"
This gradually became worse:
Mar 25 16:39:27 fkb-prom prometheus[20055]: level=info ts=2018-03-25T14:39:27.268797602Z caller=compact.go:394 component=tsdb msg="compact blocks" count=1 mint=1521964800000 maxt=1521972000000
Mar 25 16:39:28 fkb-prom prometheus[20055]: level=error ts=2018-03-25T14:39:28.925386435Z caller=db.go:281 component=tsdb msg="compaction failed" err="reload blocks: open block /srv/prometheus/metrics2/01C9EQRRJ6GW1GMCQYVBV5AGA7: mmap files: mmap: cannot allocate memory"
... until eventually it died:
Mar 25 17:21:22 fkb-prom prometheus[20055]: fatal error: runtime: cannot allocate memory
When I tried to restart it on Monday, it would not start and died with:
Mar 26 10:01:18 fkb-prom prometheus[6806]: level=error ts=2018-03-26T08:01:18.048223898Z caller=main.go:575 err="Opening storage failed invalid block sequence: block time ranges overlap (1521799200000, 1521957600000)"
Mar 26 10:01:18 fkb-prom prometheus[6806]: level=info ts=2018-03-26T08:01:18.048388413Z caller=main.go:577 msg="See you next time!"
This is the point at which I removed the entire contents of /srv/prometheus/metrics2, and upgraded to Prometheus 2.2.1. This obviously started fine with an empty DB.
Later on Tuesday, I started to see the same "block time ranges overlap" error again, and the filesystem again started to rapidly fill, as if the compaction process was failing with leftover temporary files.
Mar 27 17:00:14 fkb-prom prometheus[14007]: level=error ts=2018-03-27T15:00:14.672804202Z caller=db.go:281 component=tsdb msg="compaction failed" err="reload blocks: invalid block sequence: block time ranges overlap (1522087200000, 1522152000000)"
I tried to restart Prometheus, and once again it failed to start with:
Mar 27 18:38:19 fkb-prom prometheus[7437]: level=error ts=2018-03-27T16:38:19.768740127Z caller=main.go:575 err="Opening storage failed invalid block sequence: block time ranges overlap (1522051200000, 1522152000000)"
Mar 27 18:38:19 fkb-prom prometheus[7437]: level=info ts=2018-03-27T16:38:19.768880142Z caller=main.go:577 msg="See you next time!"
At this point I again removed the contents of /srv/prometheus/metrics2, and started with a fresh DB again. So far it's been running ok for about 14 hours.
dswarbrick
on 28 Mar 2018
Can you share the logs until the compaction failed error happened on 2.2.1?
On Wed, Mar 28, 2018 at 1:47 PM Daniel Swarbrick notifications@github.com
wrote:
I installed 2.2.0 last Friday, around midday. It ran fine until Sunday,
when the log started to report these:Mar 25 11:00:00 fkb-prom prometheus[20055]: level=info ts=2018-03-25T09:00:00.371572247Z caller=compact.go:394 component=tsdb msg="compact blocks" count=1 mint=1521957600000 maxt=1521964800000
Mar 25 11:00:01 fkb-prom prometheus[20055]: level=info ts=2018-03-25T09:00:01.652055946Z caller=head.go:348 component=tsdb msg="head GC completed" duration=64.254505ms
Mar 25 11:00:02 fkb-prom prometheus[20055]: level=info ts=2018-03-25T09:00:02.26184745Z caller=head.go:357 component=tsdb msg="WAL truncation completed" duration=609.038738ms
Mar 25 11:00:02 fkb-prom prometheus[20055]: level=info ts=2018-03-25T09:00:02.388959377Z caller=compact.go:394 component=tsdb msg="compact blocks" count=3 mint=1521936000000 maxt=1521957600000
Mar 25 11:00:04 fkb-prom prometheus[20055]: level=info ts=2018-03-25T09:00:04.082174394Z caller=compact.go:394 component=tsdb msg="compact blocks" count=2 mint=1521892800000 maxt=1521936000000
Mar 25 11:00:06 fkb-prom prometheus[20055]: level=info ts=2018-03-25T09:00:06.414524076Z caller=compact.go:394 component=tsdb msg="compact blocks" count=3 mint=1521799200000 maxt=1521957600000
Mar 25 11:00:11 fkb-prom prometheus[20055]: level=error ts=2018-03-25T09:00:11.083160017Z caller=db.go:281 component=tsdb msg="compaction failed" err="reload blocks: invalid block sequence: block time ranges overlap (1521892800000, 1521957600000)"
Mar 25 11:00:12 fkb-prom prometheus[20055]: level=info ts=2018-03-25T09:00:12.09218052Z caller=compact.go:394 component=tsdb msg="compact blocks" count=2 mint=1521892800000 maxt=1521957600000
Mar 25 11:00:15 fkb-prom prometheus[20055]: level=error ts=2018-03-25T09:00:15.18509509Z caller=db.go:281 component=tsdb msg="compaction failed" err="reload blocks: invalid block sequence: block time ranges overlap (1521799200000, 1521828000000)"At one point it ran out of space on the 50 GB filesystem:
Mar 25 11:30:04 fkb-prom prometheus[20055]: level=info ts=2018-03-25T09:30:04.488714476Z caller=compact.go:394 component=tsdb msg="compact blocks" count=11 mint=1521892800000 maxt=1521957600000
Mar 25 11:34:33 fkb-prom prometheus[20055]: level=error ts=2018-03-25T09:34:33.128006388Z caller=db.go:281 component=tsdb msg="compaction failed" err="compact [/srv/prometheus/metrics2/01C9E67YYV73KNNCWD01TAYSFT /srv/prometheus/metrics2/01C9E65NKJ8AFP6NJSYQVPKNJX /srv/prometheus/metrics2/01C9E6SZNNAABH0KW6A4KZXV2J /srv/prometheus/metrics2/01C9E65XDW74BHDR7NPBNAGXJ2 /srv/prometheus/metrics2/01C9E70R0XAT2QG2BEENG2FD11 /srv/prometheus/metrics2/01C9E6A4H1FPAAGRW8SRKDWNTE /srv/prometheus/metrics2/01C9E6CKZ9452ERA52VPHWKK41 /srv/prometheus/metrics2/01C9E6FMJY0C2Y1KYJPNRHBXAT /srv/prometheus/metrics2/01C9E6KRHFMXV5K3SES7QX72X6 /srv/prometheus/metrics2/01C9E788ESAF5F2AT1YAX51HZY /srv/prometheus/metrics2/01C9E65KYME9TEKF8J212QK38J]: write compaction: write chunks: no space left on device"This gradually became worse:
Mar 25 16:39:27 fkb-prom prometheus[20055]: level=info ts=2018-03-25T14:39:27.268797602Z caller=compact.go:394 component=tsdb msg="compact blocks" count=1 mint=1521964800000 maxt=1521972000000
Mar 25 16:39:28 fkb-prom prometheus[20055]: level=error ts=2018-03-25T14:39:28.925386435Z caller=db.go:281 component=tsdb msg="compaction failed" err="reload blocks: open block /srv/prometheus/metrics2/01C9EQRRJ6GW1GMCQYVBV5AGA7: mmap files: mmap: cannot allocate memory"... until eventually it died:
Mar 25 17:21:22 fkb-prom prometheus[20055]: fatal error: runtime: cannot allocate memory
When I tried to restart it on Monday, it would not start and died with:
Mar 26 10:01:18 fkb-prom prometheus[6806]: level=error ts=2018-03-26T08:01:18.048223898Z caller=main.go:575 err="Opening storage failed invalid block sequence: block time ranges overlap (1521799200000, 1521957600000)"
Mar 26 10:01:18 fkb-prom prometheus[6806]: level=info ts=2018-03-26T08:01:18.048388413Z caller=main.go:577 msg="See you next time!"This is the point at which I removed the entire contents of
/srv/prometheus/metrics2, and upgraded to Prometheus 2.2.1. This obviously
started fine with an empty DB.Later on Tuesday, I started to see the same "block time ranges overlap"
error again, and the filesystem again started to rapidly fill, as if the
compaction process was failing with leftover temporary files.Mar 27 17:00:14 fkb-prom prometheus[14007]: level=error ts=2018-03-27T15:00:14.672804202Z caller=db.go:281 component=tsdb msg="compaction failed" err="reload blocks: invalid block sequence: block time ranges overlap (1522087200000, 1522152000000)"
I tried to restart Prometheus, and once again it failed to start with:
Mar 27 18:38:19 fkb-prom prometheus[7437]: level=error ts=2018-03-27T16:38:19.768740127Z caller=main.go:575 err="Opening storage failed invalid block sequence: block time ranges overlap (1522051200000, 1522152000000)"
Mar 27 18:38:19 fkb-prom prometheus[7437]: level=info ts=2018-03-27T16:38:19.768880142Z caller=main.go:577 msg="See you next time!"At this point I again removed the contents of /srv/prometheus/metrics2,
and started with a fresh DB again. So far it's been running ok for about 14
hours.—
You are receiving this because you commented.Reply to this email directly, view it on GitHub
https://github.com/prometheus/prometheus/issues/3943#issuecomment-376801318,
or mute the thread
https://github.com/notifications/unsubscribe-auth/AHA3H0ZHKchAX248U508E4xGCkSYzwbnks5ti0cJgaJpZM4Sku1O
.
gouthamve
on 28 Mar 2018
Here are my logs starting from the initial 2.2.0 install last week, up to the last few minutes.
prometheus.log.gz
dswarbrick
on 28 Mar 2018
Hey @dswarbrick - thanks for you logs! I tried to repro your case locally, but it seems that 2.2.1 works perfectly in your case. Somehow your Prometheus behaved diffidently and produced overlapped block.
Details: https://github.com/prometheus/tsdb/pull/311
Looks like there was some side/external effect that impacted your storage/Prometheus but not sure what. Keep us in touch if you can repro the issue once again.
Also you were quite lucky that Prometheus cought overlapping blocks. For most cases they will be ignored (Prometheus will be running despite overlapping blocks as it was for other folks here). This PR fixes overlapping check: https://github.com/prometheus/tsdb/pull/310
bwplotka
on 29 Mar 2018
This curiously looks like the bug-fix was not included in the debian release.
https://packages.debian.org/sid/all/golang-github-prometheus-tsdb-dev/download doesn't have this PR: https://github.com/prometheus/tsdb/pull/299 which fixed the issue. cc @TheTincho
@dswarbrick Could you try with an release from here and see if that fixes it: https://github.com/prometheus/prometheus/releases/tag/v2.2.1
gouthamve
on 29 Mar 2018
Yup, let's double check debian packaging, but if not - there is one thing we don't check locally: influence on compact planning if meta.Compaction.Failed is set. Worth to extend tests for that as well.
bwplotka
on 29 Mar 2018
So far the Debian package 2.2.1 is still working correctly on my system, but I think it's been just a little over 24 hours in operation. The problem seems to kick in at around the 36 hour mark. If I see the problem occur today, I will install the vanilla release from upstream and clear the DB again.
Thanks for the help so far! I think your suspicion of the Debian package is probably warranted.
dswarbrick
on 29 Mar 2018
Hey all, I can confirm that I missed this update in the tsdb library. I will update the package now.
 NightTsarina
on 29 Mar 2018
NightTsarina
on 29 Mar 2018
I have just uploaded updated packages to Debian (2.2.1+ds-2), they should hit the mirrors in a few hours. Sorry for the mistake!
NightTsarina
on 29 Mar 2018
Thanks for solving this so quickly!
On Thu, Mar 29, 2018 at 11:24 AM Martín Ferrari notifications@github.com
wrote:
I have just uploaded updated packages to Debian (2.2.1+ds-2), they should
hit the mirrors in a few hours. Sorry for the mistake!—
You are receiving this because you modified the open/close state.
Reply to this email directly, view it on GitHub
https://github.com/prometheus/prometheus/issues/3943#issuecomment-377177010,
or mute the thread
https://github.com/notifications/unsubscribe-auth/AEuA8ktUZpNCMq85D9GjjMkidgV6arO-ks5tjKg_gaJpZM4Sku1O
.
fabxc
on 29 Mar 2018
This thread has been automatically locked since there has not been any recent activity after it was closed. Please open a new issue for related bugs.
![lock[bot] picture](https://avatars1.githubusercontent.com/in/6672?v=4&s=40) lock[bot]
on 22 Mar 2019
lock[bot]
on 22 Mar 2019
Related issues
 whaike
·
48Comments
whaike
·
48Comments
 juliusv
·
41Comments
juliusv
·
41Comments
 F21
·
52Comments
juliusv
·
170Comments
brian-brazil
·
102Comments
F21
·
52Comments
juliusv
·
170Comments
brian-brazil
·
102Comments
Most helpful comment
Ok, we found bug & root cause. No block was deleted - just compaction wrongly ignores some blocks in certain cases. The ignored block (12h) is most likely laying around, but no one is using it.
Debugging repro: https://github.com/prometheus/tsdb/pull/298
Fix in progress.
EDIT: Fix in review https://github.com/prometheus/tsdb/pull/299