Prisma: Engine Exited on GCR (Google Cloud Run)
Getting this error on Google Cloud Run, after redeploy it works again. Is there still some issue with serverless?

 malekjaroslav
All 53 comments
The target exit issue is one of those that we know exist, but could not properly debug yet as we are missing a reliable reproduction. So if you can reproduce this consistently, we would love to get more information about this!
 janpio
on 8 Feb 2020
janpio
on 8 Feb 2020
I think it usually happens if the instance is not used for a while and goes to sleep. Then when it’s called and tries to connect, it throws this error. I am not sure how to reproduce GCR “sleep” state
malekjaroslav
on 8 Feb 2020
@malekjaroslav I have a similar issue on GAE (and local). My suspicion is that after it wakes up from the sleep it tries to connect to the same port and receives ECONNREFUSED
 turboxx
on 10 Feb 2020
turboxx
on 10 Feb 2020
@malekjaroslav
Have you seen the docs section on database connection handling? It seems like this may be related.
If I understand your use-case, you are deploying a container to Google Cloud Run, which at times might keep the container cached (warm start) for subsequent requests. Instantiating the Prisma client, i.e. const prisma = new PrismaClient() as a global might help based on the Google Cloud Run docs
 2color
on 10 Feb 2020
2color
on 10 Feb 2020
@2color Yes, I do it like that
malekjaroslav
on 10 Feb 2020
@malekjaroslav Can you set a runtime environment variable DEBUG=* on GCR to get more information when this error occurs and post it here please?
 steebchen
on 11 Feb 2020
steebchen
on 11 Feb 2020
@steebchen @janpio So it is how @turboxx said. There is an ECONNREFUSED error.
2020-02-11 23:10:32.110 CET2020-02-11T22:10:32.110Z engine { error:
2020-02-11 23:10:32.110 CET { RequestError: connect ECONNREFUSED 127.0.0.1:44925
2020-02-11 23:10:32.110 CET at ClientRequest.request.once.error (/app/node_modules/@prisma/client/runtime/index.js:14275:14)
2020-02-11 23:10:32.110 CET at Object.onceWrapper (events.js:286:20)
2020-02-11 23:10:32.110 CET at ClientRequest.emit (events.js:203:15)
2020-02-11 23:10:32.111 CET at ClientRequest.origin.emit.args (/app/node_modules/@prisma/client/runtime/index.js:63703:11)
2020-02-11 23:10:32.111 CET at Socket.socketErrorListener (_http_client.js:392:9)
2020-02-11 23:10:32.111 CET at Socket.emit (events.js:203:15)
2020-02-11 23:10:32.111 CET at emitErrorNT (internal/streams/destroy.js:91:8)
2020-02-11 23:10:32.111 CET at emitErrorAndCloseNT (internal/streams/destroy.js:59:3)
2020-02-11 23:10:32.111 CET at process._tickCallback (internal/process/next_tick.js:63:19)
2020-02-11 23:10:32.111 CET name: 'RequestError',
2020-02-11 23:10:32.111 CET code: 'ECONNREFUSED',
2020-02-11 23:10:32.111 CET host: 'localhost:44925',
2020-02-11 23:10:32.111 CET port: '44925',
2020-02-11 23:10:32.111 CET hostname: 'localhost',
2020-02-11 23:10:32.111 CET hash: null,
2020-02-11 23:10:32.111 CET search: null,
2020-02-11 23:10:32.111 CET query: null,
2020-02-11 23:10:32.111 CET pathname: '/',
2020-02-11 23:10:32.111 CET href: 'http://localhost:44925/',
2020-02-11 23:10:32.111 CET retry: [Object],
2020-02-11 23:10:32.111 CET headers: [Object],
2020-02-11 23:10:32.111 CET hooks: [Object],
2020-02-11 23:10:32.111 CET decompress: true,
2020-02-11 23:10:32.111 CET throwHttpErrors: true,
2020-02-11 23:10:32.111 CET followRedirect: true,
2020-02-11 23:10:32.111 CET stream: false,
2020-02-11 23:10:32.111 CET form: false,
2020-02-11 23:10:32.111 CET json: true,
2020-02-11 23:10:32.111 CET cache: false,
2020-02-11 23:10:32.111 CET useElectronNet: false,
2020-02-11 23:10:32.111 CET body:
2020-02-11 23:10:32.111 CET '{"query":"query {\\n findManyChapter(\\n orderBy: index_ASC\\n where: {\\n status: APPROVED\\n }\\n first: 1\\n ) {\\n id\\n name\\n description\\n totalLength\\n color\\n status\\n index\\n createdAt\\n updatedAt\\n }\\n}","variables":{}}',
2020-02-11 23:10:32.111 CET agent: [Agent],
2020-02-11 23:10:32.111 CET method: 'POST',
2020-02-11 23:10:32.111 CET forceRefresh: true } } }
2020-02-11 23:10:32.118 CET2020-02-11T22:10:32.118Z prisma-client Error: Engine exited {"target":"exit","timestamp":"2020-02-11T22:10:28.785Z","level":"error","fields":{"message":"255"}}
2020-02-11 23:10:32.118 CET at currentRequestPromise.then.catch.error (/app/node_modules/@prisma/client/runtime/index.js:6370:27)
2020-02-11 23:10:32.118 CET at process._tickCallback (internal/process/next_tick.js:68:7)
2020-02-11 23:10:32.140 CETError: Engine exited {"target":"exit","timestamp":"2020-02-11T22:10:28.785Z","level":"error","fields":{"message":"255"}} at PrismaClientFetcher.request (/app/node_modules/@prisma/client/index.js:72:27) at process._tickCallback (internal/process/next_tick.js:68:7) { message:
2020-02-11 23:10:32.141 CET 'Engine exited {"target":"exit","timestamp":"2020-02-11T22:10:28.785Z","level":"error","fields":{"message":"255"}}',
2020-02-11 23:10:32.141 CET locations: [ { line: 2, column: 3 } ],
2020-02-11 23:10:32.141 CET path: [ 'chapters' ] }
@malekjaroslav Are you getting this error when connecting via cloud_sql_proxy? I'm getting it locally (using both the cloud_sql_proxy binary as well as the gcr.io/cloudsql-docker/gce-proxy docker image), however I'm not experiencing this error on Cloud Run, where I'm connecting via a unix socket directly. I'm wondering if this might be due to cloud_sql_proxy dropping connections, since when open psql, issue a query, come back to it some time later, and try to issue another query, I get:
mydb=> select * from "MyTable";
server closed the connection unexpectedly
    This probably means the server terminated abnormally
    before or while processing the request.
The connection to the server was lost. Attempting reset: Succeeded.
psql (12.1, server 11.6)
mydb=>
@janpio Does Prisma handle reconnections to the database when they are dropped or manage a connection pool under the hood?
 dkozma
on 12 Feb 2020
dkozma
on 12 Feb 2020
I experience it on a TCP connection
malekjaroslav
on 12 Feb 2020
I can't reproduce it with GCR and a Postgres database. @malekjaroslav Can you please let us know what database you are using and which provider/host you use for the database?
steebchen
on 13 Feb 2020
@steebchen I use Postgres hosted on Google Cloud SQL. I am connected via a TCP connection now, not unix socket
malekjaroslav
on 13 Feb 2020
@dkozma how do you manage to connect to Cloud SQL with prisma?
I get the following error in Cloud Run:
"\nInvalid prisma.() invocation in\n/usr/src/app/src/federations/b2bike/entities/service-pass/resolvers.js:6:76\n\n\n\nReason: Error occurred during query execution:\nConnectorError(ConnectorError { user_facing_error: None, kind: ConnectionError(Timeout\n\nstack backtrace:\n 0: failure::backtrace::internal::InternalBacktrace::new\n 1: failure::backtrace::Backtrace::new\n 2: sql_query_connector::error::SqlError::into_connector_error\n 3: <std::future::GenFuture<T> as core::future::future::Future>::poll\n 4: <std::future::GenFuture<T> as core::future::future::Future>::poll\n 5: <std::future::GenFuture<T> as core::future::future::Future>::poll\n 6: <std::future::GenFuture<T> as core::future::future::Future>::poll\n 7: <std::future::GenFuture<T> as core::future::future::Future>::poll\n 8: std::future::poll_with_tls_context\n 9: <std::future::GenFuture<T> as core::future::future::Future>::poll\n 10: <std::future::GenFuture<T> as core::future::future::Future>::poll\n 11: std::panicking::try::do_call\n 12: __rust_maybe_catch_panic\n at src/libpanic_unwind/lib.rs:78\n 13: <std::future::GenFuture<T> as core::future::future::Future>::poll\n 14: <std::future::GenFuture<T> as core::future::future::Future>::poll\n 15: hyper::proto::h1::dispatch::Dispatcher<D,Bs,I,T>::poll_catch\n 16: <hyper::server::conn::spawn_all::NewSvcTask<I,N,S,E,W> as core::future::future::Future>::poll\n 17: tokio::task::core::Core<T>::poll\n 18: std::panicking::try::do_call\n 19: __rust_maybe_catch_panic\n at src/libpanic_unwind/lib.rs:78\n 20: tokio::task::harness::Harness<T,S>::poll\n 21: tokio::runtime::thread_pool::worker::GenerationGuard::run_task\n 22: tokio::runtime::thread_pool::worker::GenerationGuard::run\n 23: std::thread::local::LocalKey<T>::with\n 24: tokio::runtime::thread_pool::worker::Worker::run\n 25: <std::panic::AssertUnwindSafe<F> as core::ops::function::FnOnce<()>>::call_once\n 26: std::panicking::try::do_call\n 27: __rust_maybe_catch_panic\n at src/libpanic_unwind/lib.rs:78\n 28: tokio::task::harness::Harness<T,S>::poll\n 29: tokio::runtime::blocking::pool::Inner::run\n 30: tokio::runtime::context::enter\n 31: std::sys_common::backtrace::__rust_begin_short_backtrace\n 32: std::panicking::try::do_call\n 33: __rust_maybe_catch_panic\n at src/libpanic_unwind/lib.rs:78\n 34: core::ops::function::FnOnce::call_once{{vtable.shim}}\n 35: <alloc::boxed::Box<F> as core::ops::function::FnOnce<A>>::call_once\n at /rustc/73528e339aae0f17a15ffa49a8ac608f50c6cf14/src/liballoc/boxed.rs:942\n 36: <alloc::boxed::Box<F> as core::ops::function::FnOnce<A>>::call_once\n at /rustc/73528e339aae0f17a15ffa49a8ac608f50c6cf14/src/liballoc/boxed.rs:942\n std::sys_common::thread::start_thread\n at src/libstd/sys_common/thread.rs:13\n std::sys::unix::thread::Thread::new::thread_start\n at src/libstd/sys/unix/thread.rs:79\n 37: start_thread\n 38: __clone\n) })\n"
with this settings:
datasource mysql {
  provider = "mysql"
  url = "mysql://USER:PASSWORD@PUBLIC_IP/DBNAME?host=/cloudsql/CLOUD_SQL_INSTANCE_CONNECTION_NAME
}
What does your datasource settings look like?
 iaarab
on 13 Feb 2020
iaarab
on 13 Feb 2020
@malekjaroslav Thanks. Sadly, I'm not able to reproduce this using GCR and Postgres Cloud SQL... How often does this happen? Can you reproduce this consistently? How long does it take after creating/updating the Cloud Run container for the error to appear?
steebchen
on 14 Feb 2020
I am experiencing the same issue after upgrading to prisma2 preview021 . It was working with the previous versions. Now I am getting following error:
"reqId":1606,"msg":"Engine exited {\"target\":\"exit\",\"timestamp\":\"2020-02-13T10:38:35.090Z\",\"level\":\"error\",\"fields\":{\"message\":\"255\"}}","stack":"Error: Engine exited {\"target\":\"exit\",\"timestamp\":\"2020-02-13T10:38:35.090Z\",\"level\":\"error\",\"fields\":{\"message\":\"255\"}}\n at PrismaClientFetcher.request (/app/node_modules/@prisma/client/index.js:72:27)\n at runMicrotasks (<anonymous>)\n at processTicksAndRejections (internal/process/task_queues.js:94:5)","type":"Error","v":1}
We are running our services on a kubernetes cluster hosted in AWS and prisma2 connects to a Aurora Postgres in AWS. So the issue is not related only to Google Cloud.
Unfortunately I don't have more information to provide to you.
 akoufa
on 14 Feb 2020
akoufa
on 14 Feb 2020
Get the same issue("Engine exited") yesterday, prisma2 version preview021. in my case, after running some inserts into db via SQL, I had some fields with type DateTime, and values for them were '0000-00-00 00:00:00' . in my models I have "DateTime?" type for these fields. after changing such values to null, this error dissapeared
 apokhilenko
on 16 Feb 2020
apokhilenko
on 16 Feb 2020
@malekjaroslav I'm curious to how you are connecting to Cloud SQL from Cloud Run via TCP. The Cloud SQL docs mention that it is only available via unix socket:
Note: Cloud Run (fully managed) does not support connecting to the Cloud SQL instance using TCP. Your code should not try to access the instance using an IP address such as 127.0.0.1 or 172.17.0.1.
That being said, I haven't verified my connection on the latest release (preview021) - ~I will update once I have done that.~ Edit: This is working for me.
dkozma
on 16 Feb 2020
@dkozma I connect via a public IP
malekjaroslav
on 17 Feb 2020
Same issue here, but I cannot be fully reproduced. Is there any way to re-start the engine when it finds that the engine exited
 homura
on 25 Feb 2020
homura
on 25 Feb 2020
All people having this issue: can you please post the Prisma version you're using here? And if you can, please try upgrading to the latest Prisma version and let us know if the issue still occurs.
steebchen
on 25 Feb 2020
@steebchen In my case, it was Preview 21, now updating to 22 so will see if it still happens
malekjaroslav
on 26 Feb 2020
@steebchen In my case it was also after upgrading to preview021. I also checked with preview022. An issue still exists but the issue now is:
"message is not defined","stack":"ReferenceError: message is not defined\n at PrismaClientFetcher.request (/app/node_modules/@prisma/client/index.js:103:76)\n at processTicksAndRejections (internal/process/task_queues.js:97:5) .
akoufa
on 26 Feb 2020
same as @akoufatzis, the message changed on preview22
turboxx
on 1 Mar 2020
@steebchen I checked it again with preview023 and it seems that the issue is fixed now. Thank you for your great work.
akoufa
on 3 Mar 2020
More context: This was most likely fixed by https://github.com/prisma/prisma-client-js/commit/e2f6a90d5945c55cf5ca26ee61076c6115797d48
 divyenduz
on 3 Mar 2020
divyenduz
on 3 Mar 2020
I'm still receiving errors on version preview023 at the same time at it was in version preview021, but since version preview022 the message changed to "message is not defined". So is it really fixed?
turboxx
on 5 Mar 2020
@turboxx Are you also deploying your app to Google Cloud Run ?
 pantharshit00
on 5 Mar 2020
pantharshit00
on 5 Mar 2020
@pantharshit00 No as mentioned above I'm using Google App Engine and usually, this error appeared once the machine woke up.
turboxx
on 8 Mar 2020
Hi @turboxx @malekjaroslav @homura @apokhilenko @iaarab,
the underlying code was recently changed, so your old error outputs can not really help us any more, unfortunately.
It would be really helpful if you could add the environment variable DEBUG=* to your deployment, redeploy and post the full logs here when you can reproduce again.
Let me know if you need any help.
 Jolg42
on 17 Mar 2020
Jolg42
on 17 Mar 2020
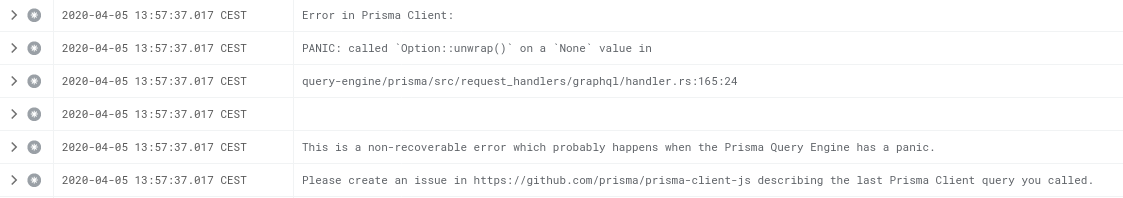
Unfortunately I just ran into this on preview024 using Google Cloud Run + Cloud SQL (Postgres), getting:
PANIC: called `Result::unwrap()` on an `Err` value: Error { kind: Closed, cause: None }
 at PrismaClientFetcher.request (/usr/src/app/node_modules/@prisma/client/runtime/index.js:1:47490)
 at runMicrotasks (<anonymous>)
 at processTicksAndRejections (internal/process/task_queues.js:97:5)
trying to do a simple findOne(). Just turned on DEBUG=* and will add that log here next time I encounter the error.
dkozma
on 17 Mar 2020
@dkozma Did you try to use prisma2 migrate or change something in your DB Schema? I experienced the same when after proceeding with a migration. I had to restart my service that uses the prisma2 client and then it worked fine.
akoufa
on 19 Mar 2020
@akoufatzis I haven't run a migration in a while before this error happened. It seems to happen after the Cloud Run instance has been up a while, and I suspect after periods of inactivity. It is very spontaneous, and hasn't happened since I turned on the DEBUG flag three days ago. Restarting the server fixes the issue (probably since it has to establish a new database connection), and I'm suspecting this has to do with a dropped database connection that Prisma isn't recovering from (Cloud SQL/Postgres seems to terminate idle database connections after a while - at least that's what I've seen after letting psql idle on a Cloud SQL proxy connection for several hours).
@Jolg42 Do you know if there is a way to tell Prisma to automatically try to reconnect and re-issue the query if it gets a ECONNREFUSED or similar from the server? If not, what is Prisma's recommended reconnection strategy?
Regardless, I'll post this debugging information next time this error occurs, however I'm not completely sure when this error will happen again.
dkozma
on 20 Mar 2020
@dkozma Re-connection should happen in the background normally. We have a potential improvement on that. We'll keep you updated 😃
Jolg42
on 20 Mar 2020
@dkozma I can confirm I am also getting an error after a period of inactivity.
"\nInvalid prisma.configuration.findOne() invocation:\n\nPANIC: called Result::unwrap() on an Err value: Error { kind: Io, cause: Some(Os { code: 104, kind: ConnectionReset, message: \"Connection reset by peer\" }) }",
akoufa
on 20 Mar 2020
Ok, finding this quite late but some questions:
When is this error happening, especially asking for the Closed? Is the server idling for a while, and when you again try requesting it errors? I'm currently investigating the connection pool crate we use that doesn't really have idle connection recycling, only max_lifetime, which would mean a connection is recycled no matter the traffic after the timeout.
I'm planning on Monday to see if I can replicate the problems. The funny thing is our test servers (for benchmarks) run all the time, and I've never witnessed anything similar than in this ticket. Maybe I have to bite the bullet and see how it works with Google's offering, due to our own servers running a self-installed PostgreSQL server...
 pimeys
on 21 Mar 2020
pimeys
on 21 Mar 2020
Addressing a feature to reconnect after a certain time the connection has been idling to our connection pool crate. https://github.com/importcjj/mobc/pull/23
Thinking of setting a default time limit for this to five minutes.
pimeys
on 23 Mar 2020
Could you try the latest alphas to see if you still get this error?
pimeys
on 25 Mar 2020
Sorry for the delay @Jolg42 @pimeys. Here's the logs from my server running preview024 + DEBUG=* from yesterday: https://gist.github.com/dkozma/cdc01d7f9bf0277767a68b21eb454bc3.
I just deployed ~2.0.0-alpha.962~ 2.0.0-alpha.973 to a QA instance and will monitor to see if the same error occurs. Thank you for your help with this and for adding the reconnect feature to mobc.
dkozma
on 26 Mar 2020
I basically spend one day turning off the database and back on again. Got everything into a state that eventually it will heal itself without plummeting all query execution times by always querying SELECT 1 without doing anything.
This what you've been witnessing here is when the connection is just idling, and those should be reconnected after five minutes of idle time.
The other problem is when a connection goes down completely, the pool had a counter bug that made it unusable after a while. The pool had no open connection, although it thought the maximum was already reached!
For the connection problems we used to do a SELECT 1 before taking a connection from the pool. But doing it all the time just hurts response times too much. I chose to do that once every 15 seconds and self-healing when the connection works again.
pimeys
on 26 Mar 2020
@pimeys - thanks for your hard work on this and for the explanation of the issues/fixes!
Also, I've been basing my connection pool size on num_vcpu + 1 (and setting the max number of instances by dividing max_connections from Cloud SQL with that number). Is there a more optimal setting to reduce the chances of this happening (e.g. adding an extra connection to the pool), or should this be sufficient?
dkozma
on 26 Mar 2020
This article tells all you need to know about optimal pool size.
https://github.com/brettwooldridge/HikariCP/wiki/About-Pool-Sizing
-------- Original Message --------
On Mar 26, 2020, 21:35, Dave Kozma wrote:
@pimeys - thanks for your hard work on this and for the explanation of the issues/fixes!
Also, I've been basing my connection pool size on num_vcpu + 1 (and setting the max number of instances by dividing max_connections from Cloud SQL with that number). Is there a more optimal setting to reduce the chances of this happening (e.g. adding an extra connection to the pool), or should this be sufficient?
—
You are receiving this because you were mentioned.
Reply to this email directly, view it on GitHub, or unsubscribe.
pimeys
on 26 Mar 2020
2.0.0-preview025 is now released with the improvements 🚀
Jolg42
on 27 Mar 2020
Thanks @Jolg42 and team! I just upgraded my servers to preview025 and will update this thread in a day or two with what I've observed.
dkozma
on 27 Mar 2020
Wanted to give an update on preview025 after it's been deployed for a bit. Some observations:
- I rolled out the deployment of
preview025to both my QA and production Cloud Run instances within a couple minutes of each other yesterday morning. I received alerts this morning that they both lost database connectivity (see logs here withDEBUGenabled) within a couple minutes of each other. - Looking at the time, I noticed that these dropped connections happened 24 hours (down to the minute) after deployment of the Cloud Run instance (for instance, QA was deployed on
2020-03-27 13:04:47 UTC, and the first database error occurred at2020-03-28 13:05:08 UTC) - The application self healed within 3 minutes, however this was due to Cloud Run restarting the container, forcing a database reconnect (see the end of the logs)
Some notes about my setup, in case that has any bearing:
- I have Cloud Monitoring doing an uptime check by hitting our
/api/statusendpoint every minute. This endpoint does a database query to make sure that the connection is active. - After reading the article on Pool Sizing that @pimeys sent, I kept my pool size at 2 based on
((core_count * 2) + effective_spindle_count). I seteffective_spindle_countto 0 since it is my understanding that Cloud Run uses an in-memory filesystem, and my instances are allocated 1 vCPU. I have increased it to 3 this morning after this incident to see if that improves anything. - Both environments are connecting to Cloud SQL (PostgreSQL 11) instances, using unix domain sockets as specified in their documentation:
- QA is running a 1 shared vCPU, non-HA instance, with 0.6 GB memory and 10 GB SSD
- Prod is running a 1 vCPU HA instance with 3.75 GB memory and 16 GB SSD
- Right now we have very low traffic on both instances since we are in a "pre-release" state.
Hopefully this gives you additional insight into the problem - please let me know if there is any other information I can supply or tweaks I can make to help solve this issue.
dkozma
on 28 Mar 2020
This happens when we start the system and there is no database available. We spawn the connection future to a different thread, and if the connection is down we can either:
- Panic and turn off the system
- Do nothing, but make the connection to do nothing at all
I think it's better to just panic and restart the application. Have you considered why the database is so unstable?
pimeys
on 28 Mar 2020
Unfortunately even with the preview025 I am still getting the issue after some idle time:
"\nInvalidprisma.configuration.findOne()invocation:\n\nPANIC: calledResult::unwrap()on anErrvalue: Error { kind: Io, cause: Some(Os { code: 104, kind: ConnectionReset, message: \"Connection reset by peer\" }) }",
akoufa
on 1 Apr 2020
Did you try with beta.1? There is one more fix to this.
pimeys
on 1 Apr 2020
No I was unable to get beta.1 working due to some other issue. I will update here when I manage to get it working.
akoufa
on 1 Apr 2020
Thank you @pimeys - I will try beta 1 as well and report back with the results.
Also I was hoping that using Google's managed Cloud SQL offering would help me reduce/eliminate database instability, not increase it 😕- appreciate your continued help here.
dkozma
on 2 Apr 2020
You will still get errors to logs for a few seconds after a crashed connection, but it should not panic anymore.
pimeys
on 2 Apr 2020
I have the same issues in cloud run
I can stable reproduce it. It works with simple query like getting 3-4 records from db. Throwing panic when i fetch over 300 records from db.
I use:
"@prisma/cli": "^2.0.0-beta.1",
"@prisma/client": "^2.0.0-beta.1"
 mufasa71
on 5 Apr 2020
mufasa71
on 5 Apr 2020
@pimeys I upgraded to 2.0.0-beta.1 on Friday and tested the Microservices that uses it today and the issue seems to be fixed. I will keep you updated if something changes. Thank you for working on this and fixing it.
akoufa
on 6 Apr 2020
@pimeys I've had 2.0.0-beta.1 running over the weekend as well and the issues I've seen regarding database issues disappeared almost completely. The only error I saw was extremely short lived and resolved almost immediately, as you said. I would say this issue seems fixed for me as well - thanks for your hard work on resolving this.
dkozma
on 6 Apr 2020
@mufasa71 I opened https://github.com/prisma/prisma/issues/2242 for you. Please follow that now.
This issue is getting quite fragmented now and it is hard to follow to everyone individually, so please open a new issue if you are still facing this.
pantharshit00
on 20 Apr 2020
Related issues
 15chrjef
·
24Comments
15chrjef
·
24Comments
 alizahid
·
26Comments
alizahid
·
26Comments
 emolr
·
25Comments
emolr
·
25Comments
 yovanoc
·
28Comments
yovanoc
·
28Comments
 internalfx
·
60Comments
internalfx
·
60Comments
Most helpful comment
@pimeys I've had
2.0.0-beta.1running over the weekend as well and the issues I've seen regarding database issues disappeared almost completely. The only error I saw was extremely short lived and resolved almost immediately, as you said. I would say this issue seems fixed for me as well - thanks for your hard work on resolving this.