Powertoys: Memory leak in PowerToys.exe
ℹ Computer information
- PowerToys version: 0.27
- PowerToy Utility: FancyZones (suspected)
- Running PowerToys as Admin: Yes
- Windows build number: [run "winver"] 19042.630
📝 Provide detailed reproduction steps (if any)
- Create custom zone with >40 squares ( 5 monitors, different DPIs, only one screen has over 40 zones, the rest have <15 )
- Use computer as normal (~4-6h)
✔️ Expected result
Normal memory use
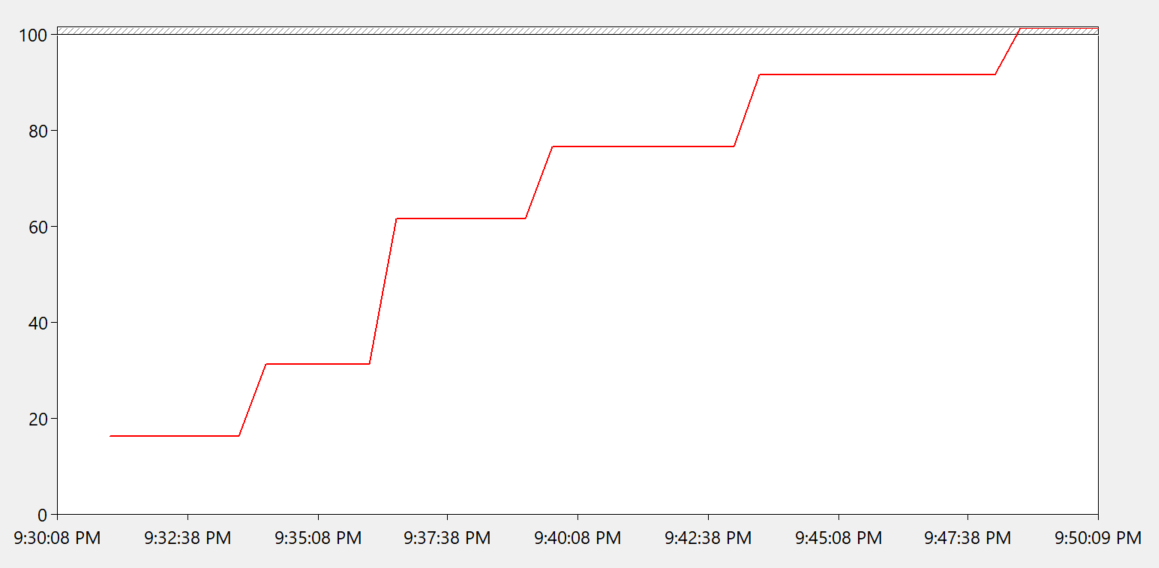
❌ Actual result
~32GB private, ~2GB working memory used. Suspected trouble when Chrome started flickering and popping up "out of memory" error boxes on a machine with 32GB ram in 2020. :)
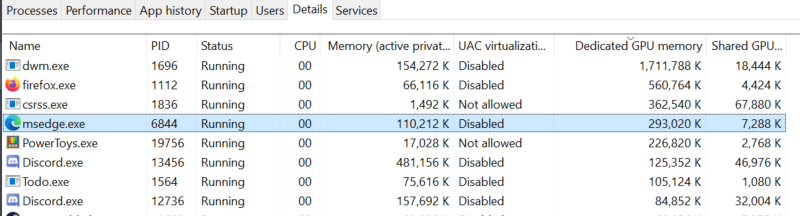
📷 Screenshots

I have a full dump and a minidump if anyone would find it helpful, I may take a peek myself what could possibly have taken up 34GB ram...
 whippc
All 33 comments
did this style config work prior to .27?
 crutkas
on 3 Dec 2020
crutkas
on 3 Dec 2020
@whippc
we need repro steps since, creating and using a custom layout with 50 zones doesn't show any memory leak, I would expect a quite significant one to reach 34GB in a few hours.
We need the current FZ settings and also detailed information of all the layouts in use.
 enricogior
on 4 Dec 2020
enricogior
on 4 Dec 2020
I'll need to pull the configs later today. Also, I never tested this before this version. That was the only thing I changed after the update so I assumed that must have caused it, it got a bit slow after editing the zones manually, but I didn't think much of it until later in the day. I gave you all the steps I took to reproduce, so maybe there's something wrong with my config file.
I have 2 dump files I took from Process Explorer before I killed the exe, a mini dump and a 34gb full dump, which I'm hoping to poke at later as well, out of curiosity more than anything. I read we shouldn't post them but send them to Microsoft directly somehow, does anyone know where I can send the dump(s)?
Sent from my phone
From: Enrico Giordani notifications@github.com
Sent: Friday, December 4, 2020 3:36:06 AM
To: microsoft/PowerToys PowerToys@noreply.github.com
Cc: whippc whippc@collierschools.com; Mention mention@noreply.github.com
Subject: External -Re: [microsoft/PowerToys] After editing fancyzones with many squares on grid, memory usage hit 34GB before choking Chrome out of memory (v0.27) (#8378)
This Email originated outside of Collier County Public Schools and may contain a link. Please do not click links you were not specifically expecting, even from known senders.
@whippchttps://github.com/whippc
we need repro steps since, creating and using a custom layout with 50 zones doesn't show any memory leak, I would expect a quite significant one to reach 34GB in a few hours.
We need the current FZ settings and also detailed information of all the layouts in use.
—
You are receiving this because you were mentioned.
Reply to this email directly, view it on GitHubhttps://github.com/microsoft/PowerToys/issues/8378#issuecomment-738645115, or unsubscribehttps://github.com/notifications/unsubscribe-auth/AIPOOJEPD5FF3NDQM4LOZMTSTCNPNANCNFSM4UMO6Z3A.
whippc
on 4 Dec 2020
@whippc
for the minidump you can try to zip it and if it's not too big, GitHub will allow to attach it to a comment.
enricogior
on 4 Dec 2020
I am seeing something similar. In particular, I have a 4K monitor with 4 zones, and a second monitor with one zone. Memory just slowly climbs. But I want to double check this is the same problem: I see "commit" size rising. I rebooted last night and I'm at 2GB now (after a few days it was up above 9). But the "Memory" (or what is in RAM) is quite small. So this is something that is allcoated and no longer used (classic leak thing). So it isn't putting pressure on my RAM, but likely is putting pressure on my page file. :-)
 gordonwatts
on 4 Dec 2020
gordonwatts
on 4 Dec 2020
I think so too, opening the full dump in a hex editor shows the last 99% of memory is all 0s. Null, nothing there. My setup is similar, 3 4ks and 2 1080p monitors across both the GPU and onboard graphics, I’m also using littlebigmouse to manage mouse movement across screens. Do you use anything similar, or have any other oddities with your setup, just in case we find anything we’re using in common that may have something to do with this somehow.
whippc
on 4 Dec 2020
whippc
on 4 Dec 2020
I think PowerToys is about the only "odd" thing about my setup. And I repaved my SurfacePro6 about a week ago, so it is a fairly clean machine. But I do have 2 monitors as well (one is external, the other is the SurfacePro6's screen).
gordonwatts
on 4 Dec 2020
@enricogior, marking this as 0.29 so we can start investigating it
crutkas
on 5 Dec 2020
This happened twice on my computer. The first time it took ~10GB working set and the second time it took ~20GB commit size, after using computer for a long time. I don't have many grid squares (actually I didn't use powertoys during that time), and this never happened on v0.25.
Edit: it happend the third time:

I guess I'll have to stop using it before this bug is fixed :(
 Gallium70
on 5 Dec 2020
Gallium70
on 5 Dec 2020
Note for the investigation: a memory leak of this size cannot be the result of a user action repeated multiple times. For example, showing the zones cannot be the cause because in a few hours a user might only activate the zones a very limited amount of times. If the leak was in that code, it would have to be in the order of tens if not hundreds of MB for each action.
The possible causes may be:
- a recurring code that is not triggered by a user action
- a user action that enters an infinite loop
enricogior
on 5 Dec 2020
@whippc @gordonwatts @Gallium70
can you please check the size of the %localappdata%\Microsoft\PowerToys folder?
Can you also check the log files in %localappdata%\Microsoft\PowerToys\RunnerLogs?
Thanks.
enricogior
on 5 Dec 2020
My PowerToys process has been running for about 24 hours, perhaps a bit more. Memory is at a "reasonable" 300MB, and the commit size is at ~ 6GB.
PowerToys folder: 128 KB
PowerToys\RunnerLogs: 2 zero-length files
Some quick experiments:
- Holding down the Windows key and the arrow key and little the key repeat so a window flashes across all zones in my two-monitor setup caused a 20KB allocation for the first move, but then was rock solid for almost 60 seconds of testing.
- Alt-space, which calls up the launcher, repeatedly, didn't seem to cause it directly.
- This extra memory allocation does not seem to be impacting the performance of the computer. Most of it is committed, not in RAM, so I only noticed it because I was monitoring another bad process (RunTimeBroker).
I'm watching this closely now, and I'm starting to get the impression the major increases occur when I switch virtual desktops. It isn't 1:1, but it seems like there is an increase of about 100 megs or something... sometimes. But it could be a coincidence - I'll keep an eye on that (I do switch virtual desktops frequently, so even if the 100 megs happened infrequently, it would start to add up).
gordonwatts
on 5 Dec 2020
I'm playing with deskotp switching with the crtl-Win-left/right keys further.
- Restarted PowerToys
- Monitored commit size in the
Detailspane of task manager. At start up ram was about 8 MB, and Commit was about 150 MB - Switched quickly through 3 desktops, and then back to the first desktop
- The RAM size had not changed at all - 8 MB, and commit was up to 600 MB.
I don't claim to be an expert on memory models, but it is as if the memory was reserved, but never touched - as the RAM usage never changed, but the commit did.
gordonwatts
on 5 Dec 2020
@gordonwatts
thanks for investigating the problem.
I also see a 30 MB increase for each new VD, but only upon creation, not every time VDs are switched.
enricogior
on 6 Dec 2020
Try letting it sit for a while, perhaps? After it sleeps? I seem to see it happening there as well, not just when it starts.
I've got some work to do - I'll try running the data collector for a while and see if it captures anything interesting.
gordonwatts
on 6 Dec 2020
Ok - I did some more testing - the act of "going to sleep" seems to trigger a re-allocation. To repro this is what I have to do:
- Start power toys, monitor the "Commit Size" or "page file size" depending on the tool (perf mon or task manager)
- Switch to a second desktop, switch back
- Note that Commit size has gone up.
- Switch to the same second desktop, switch back
- Note that the Commit size is not going up.
- Put the computer to sleep (I have a surface pro 6) usign the start memnu, clicking the power button, and selecting sleep
- Wake up, note the Commit size has already increased
- Switch to a new desktop, note that it has increased again.
I didn't know how to monitor sleep in the perf monitor, sorry. But, I put the machine to sleep after the first large step (second step). When it wakes up it takes that small step. There is a longer plateau, and then I switched desktop and it takes another step (and then later I went one switch further and there was another step).
- It looks like each time you visit a new desktop you get an allocation
- If you sleep, the allocations are reset
- When you wake, PowerToys makes an immediate allocation for the desktop the machine wakes on
- Each subsequent new desktop you switch to costs you again.
The above seems quite repeatable at this point on my machine.
gordonwatts
on 6 Dec 2020
@whippc @gordonwatts @Gallium70
what GPU are you using?
On Intel GPU I can reproduce it.
On AMD or nVidia GPU I cannot reproduce it.
enricogior
on 6 Dec 2020
Oh! That is very odd! I'm using a SurfacePro6 - so the GPU is part of the Intel chip. So, also an Intel GPU! I have another machine that has NVIDIA on it, but it is 1000's of miles away and I won't be back near it until January.
gordonwatts
on 7 Dec 2020
My desktop has an Nvidia GTX 1060 6gb, with Studio Driver 456.71 (I want to say EVGA but I’d have to look, out of office at the moment), but it's worth noting I have my motherboard set to allow both that card and the onboard intel graphics, cpu is an i7 6700k, mobo is Asus z170-a.
whippc
on 7 Dec 2020
Thanks for finding the fix! Looking forward to it being released!
gordonwatts
on 7 Dec 2020
@whippc @gordonwatts @Gallium70
if for you it's acceptable to install an unsigned, I've attached an unsigned build that contain the fix for this problem if you want to test it. We are planning to release it in 0.27.1 in the next couple of days.
Thanks.
EDIT: you need to uninstall 0.27 before installing the unsigned build.
enricogior
on 8 Dec 2020
@whippc @gordonwatts @Gallium70
what GPU are you using?On Intel GPU I can reproduce it.
On AMD or nVidia GPU I cannot reproduce it.
I'm using AMD Vega 8 GPU, integrated with a AMD 4800U CPU.
@whippc @gordonwatts @Gallium70
can you please check the size of the%localappdata%\Microsoft\PowerToysfolder?
Can you also check the log files in%localappdata%\Microsoft\PowerToys\RunnerLogs?
Thanks.
The PowerToys folder inside AppData takes ~1.2MB, and RunnerLogs only contains several empty files.
@whippc @gordonwatts @Gallium70
if for you it's acceptable to install an unsigned, I've attached an unsigned build that contain the fix for this problem if you want to test it. We are planning to release it in 0.27.1 in the next couple of days.
Thanks.
I'll try this build. Thanks for the fix in advance.
(I'm about to ask if i need to unistall first and I see your editing XD)
Gallium70
on 8 Dec 2020
I've installed the .zip file above.
- Upon start up it was taking 8MB RAM, and the commit was 62 MB.
- Switching back and forth to 4 desktops, and 9MB RAM, and commit was 215MB
- After sleep and wake, 91MB of RAM and 94 MB of commit
- Switching back and forth to 4 desktops, 91 MB of RAM and 250 MB of commit
- Another sleep, after wake, 91 MB of RAM and 94 MB of commit
It appears this is fixed for me. I'll track this for a day and report back if I see anything accumulate over time. Certainly the repo recipe I had above that was effected with the old version is not causing a memory leak this time!
Thanks so much for this work!!
P.S. when a new release comes out will I need to uninstall by hand, or will it auto-detected?
gordonwatts
on 8 Dec 2020
@gordonwatts
thanks for testing it.
when a new release comes out will I need to uninstall by hand, or will it auto-detected?
The 0.0.1 build doesn't auto update, I'll post here the link to the 0.27.1 installer.
enricogior
on 8 Dec 2020
@whippc @gordonwatts @Gallium70
if for you it's acceptable to install an unsigned, I've attached an unsigned build that contain the fix for this problem if you want to test it. We are planning to release it in 0.27.1 in the next couple of days.
Thanks.EDIT: you need to uninstall 0.27 before installing the unsigned build.
Uninstall
Will uninstalling remove all zones created? I have four monitors * 8+ Vdesktops. Recreating the zones would be really painful.
If removed upon uninstall, how do I keep a backup? @enricogior
 crimsonvspurple
on 8 Dec 2020
crimsonvspurple
on 8 Dec 2020
So far so good for me too! It's been running from about 10AM today until about 2PM, and so far it's only hit about 200KB total memory usage, vs last week's 32GB in almost as much time.
whippc
on 8 Dec 2020
@crimsonvspurple
Will uninstalling remove all zones created?
No, all settings remain untouched.
enricogior
on 8 Dec 2020
Looks ok so far. Thank you for the fix! I'll report again after 12 hours.
crimsonvspurple
on 8 Dec 2020
I've openned it up for over 10 hrs and it seems that the fix works for me.

Thanks a lot for the fix!
Gallium70
on 9 Dec 2020
15 hours later:

No crash. No high RAM/VRAM. 💯
Edit
FWIW:
AMD 3950X
64G RAM
Nvidia 980Ti
Severe VRAM availability issue before the fix; normal VRAM availability after the fix.
crimsonvspurple
on 9 Dec 2020
24 hour of use and it looks great! Thanks for this fix!!
gordonwatts
on 9 Dec 2020
Fixed in 0.27.1. https://github.com/microsoft/PowerToys/releases/tag/v0.27.1
crutkas
on 9 Dec 2020
Related issues
 ivadham
·
3Comments
ivadham
·
3Comments
 Martin-Hausleitner
·
3Comments
Martin-Hausleitner
·
3Comments
 verglor
·
3Comments
verglor
·
3Comments
 CombeeMike
·
3Comments
CombeeMike
·
3Comments
 SWinxy
·
3Comments
SWinxy
·
3Comments
Most helpful comment
So far so good for me too! It's been running from about 10AM today until about 2PM, and so far it's only hit about 200KB total memory usage, vs last week's 32GB in almost as much time.