Plots.jl: [BUG] GKS: Rectangle definition is invalid in routine SET_VIEWPORT
Other issues have a similar error messages, but none appear related to the context leading to my error. As far as I can tell from previous issues, this error message is fairly generic and not representative of the core problem.
Details
The following code (previously working for many versions of Plots.jl over the past year or so) produces an error.
# plot raster plot
inspikes = round.(∂t .* spikes; digits = 6)
outspikes = round.(∂t .* output; digits = 6)
scatter(inspikes, fill(1, length(spikes)), label = "Input",
        xlabel = "Time (sec)", ylabel = "", yticks = :none, title = "Raster Plot (\\alpha response)")
raster_plot = scatter!(outspikes, fill(2, length(output)), label = "Output")
The error:
GKS: Rectangle definition is invalid in routine SET_VIEWPORT
The value of the data just to show I am not plotting stuff with crazy precisions.
julia> inspikes
18-element Array{Float64,1}:
  0.7
  1.1
  1.19
  2.34
  4.17
  5.21
  6.3
  7.65
  8.2
  8.63
  9.15
  9.31
 10.36
 10.45
 11.25
 11.77
 11.78
 14.97

julia> outspikes
6-element Array{Float64,1}:
  1.77
  3.66
  6.14
  9.97
 12.64
 14.41
Backends
This bug occurs on ( insert x below )
Backend | yes | no | untested
-------------|-----|-----|---------
gr (default) | x | |
pyplot | | x |
plotly | | | x
plotlyjs | | | x
pgfplotsx | | | x
inspectdr | | | x
Versions
Plots.jl version: [91a5bcdd] Plots v1.4.3
Backend version (]st -m): [28b8d3ca] GR v0.50.1
Output of versioninfo():
julia> versioninfo()
Julia Version 1.4.0
Commit b8e9a9ecc6 (2020-03-21 16:36 UTC)
Platform Info:
  OS: macOS (x86_64-apple-darwin18.6.0)
  CPU: Intel(R) Core(TM) i7-6700HQ CPU @ 2.60GHz
  WORD_SIZE: 64
  LIBM: libopenlibm
  LLVM: libLLVM-8.0.1 (ORCJIT, skylake)
Environment:
  JULIA_NUM_THREADS = 4
 darsnack
All 12 comments
Hello,
I am having the same error. I make a bunch of plots and then arrange them into a subplot. This has worked with no issues until today when I tried it (using exactly the same data in the plots). The data does not require a high degree of precision and I have seen them before in exactly the form I want them in previous version of Plots.jl.
Now it gives me a GKS: Rectangle definition is invalid in routine SET_WINDOW error, and then at the end when I call
plot(p1,p2,p3,p4)
To arrange them into a subplot, it plots them all on top of each other.
 nfernandez-arias
on 4 Jul 2020
nfernandez-arias
on 4 Jul 2020
The issue in the original code is title = "Raster Plot (\\alpha response)" replacing this with e.g. title = "Raster Plot (α response)" works. This seems somehow related to https://github.com/JuliaPlots/Plots.jl/issues/1842 and https://github.com/JuliaPlots/Plots.jl/issues/2715.
 daschw
on 4 Jul 2020
daschw
on 4 Jul 2020
This seems promising - my plots also involve \\ notation - thanks for the quick update, will lyk
nfernandez-arias
on 4 Jul 2020
@jheinen the root of this issue seems to be:
julia> GR.jlgr.inqtext(0, 0, "Raster Plot (\\alpha response)")
([NaN, NaN, NaN, NaN], [NaN, NaN, NaN, NaN])
(Plots has a similar logic like GR.jlgr to decide between GR.inqmathtex, GR.inqtextext and GR.inqtext)
daschw
on 4 Jul 2020
Makes sense. The working “X” for pyplot also switched the \\ notation. I’ll try without that for GR and report back.
darsnack
on 5 Jul 2020
Removing the \\ notation fixes the problem in my case too
I was using it for purposes like
\\alpha_1
which renders as an alpha with a beta subscript. No longer works with
α_1
which now doesn't render it as a subscript, and
\$ α_1 \$
gives me errors, and doesn't render anything.
Given this bug, is LaTeXStrings.jl the only way to get subscripts / supserscripts?
nfernandez-arias
on 5 Jul 2020
I will check this and try to allow both notations ...
BTW: "\$\\alpha_1\$" works, too.
 jheinen
on 5 Jul 2020
jheinen
on 5 Jul 2020
There are still some issues that I am having trouble fixing. Previously I had a some code
xAxisLabels = ["r"; "g"; "OI"; "E"; "S"; "RD"; "\$ \\Large \\theta \$"; "\$ \\Large  \\beta \$"; "\$ \\Large  \\psi \$"]
p = bar(xAxisLabels, transpose(invjac) * grad, title = "\$ \\nabla_m \\log (\\textrm{CEV Welfare chg. \\%}) \$")
which seemed to work. Now, it does not recognize the \Large. And more importantly, it does not recognize the \textrm{} anymore.
But the most confusing part is that it gives me no errors when I run it line by line. But when I run a script containing these lines, I get the same GKS: Rectangle definition is invalid in routine SET_VIEWPORT error, and it jumbles up the whole plot.
Apologies if this description of the pathology is not 100% clear. It is difficult to succinctly describe how this is failing. I have spent the last hour trying to figure out what the pattern is the best I can.
nfernandez-arias
on 5 Jul 2020
The "internal" mathtex renderer only supports a LaTeX subset. I could add a flag to force the use of the old one (based on "external" dvipng command as part of a LaTeX installation) or (you could) use workarounds like L"\nabla_p \log\ (CEV\ Welfare\ chg. \%)".
jheinen
on 5 Jul 2020
Just to make sure I understand your suggestion, it only adds spaces, but does not render the text in normal text mode, correct? This is probably fine for now and I really appreciate your help. Will this feature be added at some point? Often it is useful to be able to combine math and non-math expressions in the title or labels of a plot.
nfernandez-arias
on 5 Jul 2020
I can confirm that the same type of change \\alpha -> ⍺ works for me.
darsnack
on 6 Jul 2020
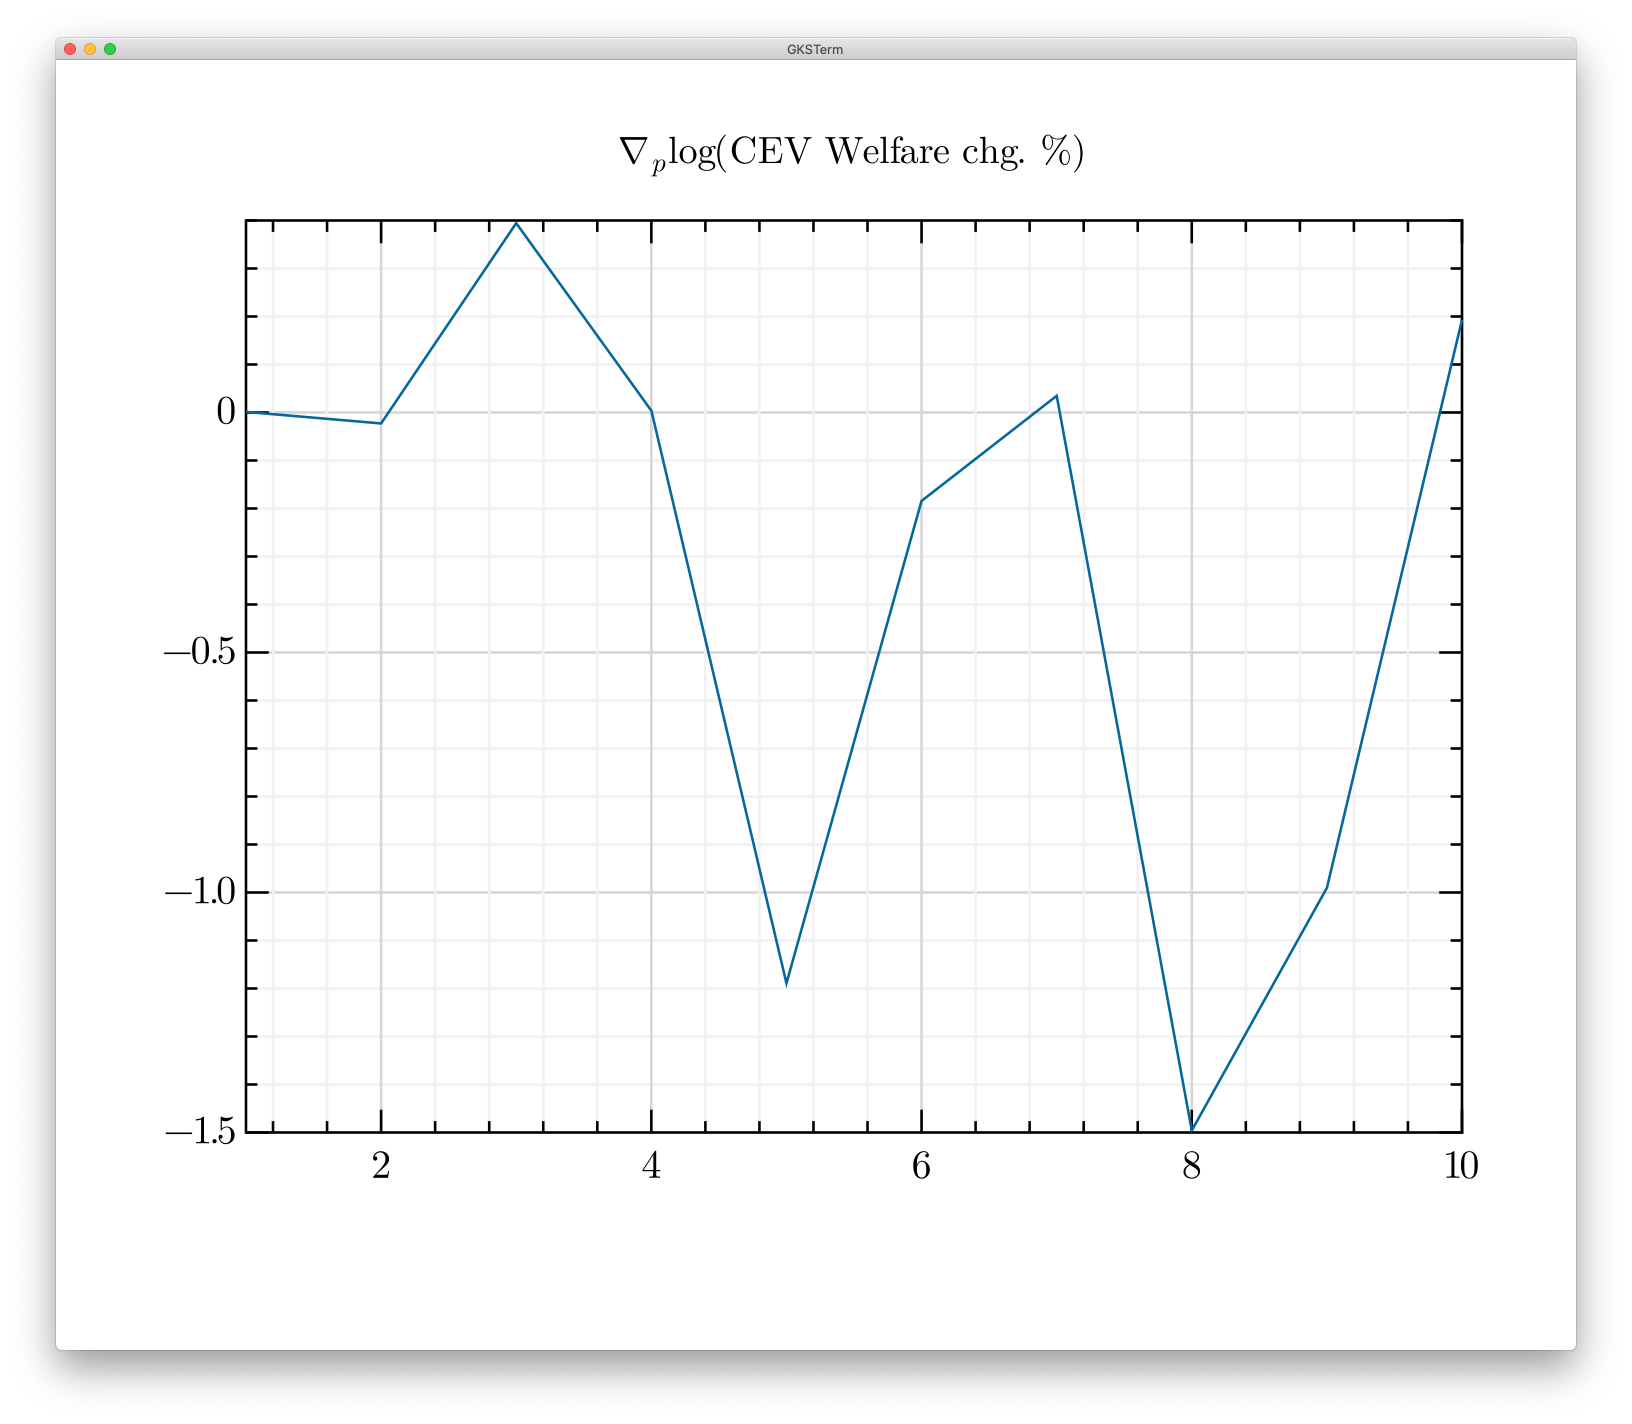
The textrm problem is fixed in gr#develop. plot(randn(10), title = "\$ \\nabla_p \\log (\\textrm{CEV Welfare chg. %}) \$") :
jheinen
on 6 Jul 2020
Related issues
 ereday
·
3Comments
ereday
·
3Comments
 PallHaraldsson
·
4Comments
PallHaraldsson
·
4Comments
 nebuta
·
3Comments
nebuta
·
3Comments
 crstnbr
·
3Comments
crstnbr
·
3Comments
 kleinschmidt
·
3Comments
kleinschmidt
·
3Comments
Most helpful comment
The

textrmproblem is fixed in gr#develop.plot(randn(10), title = "\$ \\nabla_p \\log (\\textrm{CEV Welfare chg. %}) \$"):