Plots.jl: PGFPlots legend problem with groupedbar
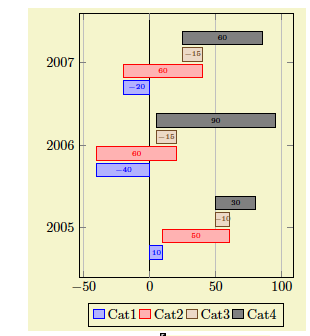
PGFPlots does not correctly show the series in the legend with groupedbar from StatPlots.jl. The legend only shows black lines for each series instead of colored rectangles.
Code to reproduce:
using Plots, StatPlots
pgfplots()
groupedbar(rand(10,3), bar_position = :stack)
Output:

enhancement
 SebastianM-C
👍2
All 4 comments
It appears pgfplots can do this (from the pgfplots manual)
 mkborregaard
on 31 Oct 2017
mkborregaard
on 31 Oct 2017
Any ideas for how to implement this @pkofod ? :-)
mkborregaard
on 31 Oct 2017
Ill look later tonight.
 pkofod
on 31 Oct 2017
pkofod
on 31 Oct 2017
❤1
🎉1
👍1
Thank you very much!
SebastianM-C
on 9 Nov 2017
❤1
Was this page helpful?
0 / 5 - 0 ratings
Related issues
 ereday
·
3Comments
ereday
·
3Comments
 GravityAssisted
·
5Comments
GravityAssisted
·
5Comments
 crstnbr
·
3Comments
crstnbr
·
3Comments
 Cody-G
·
4Comments
Cody-G
·
4Comments
 lstagner
·
5Comments
lstagner
·
5Comments
Most helpful comment
Ill look later tonight.