Plots.jl: Show columnames in legend of a grouped plot of a DataFrame
This has been discussed in a Slack thread.
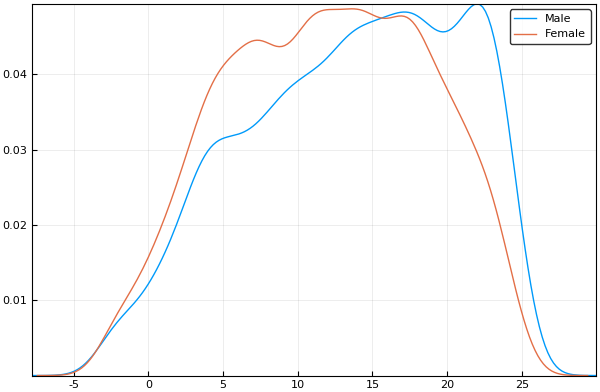
Example from StatPlots.jl github page where the legend entries are fine because the entries in the DataFrame are nice strings:
using RDatasets
school = RDatasets.dataset("mlmRev","Hsb82")
@df school density(:MAch, group = :Sx)
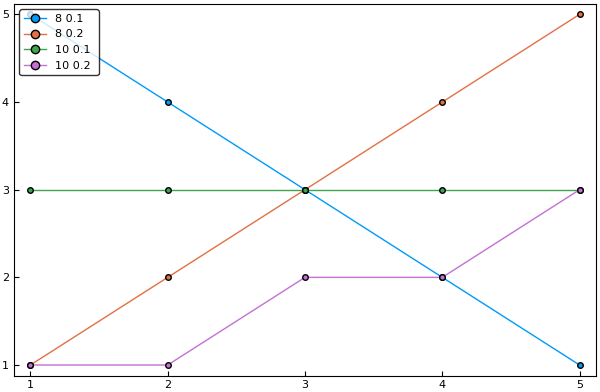
If one has numerical data though, let's say something like
df = DataFrame(L = vcat([fill(i, 10) for i in [8,10]]...), T = vcat([fill(t,5) for t in [0.2, 0.1, 0.2, 0.1]]...), R = vcat([collect(1:5) for _ in 1:4]...), F = [1,2,3,4,5,5,4,3,2,1,1,1,2,2,3,3,3,3,3,3])
one gets a legend just containing numbers
@df df plot(:R, :F, group = (:L, :T), legend=:topleft, marker=:circle, frame=:box, grid=false)
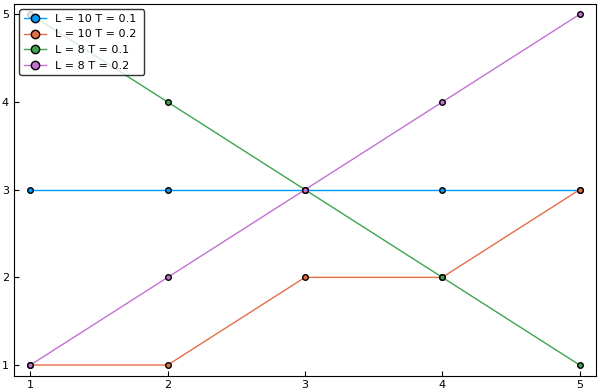
It would be nice to have a dedicated option, which naively would be called showcolumnnamesinlegend , that would lead to this much nicer legend.
 crstnbr
All 3 comments
Just to make sure: this issue only concerns StatPlots and @df or is there something you'd like to add to Plots as well to address this?
 piever
on 12 Mar 2018
piever
on 12 Mar 2018
After some more thinking, the best is to probably allow passing a NamedTuple to group, in which case the names are shown. For example:
plot(a, group = @NT(a = [1,1,2,2], b = [1,2,1,2]))
should display a = 1 b = 1 legends. Then in StatPlots you could do:
@df df plot(:R, :F, group = @NT(L = :L, T = :T), legend=:topleft, marker=:circle, frame=:box, grid=false)
and probably I could also add the {} from Query/JuliaDBMeta where {a, b} is short-hand for @NT(a = a, b = b) as more often then not the name of the column is the name you want to appear, meaning to get the same name as the column you should do:
@df df plot(:R, :F, group = {:L, :T}, legend=:topleft, marker=:circle, frame=:box, grid=false)
piever
on 12 Mar 2018
Closed by #1429 and #132
piever
on 15 Mar 2018
Related issues
 PallHaraldsson
·
4Comments
PallHaraldsson
·
4Comments
 cortner
·
4Comments
cortner
·
4Comments
 Cody-G
·
3Comments
Cody-G
·
4Comments
Cody-G
·
3Comments
Cody-G
·
4Comments
 pkofod
·
3Comments
pkofod
·
3Comments