Plots.jl: twinx() not working with PGFPlots
Hello,
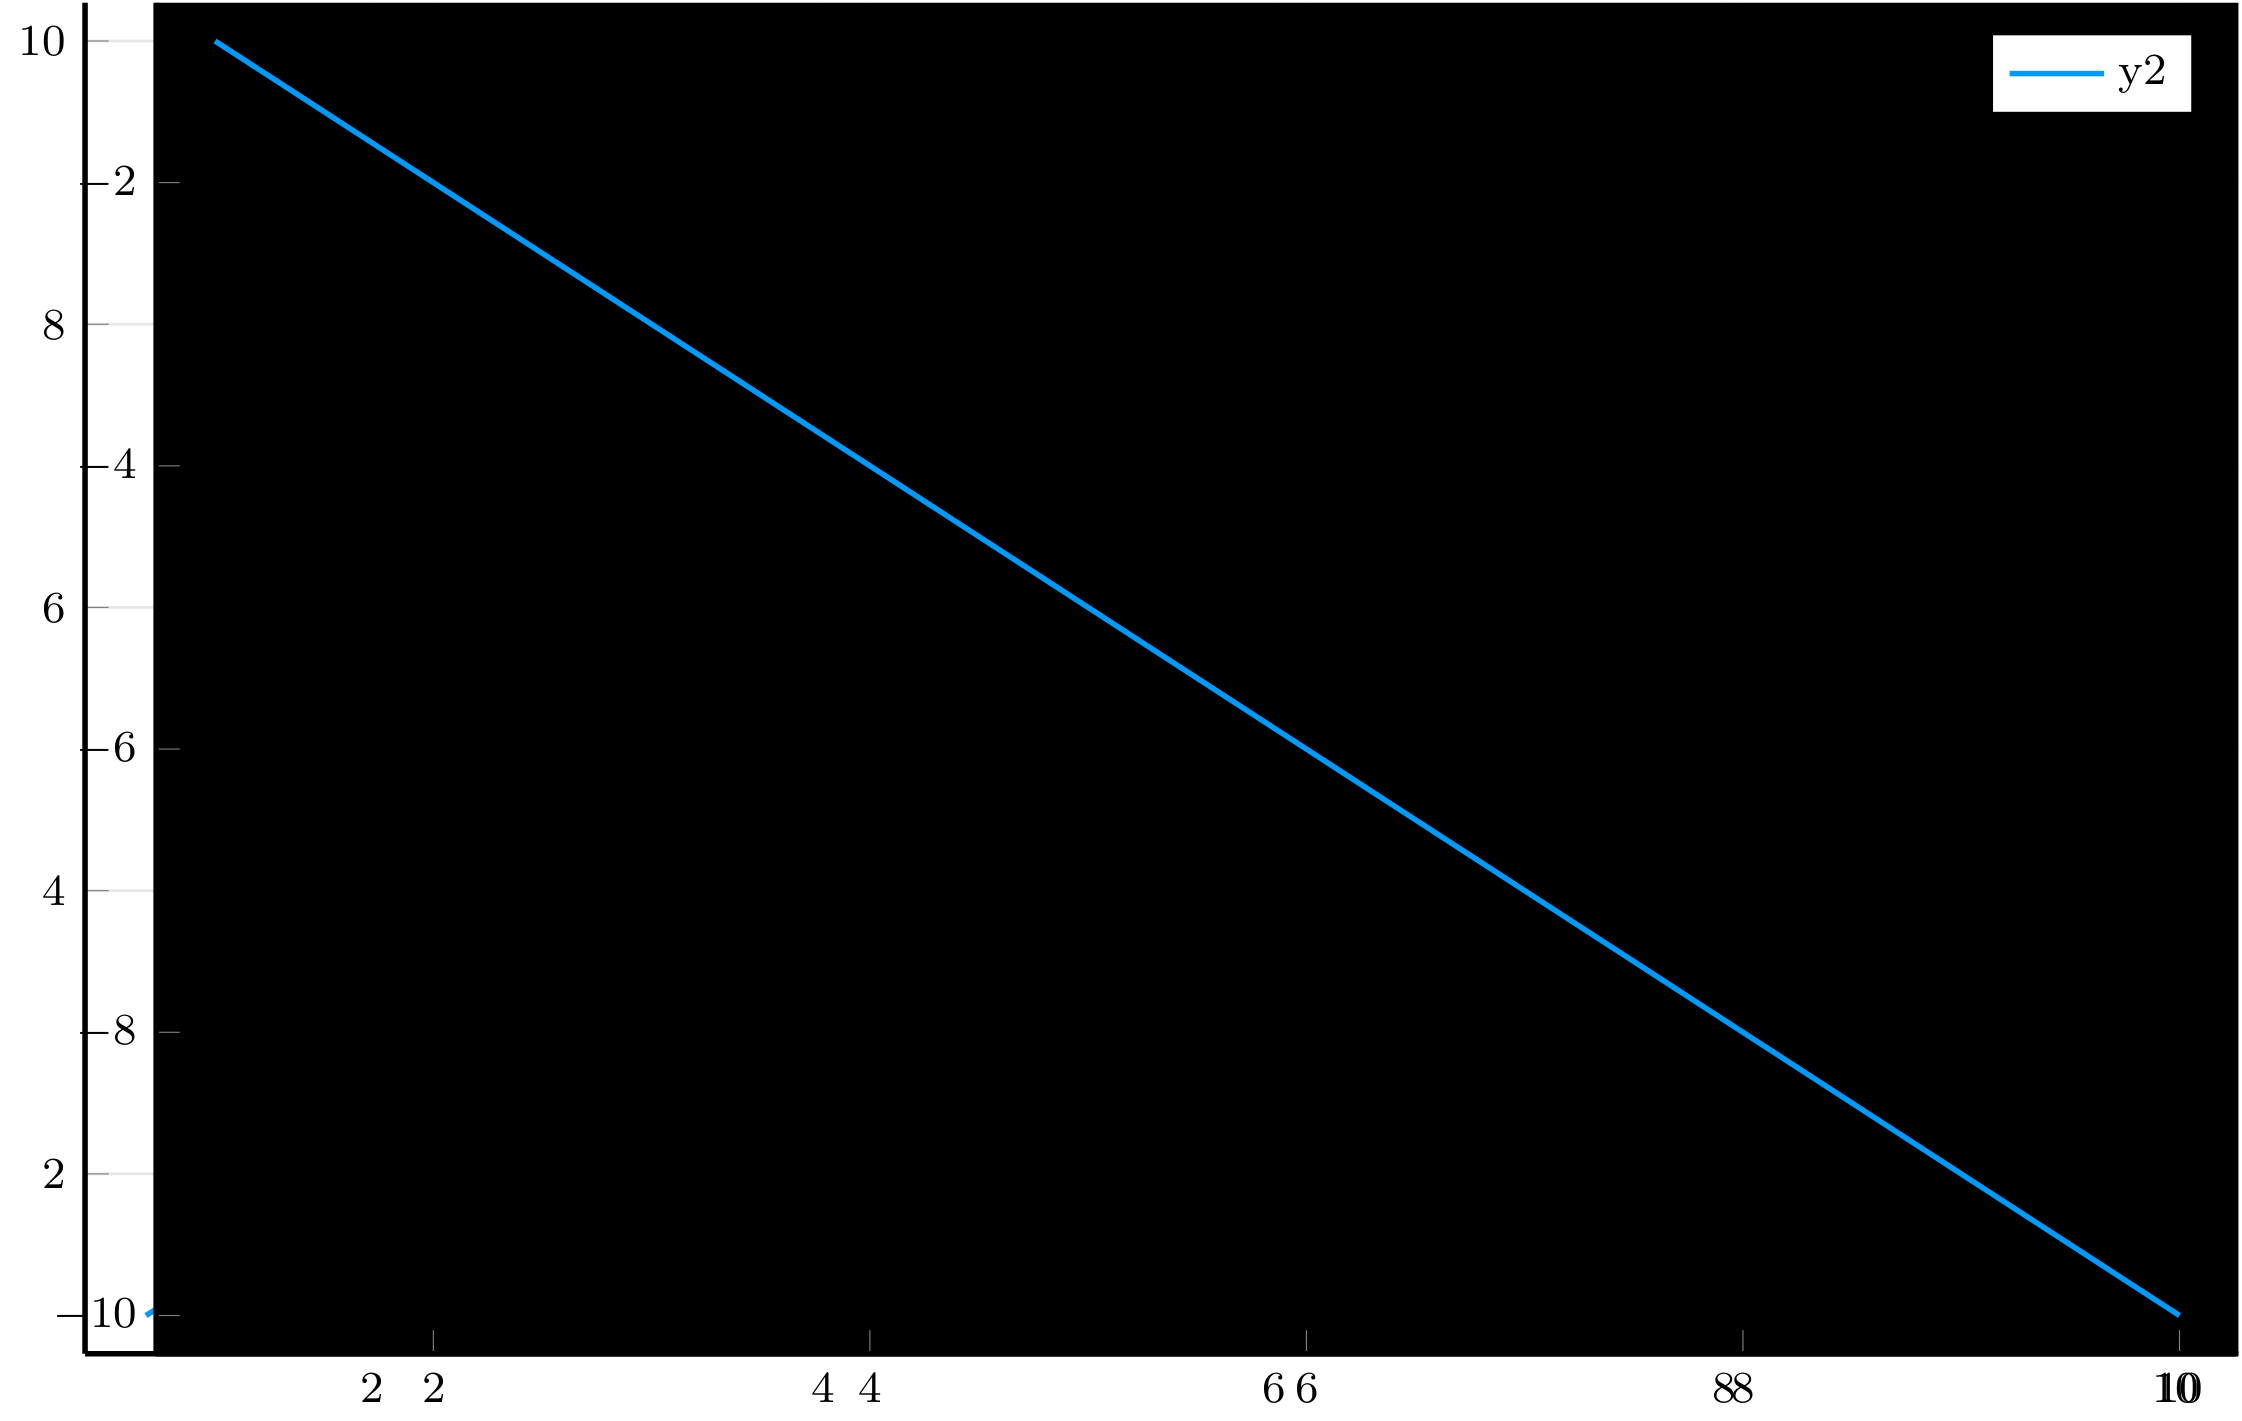
It seems to me that PGFPlots gives an incorrect output when trying to share the same x axis between two plots with twinx(). Here is the sample code
using Plots
pgfplots()
plot(1:10); plot!(twinx(), -(1:10))
Here is the output of PGFPlots:
Here is the generated .tex: pgfplot.txt
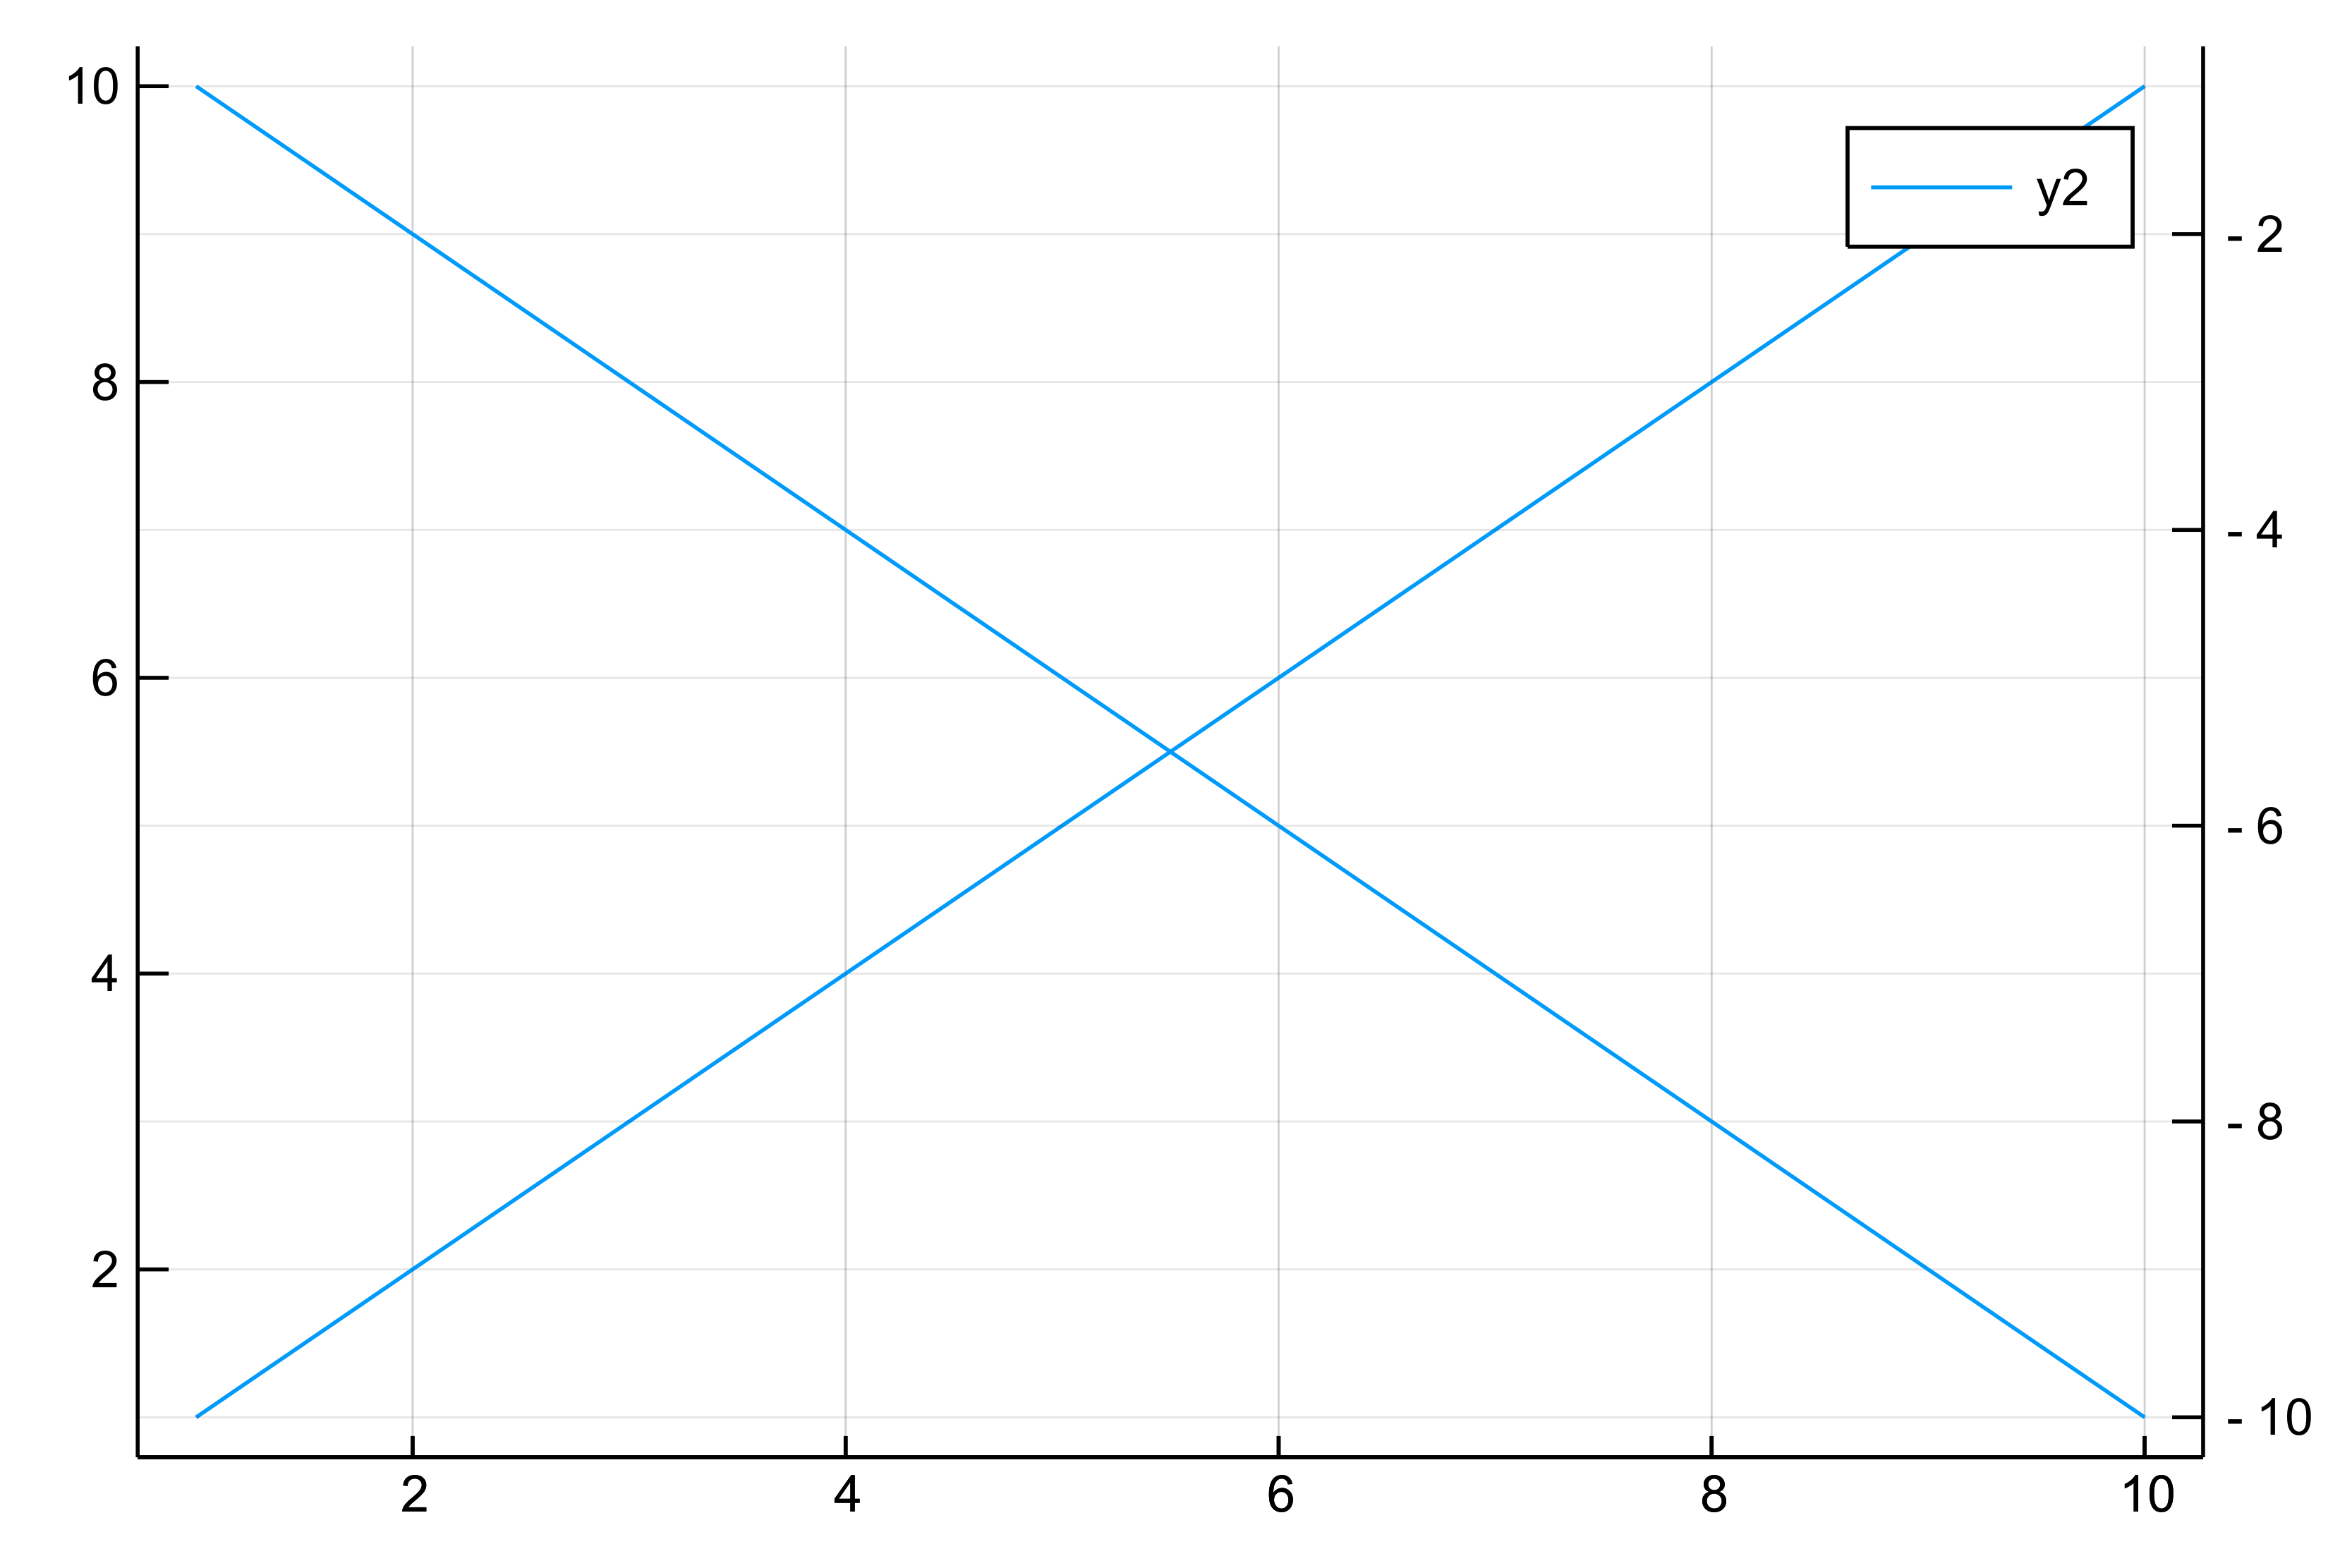
For reference, here is the correct output from GR:
 dancsi
All 4 comments
That's messed up. Thanks for reporting!
 daschw
on 24 Jun 2019
daschw
on 24 Jun 2019
😄1
👍1
I have experienced the same problem today. twinx() works fine for pyplot() and gr() backends, but will black-out the entire background under pgfplots.
 tzxiong
on 25 Sep 2019
tzxiong
on 25 Sep 2019
👍1
This does not become black, but still is messed up in the pgfplotsx-backend
 BeastyBlacksmith
on 8 May 2020
BeastyBlacksmith
on 8 May 2020
Any workarounds for this?
 pjentsch0
on 2 Oct 2020
pjentsch0
on 2 Oct 2020
Was this page helpful?
0 / 5 - 0 ratings
Related issues
 Cody-G
·
4Comments
Cody-G
·
4Comments
 kleinschmidt
·
3Comments
kleinschmidt
·
3Comments
 GravityAssisted
·
5Comments
GravityAssisted
·
5Comments
 apalugniok
·
3Comments
apalugniok
·
3Comments
 ereday
·
3Comments
ereday
·
3Comments
Most helpful comment
That's messed up. Thanks for reporting!