Plots.jl: Allow list of colors to be passed to hline function
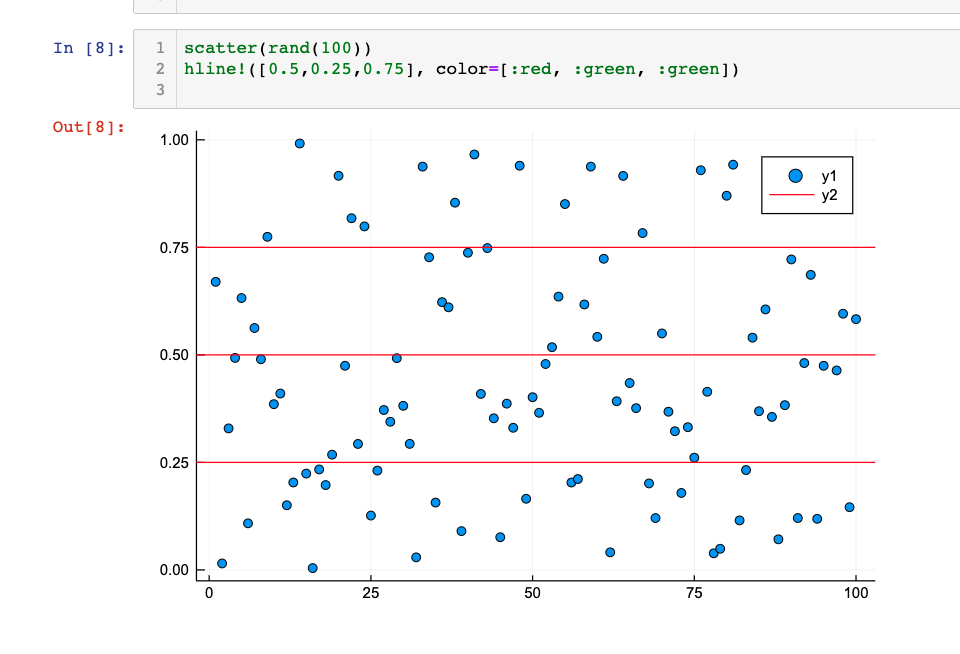
Right now this only produces red lines (i.e. no green ones):
scatter(rand(100))
hline!([0.5,0.25,0.75], color=[:red, :green, :green])
This can be seen here:
enhancement
 djsegal
All 2 comments
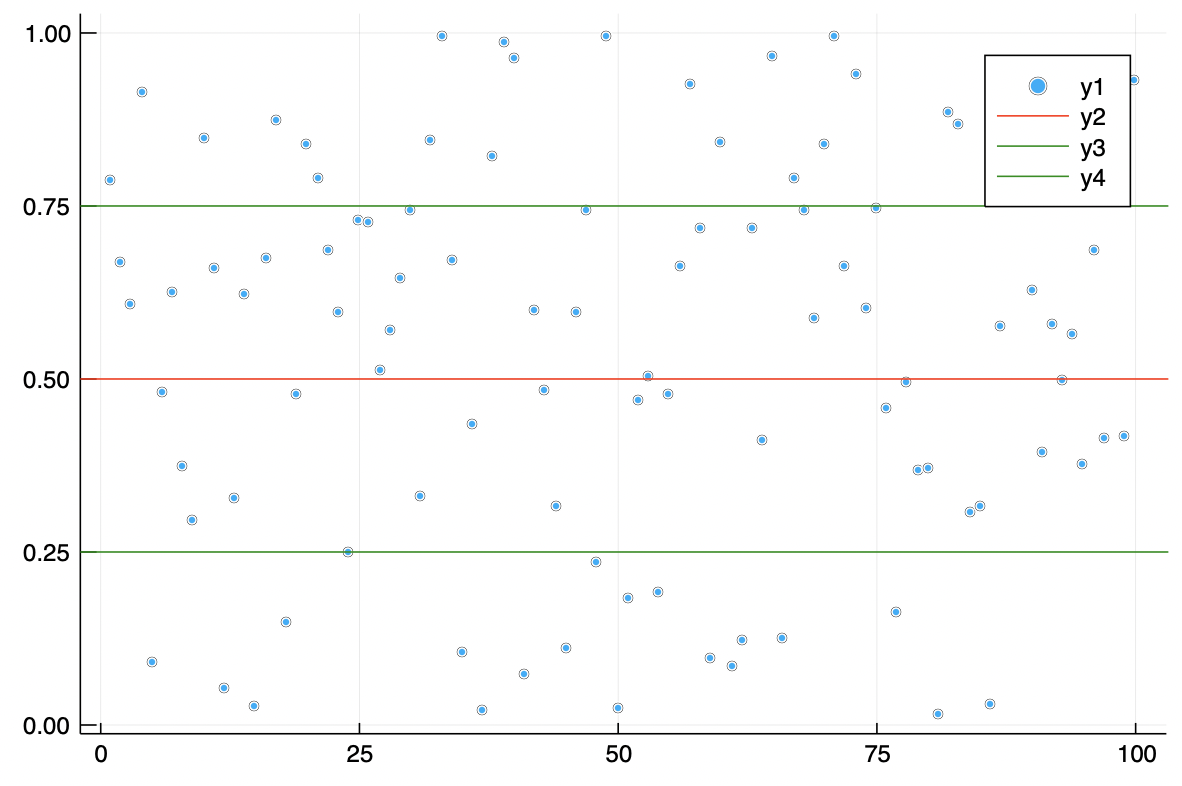
In Plots, columns are series. So to add several series with different attributes use a row vector.
hline!([0.5 0.25 0.75], color=[:red :green :green])
 mkborregaard
on 14 Apr 2020
mkborregaard
on 14 Apr 2020
👍3
thanks!
djsegal
on 14 Apr 2020
Was this page helpful?
0 / 5 - 0 ratings
Related issues
 SebastianM-C
·
4Comments
SebastianM-C
·
4Comments
 kersulis
·
5Comments
kersulis
·
5Comments
 PallHaraldsson
·
4Comments
PallHaraldsson
·
4Comments
 nebuta
·
3Comments
nebuta
·
3Comments
 dancsi
·
4Comments
dancsi
·
4Comments
Most helpful comment
In Plots, columns are series. So to add several series with different attributes use a row vector.