Plots.jl: wrong :letter for some plot recipes
There is an issue with :letter for some recipes that take a single argument. This is because the data of single-argument plots lives on different axes depending on the plot recipe. For instance:
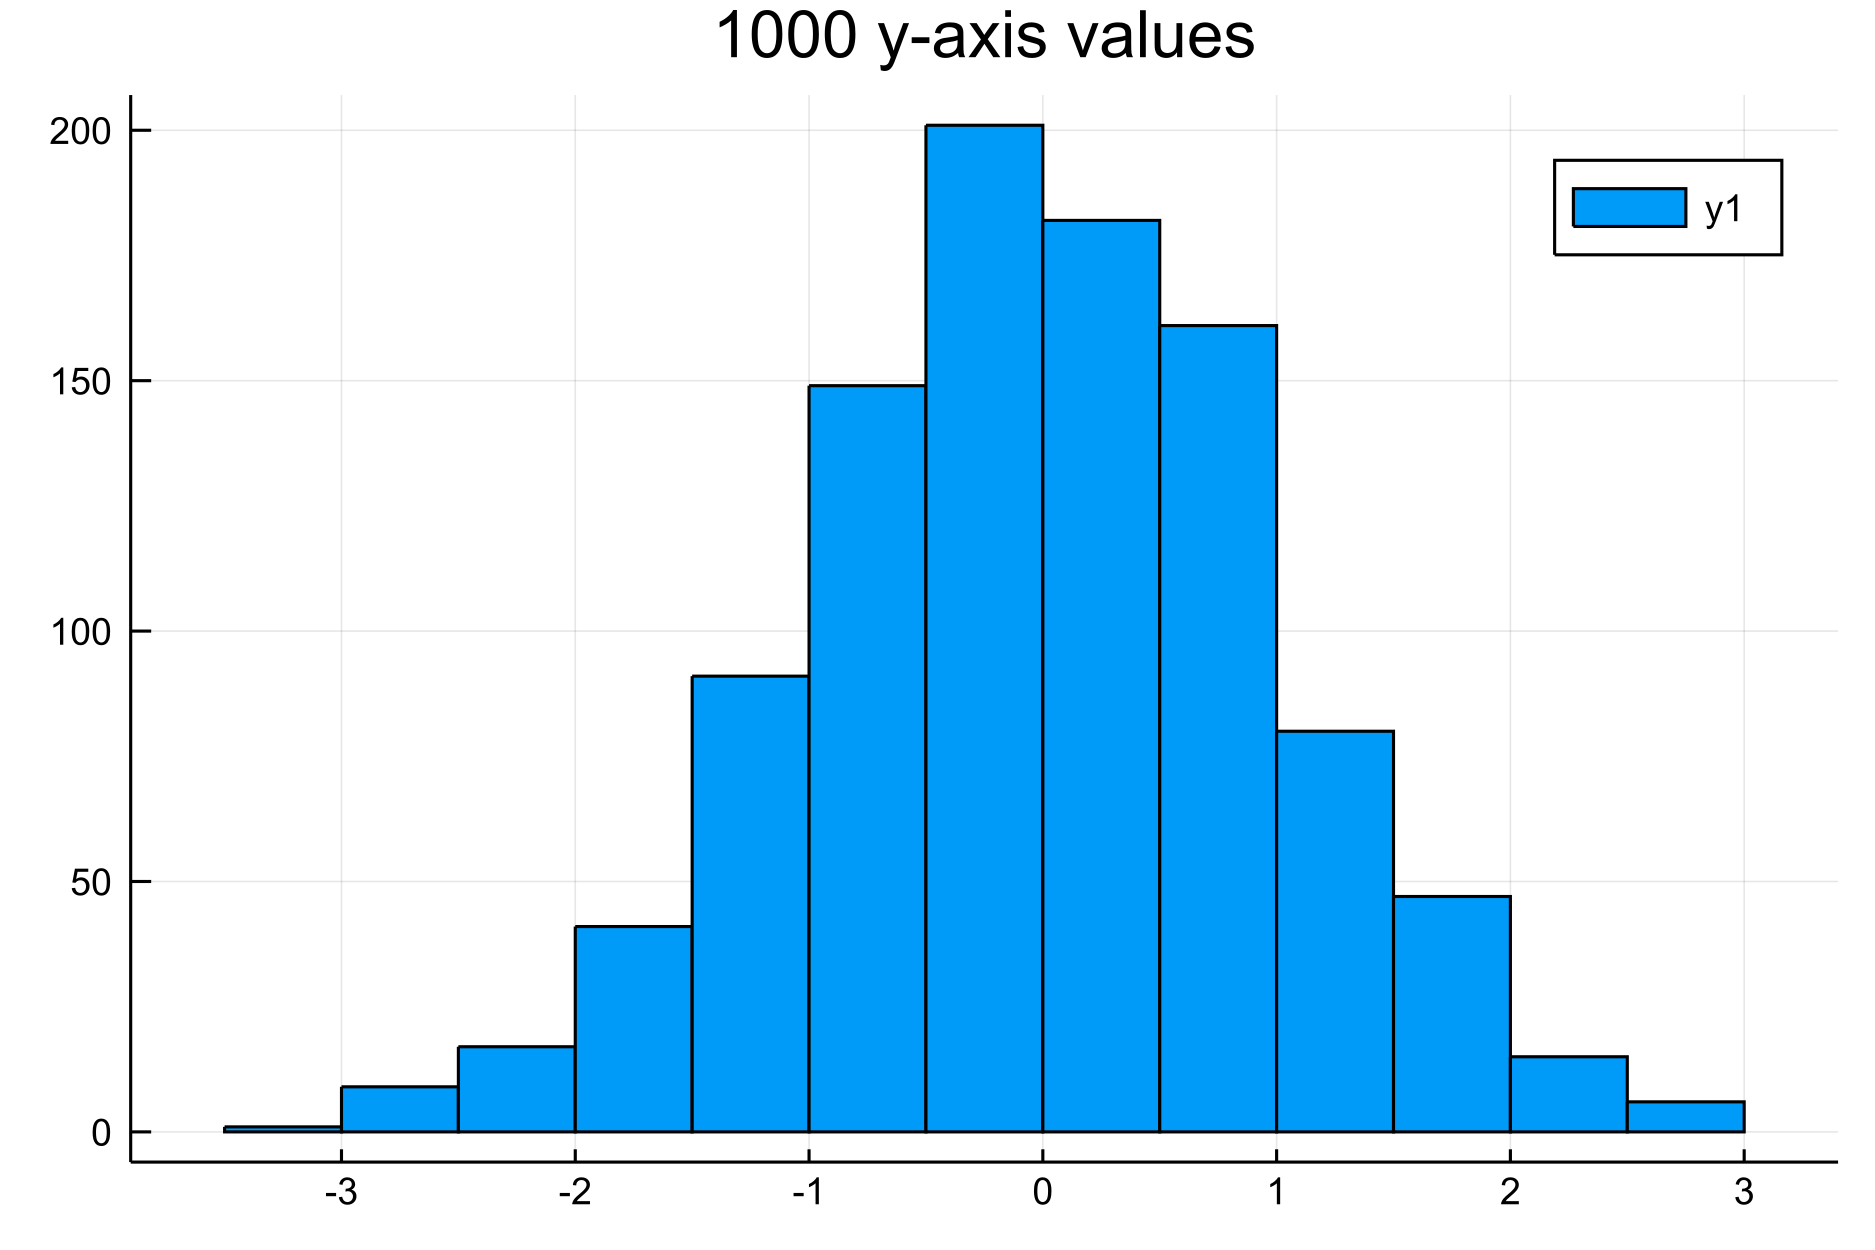
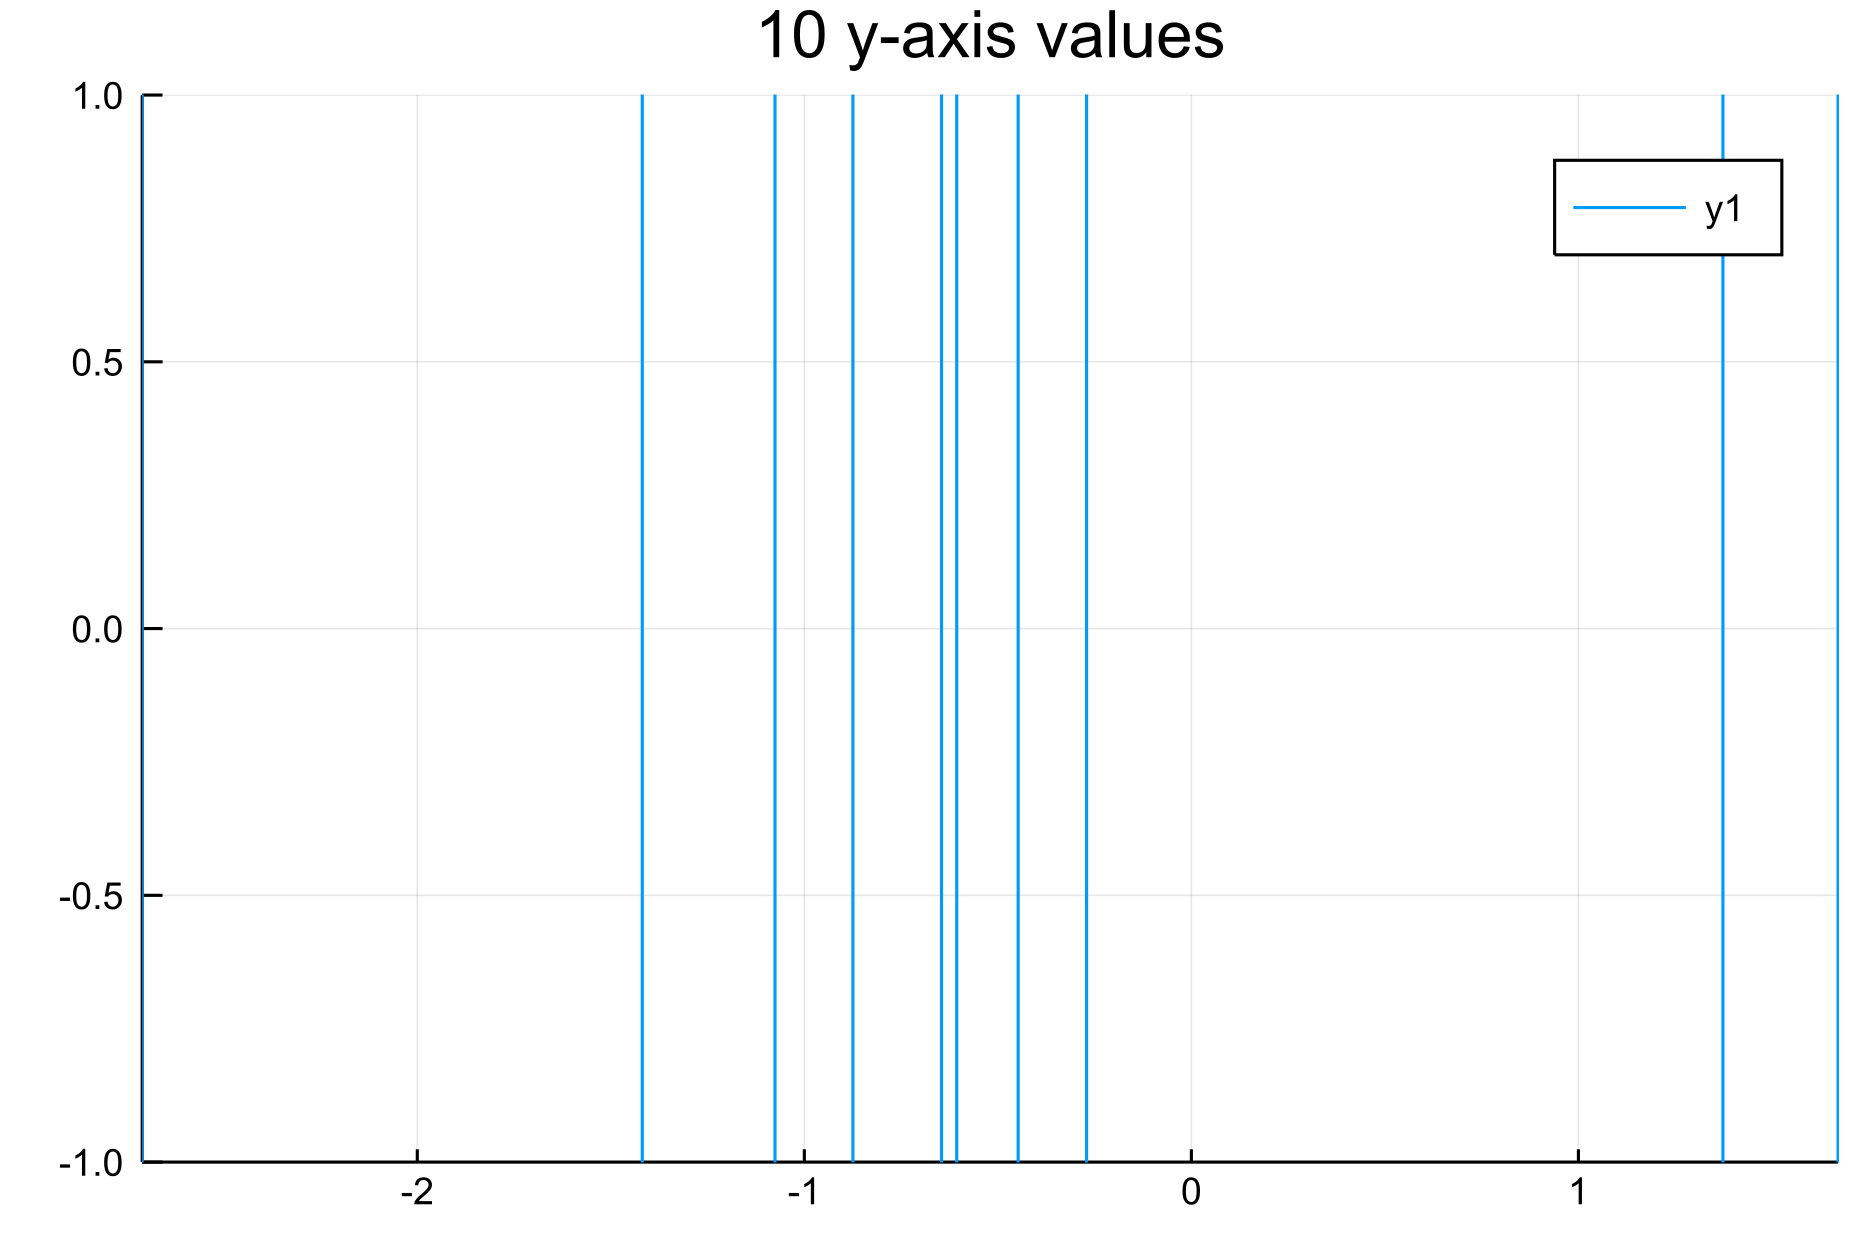
plot(x):xlives in the y axis,:letter == :y✔️histogram(x)orvline(x):xlives in the x axis, but:letter == :y✖️
Maybe there are other similar cases.
To illustrate this with MWEs, take this recipe, which just displays the :letter in the title for MyType arrays:
using Plots, RecipesBase
struct MyType <: Number
    val::Float64
end
value(m::MyType) = m.val
@recipe function f(::Type{T}, m::T) where T <: AbstractArray{<:MyType}
    title --> string(length(m), " ", plotattributes[:letter], "-axis values")
    value.(m)
end
Then
histogram(MyType.(randn(1000)))
gives
and
vline(MyType.(randn(10))
gives
 briochemc
All 7 comments
Yeah, we should find a general solution for that. Maybe some kind of switch_axes trait for seriestypes defined in RecipesBase.
For now a workaround in the recipe would be something like
switch = get(plotattributes, :seriestype, :path) in (:histogram, :vline)
letter = plotattributes[:letter]
if switch
    letter == :x && (letter = :y)
    letter == :y && (letter = :x)
end
Maybe we should rather do this in type recipe processing in Plots, though.
 daschw
on 10 Apr 2020
daschw
on 10 Apr 2020
Yes, I imagined I could do something like that but it seems like you'd rather have this been done for all axis-aware type recipes by default, right? I also don't know all the :seriestype out there that need that switch. Are :histogram and :vline the only ones?
briochemc
on 10 Apr 2020
Yes, thanks for bringing this up! It's probably better if we fix this in Plots.
I think there's also some more histogram-like seriestypes like :stephist.
daschw
on 10 Apr 2020
Could you point out to how I could help with this tiny bug?
briochemc
on 14 Jul 2020
Wouldn't be the best solution to redirect, e.g. vline(x) to plot(x,[], seriestype=:vline)?
And edit the vline recipe accordingly?
 BeastyBlacksmith
on 14 Jul 2020
BeastyBlacksmith
on 14 Jul 2020
I'm sorry if this sounds like a dumb question, but could you clarify how one "redirects" vline(x)? I think I need a bit of hand-holding! 😅
Also, are these changes supposed to happen in Plots.jl? If yes in which files? (The code base of Plots.jl is quite large to me so I often get lost looking for things inside of it.) If not should I be looking at RecipesBase or another package?
briochemc
on 15 Jul 2020
The vline recipe is defined here and the shorthand is defined here.
The @shorthands macro expands to something like vline(args... ;kwargs...) = plot(args... ; seriestype=:vline, kwargs...) and the issue here is that plot(x) is treated like plot(1:length(x), x), so we explicitly need to add a more specific method for the one argument vline that passes its data as x and not as y.
Other workaround might be to simply add letter := :x in the vline-recipe.
BeastyBlacksmith
on 15 Jul 2020
Related issues
 asinghvi17
·
3Comments
asinghvi17
·
3Comments
 lstagner
·
5Comments
lstagner
·
5Comments
 kersulis
·
5Comments
kersulis
·
5Comments
 nebuta
·
3Comments
nebuta
·
3Comments
 tbenst
·
3Comments
tbenst
·
3Comments