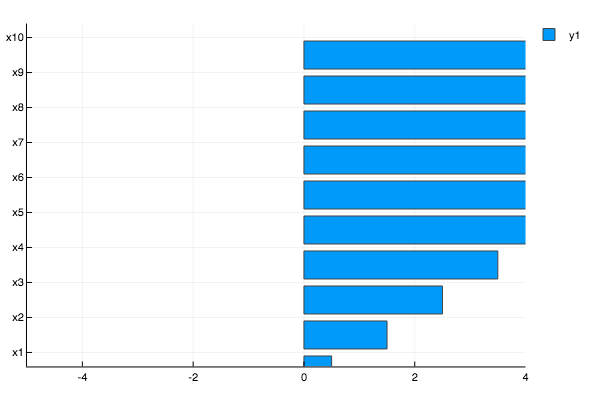
Plots.jl: Horizontal bars broken on Plotly.
using Plots; plotly()
xs = [ "x$i" for i in 1:10 ]
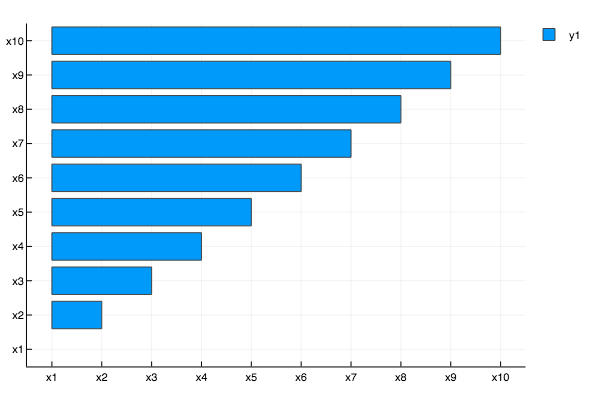
p = bar(xs, -5:4, orientation = :h)
julia> p[1][1][:x]
10-element Array{String,1}:
 "x1"
 "x2"
 "x3"
 "x4"
 "x5"
 "x6"
 "x7"
 "x8"
 "x9"
 "x10"

julia> p[1][1][:y]
10-element Array{Float64,1}:
 0.5
 1.5
 2.5
 3.5
 4.5
 5.5
 6.5
 7.5
 8.5
 9.5
There is also a disagreement with axis[:discrete_values]
julia> p[1][:yaxis][:discrete_values]
10-element Array{Any,1}:
 "x1"
 "x2"
 "x3"
 "x4"
 "x5"
 "x6"
 "x7"
 "x8"
 "x9"
 "x10"

julia> p[1][:xaxis][:discrete_values]
0-element Array{Any,1}
which is making ticks = :native output both x and y as the array `["x1", "x2", ... , "x10"] and gives
Plotly
 apalugniok
>All comments
This was a fun one. It happens in here because the x-axis does not get properly updated when the orientation is horizontal. It affects Plotly/PlotlyJS because they rely on native support for :bar whereas the others (GR, PyPlot, and PGFPlots, at least) use the step recipe.
A fix is on the way!
 wkearn
on 25 Feb 2018
wkearn
on 25 Feb 2018
❤3
Was this page helpful?
0 / 5 - 0 ratings
Related issues
 PallHaraldsson
·
4Comments
apalugniok
·
3Comments
PallHaraldsson
·
4Comments
apalugniok
·
3Comments
 cortner
·
4Comments
cortner
·
4Comments
 kleinschmidt
·
3Comments
kleinschmidt
·
3Comments
 kersulis
·
5Comments
kersulis
·
5Comments
Most helpful comment
This was a fun one. It happens in here because the x-axis does not get properly updated when the orientation is horizontal. It affects Plotly/PlotlyJS because they rely on native support for
:barwhereas the others (GR, PyPlot, and PGFPlots, at least) use thesteprecipe.A fix is on the way!