Plots.jl: Zooming in PlotlyJS does not update the tick marks
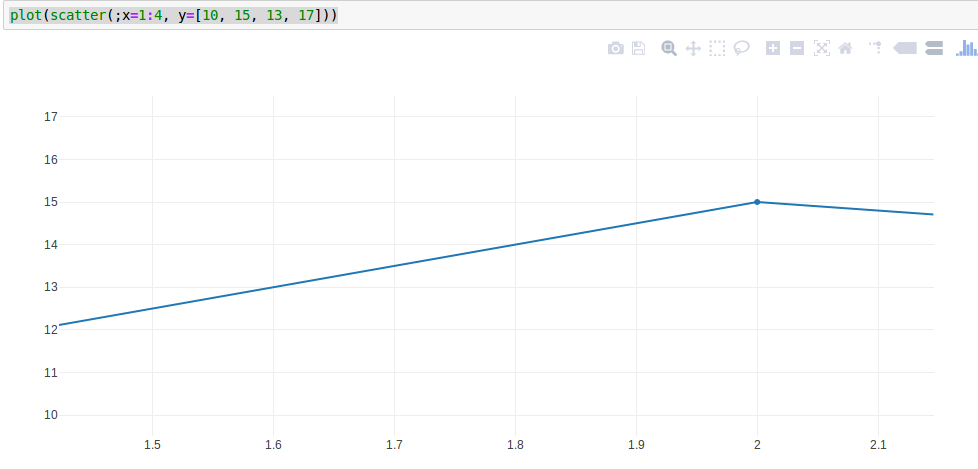
When I zoom in a PlotlyJS.jl plot in a notebook, the axis gains new tick marks (1.5, 1.6, etc.)
using PlotlyJS
plot(scatter(;x=1:4, y=[10, 15, 13, 17]))
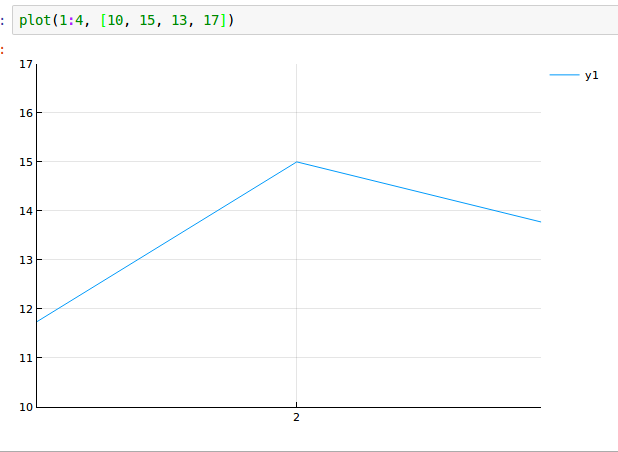
This does not happen if I use Plots.jl to do the same
using Plots
plotlyjs()
plot(1:4, [10, 15, 13, 17])
Zooming further, the x axis gets completely blank.
 cstjean
All 8 comments
This is because Plots calculates its own ticks based on the extent of the data and passes them to Plotly. So it's as if you manually set the ticks in the first example, I guess that's why they don't change upon zooming. I think this would mean that :auto ticks would have to be left to Plotly rather than done by Plots but that would possibly break certain series types like heatmaps which depend heavily on the ticks being calculated by Plots.
 apalugniok
on 7 Feb 2018
apalugniok
on 7 Feb 2018
If you have any work-around to suggest in the meantime, I would take it. Is there any way I can Plots not to provide tick marks?
cstjean
on 7 Feb 2018
Unfortunately, I don't think there is an easy work-around for this Plots behavior 😟... I can't think of any ways of currently stopping Plots from providing ticks.
apalugniok
on 7 Feb 2018
Maybe adding something along the lines of a :native option for ticks would be a way to solve this. For backends that can calculate their own ticks it would stop Plots' ticks from being passed and for the other backends it would act like :auto.
apalugniok
on 15 Feb 2018
I see how that would be cool, but just a quick estimate it might be a little involved to implement in terms of bypassing Plots' axis and ticks code.
 mkborregaard
on 15 Feb 2018
mkborregaard
on 15 Feb 2018
I think I have a quick proof of concept so I'll open a PR 😄
apalugniok
on 15 Feb 2018
Awesome, thank you for all your work @apalugniok !
cstjean
on 25 Feb 2018
Yes, that's a great functionality to have added, really nice work.
mkborregaard
on 25 Feb 2018
Related issues
 SebastianM-C
·
4Comments
SebastianM-C
·
4Comments
 lstagner
·
5Comments
apalugniok
·
3Comments
lstagner
·
5Comments
apalugniok
·
3Comments
 pkofod
·
3Comments
pkofod
·
3Comments
 dancsi
·
4Comments
dancsi
·
4Comments
Most helpful comment
Awesome, thank you for all your work @apalugniok !