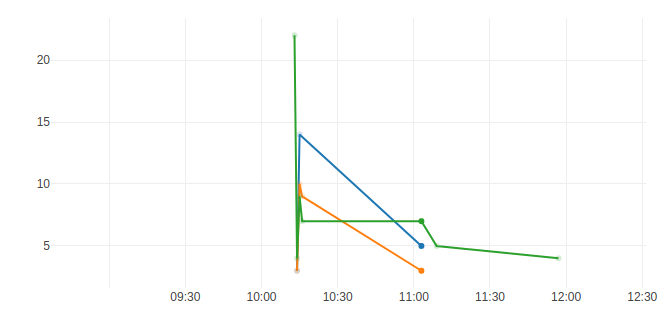
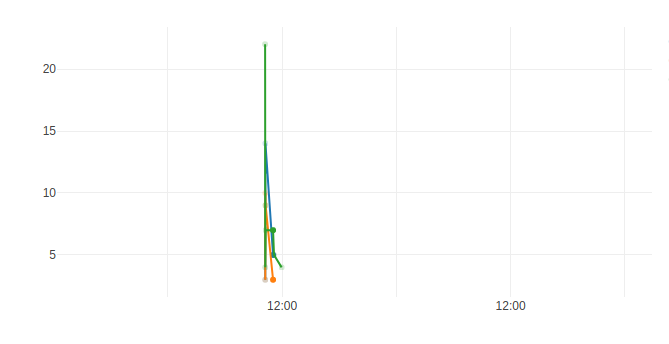
When I use time Axis the left tick is not visible (first picture). Or when i use hour the 0.00 hour or the date (i dont know) is not visible. (second Picture) At the thrird picture eversthing is okay. This problem is everytime in the same date range. I use chrome and firefox
My Version: "plotly.js": "^1.38.2"

 guitar9
All 6 comments
@guitar9 can you make a codepen or other reproducible example? If you're seeing this in a complex page you can pull your figure data out using Plotly.Plots.graphJson(gd) then paste it into a codepen. Thanks!
 alexcjohnson
on 11 Jun 2018
alexcjohnson
on 11 Jun 2018
What is gd? Dont find Plotly.Plots.graphJson(gd) in offical API
guitar9
on 11 Jun 2018
Right, sorry, that's one we haven't officially documented but it's useful in cases like this. gd is "graph div", the DOM element you rendered your plot into. If you just have one Plotly plot on the page you can do gd = document.querySelector('.js-plotly-plot')
alexcjohnson
on 11 Jun 2018
Cant reproduce. What can be the problem? i am using webpack
Codepen
i am importing plotly like this:
import Plotly from "plotly.js/dist/plotly"
Does the dates comes from moment.js? Because i have installed moment.js. Maybe there is some problem with versions
i have uninstalled moment.js but same problem. Maybe some conflicts with bootstrap?
guitar9
on 13 Jun 2018
Thanks for trying it standalone in codepen. The fact that it works there certainly implies either a problem with the build process you're using - though that looks fine to me and usually problems there manifest themselves earlier than this - or an interaction with something else on the page.
Looks to me like the problem is with the class .line we apply to multiline SVG text <tspan> elements. All the single-line labels appear as they should, all the multiline labels disappear. Is it possible you can find the style rule that's hiding (or moving?) these elements, and make it more specific? I suppose if all else fails you could override it with your own super-specific-to-plotly rule like:
.js-plotly-plot .plotly tspan.line { reset whatever's being mucked up }
but it would be much better (more robust and maintainable) to narrow the original rule if possible.
alexcjohnson
on 13 Jun 2018
that was the problem.
I have overriden the class .line.
Can be closed.
guitar9
on 13 Jun 2018
Related issues
 jonmmease
·
3Comments
jonmmease
·
3Comments
 deecay
·
3Comments
deecay
·
3Comments
 tim-sauchuk
·
3Comments
tim-sauchuk
·
3Comments
 archmoj
·
3Comments
archmoj
·
3Comments
 chriddyp
·
3Comments
chriddyp
·
3Comments
Most helpful comment
Thanks for trying it standalone in codepen. The fact that it works there certainly implies either a problem with the build process you're using - though that looks fine to me and usually problems there manifest themselves earlier than this - or an interaction with something else on the page.
Looks to me like the problem is with the class
.linewe apply to multiline SVG text<tspan>elements. All the single-line labels appear as they should, all the multiline labels disappear. Is it possible you can find the style rule that's hiding (or moving?) these elements, and make it more specific? I suppose if all else fails you could override it with your own super-specific-to-plotly rule like:.js-plotly-plot .plotly tspan.line { reset whatever's being mucked up }but it would be much better (more robust and maintainable) to narrow the original rule if possible.