Pfelk: pfSense + Suricata [JSON] Error - pfSense/Suricata messages are truncated
Describe the bug
Issues #91 and #103 issues were isolated and identified an issues with Suricata messages within pfSense being truncated at 1024bytes preventing the full message from being properly filtered.
To Reproduce
Steps to reproduce the behavior:
Install pfELK
Utilizing pfSense
Enabling Suricata Logging in JSON format
Screenshots
Reference issue #91 and #103
Firewall System (please complete the following information):
- pfSense
Elasticsearch, Logstash, Kibana (please complete the following information):
- Version of ELK 7.6.2
Elasticsearch, Logstash, Kibana logs:
N/A - Reference issue #91 and #103
Additional context
Here is an exert from RFC5424 - The Syslog Protocol (https://tools.ietf.org/html/rfc5424).
Paragraph 6.1
Any transport receiver MUST be able to accept messages of up to and
including 480 octets in length. All transport receiver
implementations SHOULD be able to accept messages of up to and
including 2048 octets in length. Transport receivers MAY receive
messages larger than 2048 octets in length. If a transport receiver
receives a message with a length larger than it supports, the
transport receiver SHOULD truncate the payload. Alternatively, it
MAY discard the message.
Paragraph 8.3
Message truncation can be misused by an attacker to hide vital log
information. Messages over the minimum supported size may be
discarded or truncated by the transport receiver. As such, vital log
information may be lost.
In order to prevent information loss, messages should not be longer
than the minimum maximum size required by Section 6.1. For best
performance and reliability, messages should be as small as possible.
Important information should be placed as early in the message as
possible because information at the beginning of the message is less
likely to be discarded by a size-limited transport receiver.
An originator should limit the size of any user-supplied data within
a syslog message. If it does not, an attacker may provide large data
in hopes of exploiting a potential weakness.
RFC3164 - The BSD Syslog Protocol (https://tools.ietf.org/html/rfc3164) also states this, Devices MUST NOT retransmit messages whose received length exceeds 1024 bytes.
Additionally, as specified in the format it SHOULD contained the hostname. pfSense elected not include that part of the RFC either. Not an issue but results in two separate filters within 01-inputs.conf to delineate between pfSense and OPNsense.
Based on RFC 5424 the reasoning or rational appears to be for security mitigation to of an exploitable weakness. This part of the RFC has long been ignored until recently as it was codified within the RFC in 2009 (RFC5424) and 2001 (RFC3154); I suspect it will not be long before OPNsense implements.
 a3ilson
All 55 comments
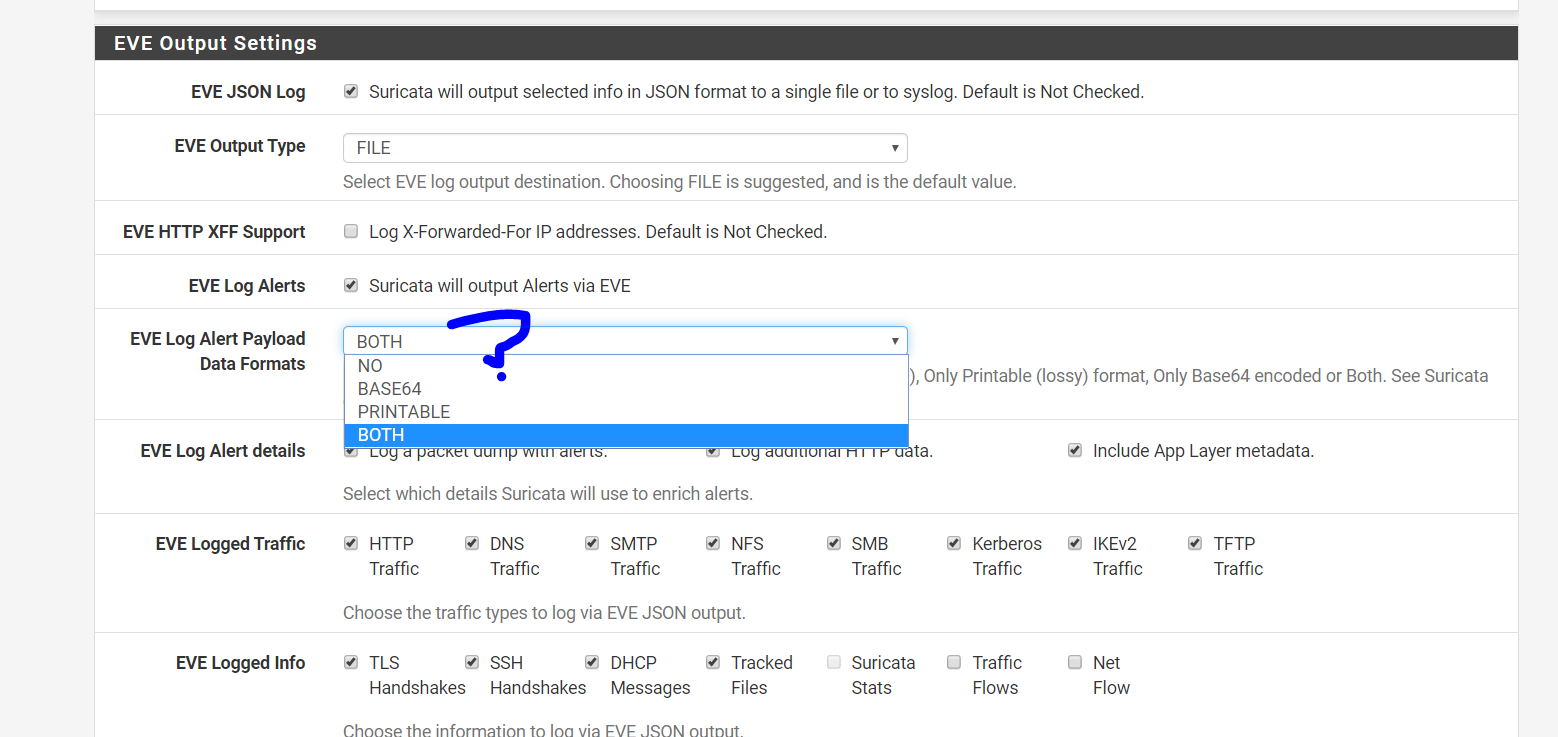
could be too much info is sent on the suricata frame becasue of this setting?
 myrsecurity
on 27 Apr 2020
myrsecurity
on 27 Apr 2020
its possible, i don't use suricata - but it seems reasonable that since logstash parses readable text, you wouldn't need to send anything in base 64
 revere521
on 27 Apr 2020
revere521
on 27 Apr 2020
Hi there, any further news on this issue? Just did a brand new installation of pfELK and got git by the exactly the same issue as the original #103 - Firewall Dash is working but not Suricata. I'm happy to help with any info you may require.
-S
 dsantanu
on 23 Jun 2020
dsantanu
on 23 Jun 2020
@dsantanu - Unfortunately, this issue is not related to pfELK but rather pfSense as they've adhered to the referenced RFCs. As of today (22 June 2020) it is working with OPNsense but suricata messages are still truncated by pfSense and unable to be properly parsed.
I have not pursued a work around but have a couple of ideas. One of which will be writing the remote syslog to a file and reading the subsequent file from logstash. However, this will add latency... I have some time off in July and plan to explore an alternate solution but welcome any inputs, suggestions or assistance. I currently utilize a separate instance to monitor traffic (tapped connection) leveraging suricata which might be the most practical solution.
Thanks for the inquire!
a3ilson
on 23 Jun 2020
I just used syslog-ng as you described above as a workaround. I don’t see any additional overhead or log latency.
The following example uses a wildcard pattern to find any files in subdirectories called eve.json. You can probably remove the program/host overrides if not needed for your scenario.
Object Type: Source:
Object Name: Suricata
Object Parameters:
.
{
wildcard-file(
base-dir("/var/log/suricata")
filename-pattern("eve.json")
recursive(yes)
follow-freq(1)
program-override("suricata")
host-override("10.10.10.10")
flags(no-parse)
);
};
Object Type: log
Object Name: Suricata
Object Parameters:
.
{
source(Suricata);
destination(Suricata);
};
Object Type: Destination
Object Name: Suricata
Object Parameters:
.
{
tcp("syslog.gslb.mydomain.local"
port(5544)
failover( servers("10.10.10.25", "10.10.10.26") )
);
};
 TehMuffinMoo
on 23 Jun 2020
TehMuffinMoo
on 23 Jun 2020
@dsantanu - Unfortunately, this issue is not related to pfELK but rather pfSense as they've adhered to the referenced RFCs. As of today (22 June 2020) it is working with OPNsense but suricata messages are still truncated by pfSense and unable to be properly parsed.
I know it's not really a pfELK issue, I was only asking if we have figured out a workaround yet. I asume it's gonna be the same (or similar) for Snort as well?
Thanks for your suppot (and the good work).
dsantanu
on 23 Jun 2020
I just used syslog-ng as you described above as a workaround. I don’t see any additional overhead or log latency.
Could you post a bit more details about that pls? I'm not that expert with ELK and need some assistance with the info like where should I put in those scripts etc. A mini-howto probably will help a lot of others.
dsantanu
on 23 Jun 2020
Pre-Requisites
The PfElk solution doesn't configure a TCP listener in logstash. You will need to create another configuration file in "/data/pfelk/configurations" called something like "01-inputs-custom.conf" and add the following;
````
01-inputs-custom.conf
input {
tcp {
port => 5544
}
}
````
And restart logstash;
systemctl restart logstash
Configure Suricata
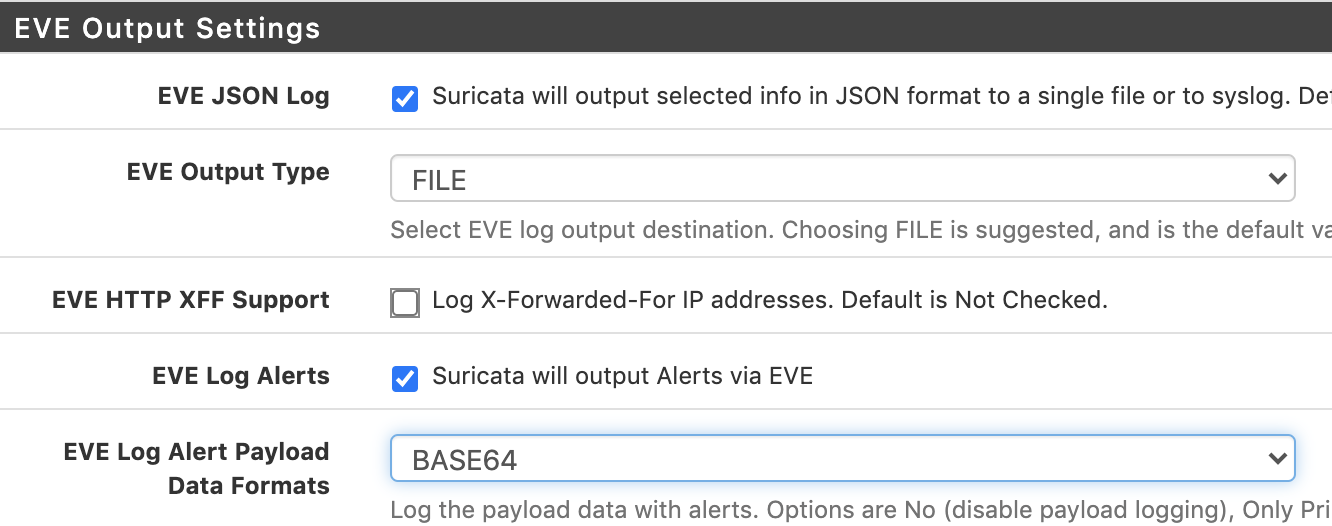
In the Suricata configuration, the only thing you should need to change is the EVE Output Type from Syslog to File. This will start writing logs to a local file on your PfSense system, which we can then use Syslog-NG to read and forward on.

Install Syslog-NG Package in PfSense
You will want to install the Syslog-NG package from PfSense's package library.

Once installed, go to Syslog-NG under the services menu dropdown

Configure Syslog-NG
- Enable Syslog-NG
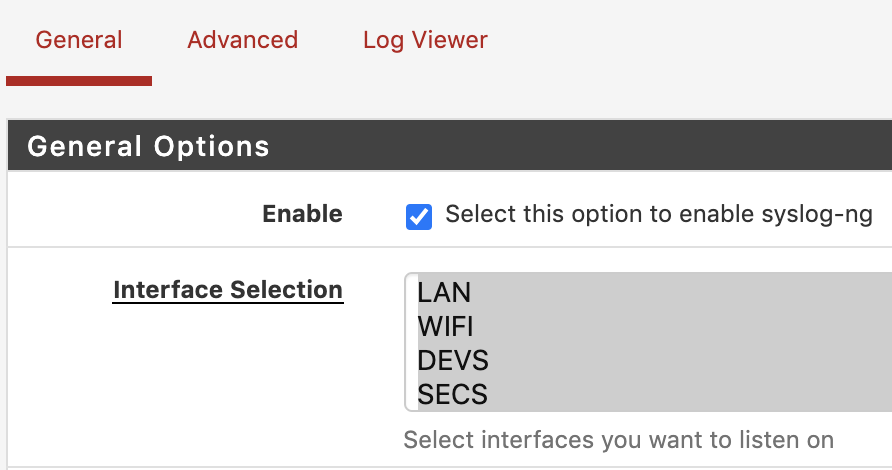
On the General tab, tick the option to enable Syslog-NG and save the configuration. The rest of the settings here don't matter as we won't be receiving logs with Syslog-NG.

- Go to the "Advanced tab"
Syslog-NG is comprised of three components. An input, processor and output.

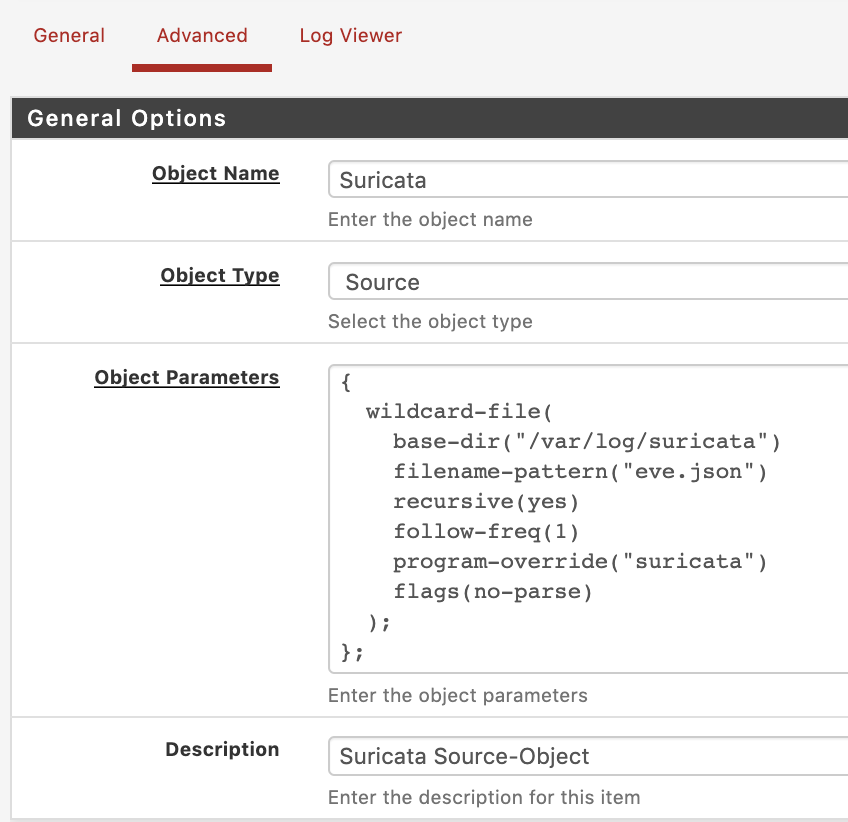
The following example uses a wildcard pattern to find any files in subdirectories called eve.json. You can probably remove the program-override option if not needed for your scenario. This simply tags the "program" field in logstash with "suricata".
- Add a new object using the "Add" button. Set the name to "Suricata", the Object Type as "Source" and populate with the code included below.
Object Type: Source
Object Name: Suricata
Object Parameters:
{
  wildcard-file(
    base-dir("/var/log/suricata")
    filename-pattern("eve.json")
    recursive(yes)
    follow-freq(1)
    program-override("suricata")
    flags(no-parse)
  );
};

- Add another object, this time as an object type of "Log".
The "Log" object ties the Source->Destination together. (Processor)
Object Type: Log
Object Name: Suricata
Object Parameters:
{
    source(Suricata);
    destination(Suricata);
};

- Add the final object, this time as an object type of "Destination"
The destination object specifies the output, this could be file, elasticsearch, syslog etc.
Object Type: Destination
Object Name: Suricata
Object Parameters:
{
   tcp("syslog.gslb.mydomain.local"
   port(5544)
   failover( servers("10.10.10.25", "10.10.10.26") )
   );
};

That's it! Should just pick up your logs and send them on to PfElk.
I wrote this up quick, so any issues let me know! :)
TehMuffinMoo
on 23 Jun 2020
wow!! thanks @TehMuffinMoo !!
that was really quick and super-impressive. Just fighting another fight at work but will give it a try the first chance I get. I'll update here...
-S
dsantanu
on 23 Jun 2020
Just one thing: If you ae introducing a new TCP port, don't we need to change/update the Remote log servers in the _System Log_ with the new port?
dsantanu
on 23 Jun 2020
Just one thing: If you ae introducing a new TCP port, don't we need to change/update the Remote log servers in the _System Log_ with the new port?
Remote log servers can be left as-is, this will only pick up system events and not those from Suricata. So you won't get any issues with duplicate logs or anything!
All your other system logs will continue to be shipped via UDP as they are currently, the TCP port would simply be used for Suricata only. (Or anything else you may want to use Syslog-NG for!)
It's worth noting that I use TCP/UDP/5544, the port really doesn't matter so you can use what you want here. I think PfElk sets a default listener on logstash to UDP/5140, so you could use TCP/5140 if you wanted to keep consistent.
Edit: Also, the failover( servers("10.10.10.25", "10.10.10.26") ) option on the destination can be removed if you only need to be able to send to one server. Leaving it like this;
{
   tcp("syslog.gslb.mydomain.local"
   port(5544)
   );
};
TehMuffinMoo
on 23 Jun 2020
also, _mydomain.local_ in tcp("syslog.gslb.mydomain.local" should be changed accordingly, I assume?
And with the removal of the _failover(...)_ line, where are we mentaining about the destination_server (i.e. pfELK host) address?
dsantanu
on 23 Jun 2020
Yep, you change that accordingly. This would be hostname/IP of your PfELK, the failover option just allows me to set additional addresses.
“Syslog.gslb.mydomain.local” would be my PfELK instance
Hope this makes sense!
TehMuffinMoo
on 23 Jun 2020
@dsantanu - Unfortunately, this issue is not related to pfELK but rather pfSense as they've adhered to the referenced RFCs. As of today (22 June 2020) it is working with OPNsense but suricata messages are still truncated by pfSense and unable to be properly parsed.
I know it's not really a pfELK issue, I was only asking if we have figured out a workaround yet. I asume it's gonna be the same (or similar) for Snort as well?
Thanks for your suppot (and the good work).
This does not appear to affect Snort at all (i use pfsense + snort with no issues) The snort log messages appear to be much smaller
revere521
on 23 Jun 2020
This does not appear to affect Snort at all (i use pfsense + snort with no issues) The snort log messages appear to be much smaller
The reason I try to stay away of Snort, a) it is/was single threaded (I think v3.x has some sort of multi-threaded capabilities) and b) owned by Cisco, which doesn't seem to be a very opensource friendly. I'll give Snort a try if Suricata still doesn't work
dsantanu
on 23 Jun 2020
@TehMuffinMoo looks like something still missing for me. These are my settings now:
pfSense: Suricata
pfSense: Syslog-ng
General
Advanced: Source
Advanced: Destination
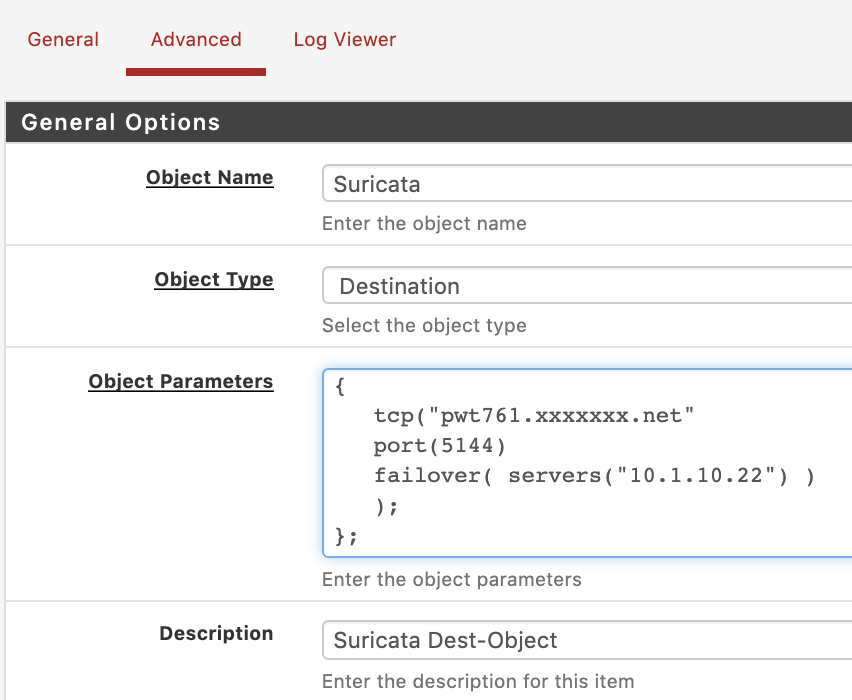
Advanced: Log
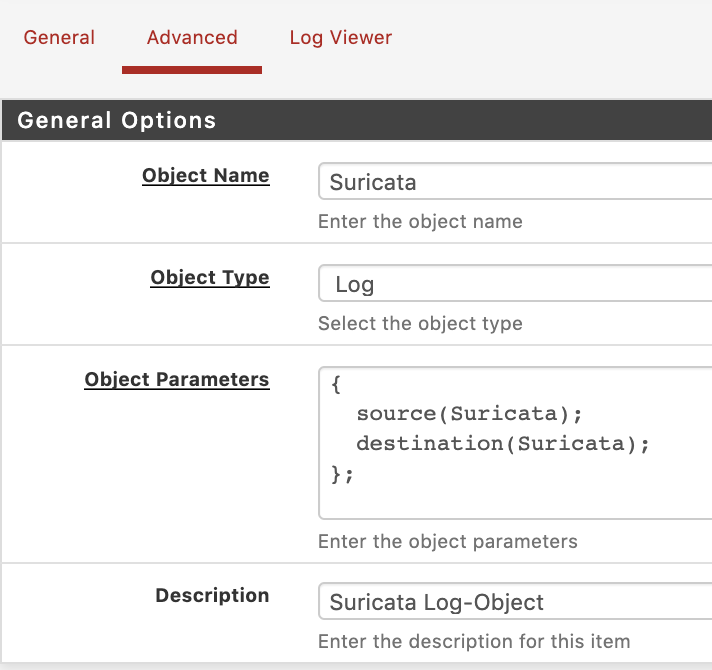
I've used port 5144 instead and my dest-server and faiover-server are the same (just in case DNS-name fails, will go for the IP address) and pfSense has full access to it:
[2.4.5-RELEASE][[email protected]]/root: nc -zv 10.1.10.22 5144
Connection to 10.1.10.22 5144 port [tcp/*] succeeded!
On the pfELK box, I added the TCP block in the 01-inputs.conf itself, other than creating another file:
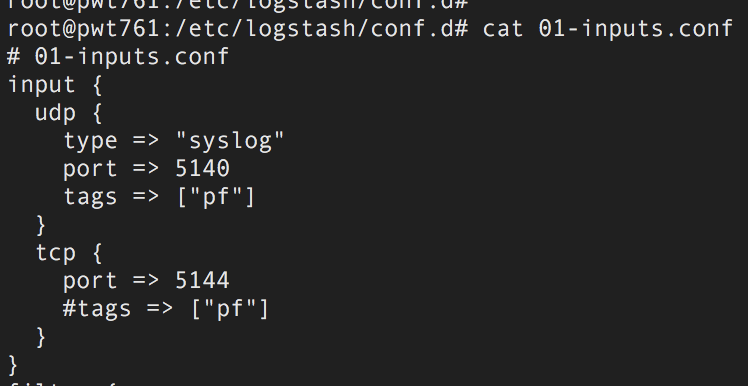
and then restarted logstash - all went okay up until here.
On the KIBANA GUI, I've now 320 fields:
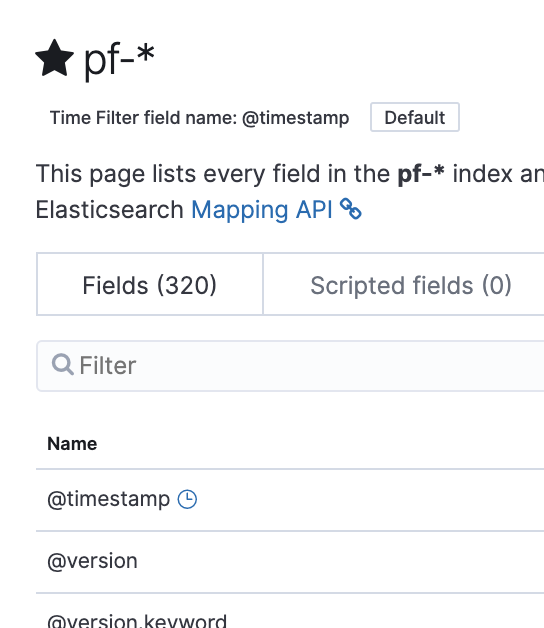
But the Suricata Dashboard still gives me the same blank page, apart from the Count:
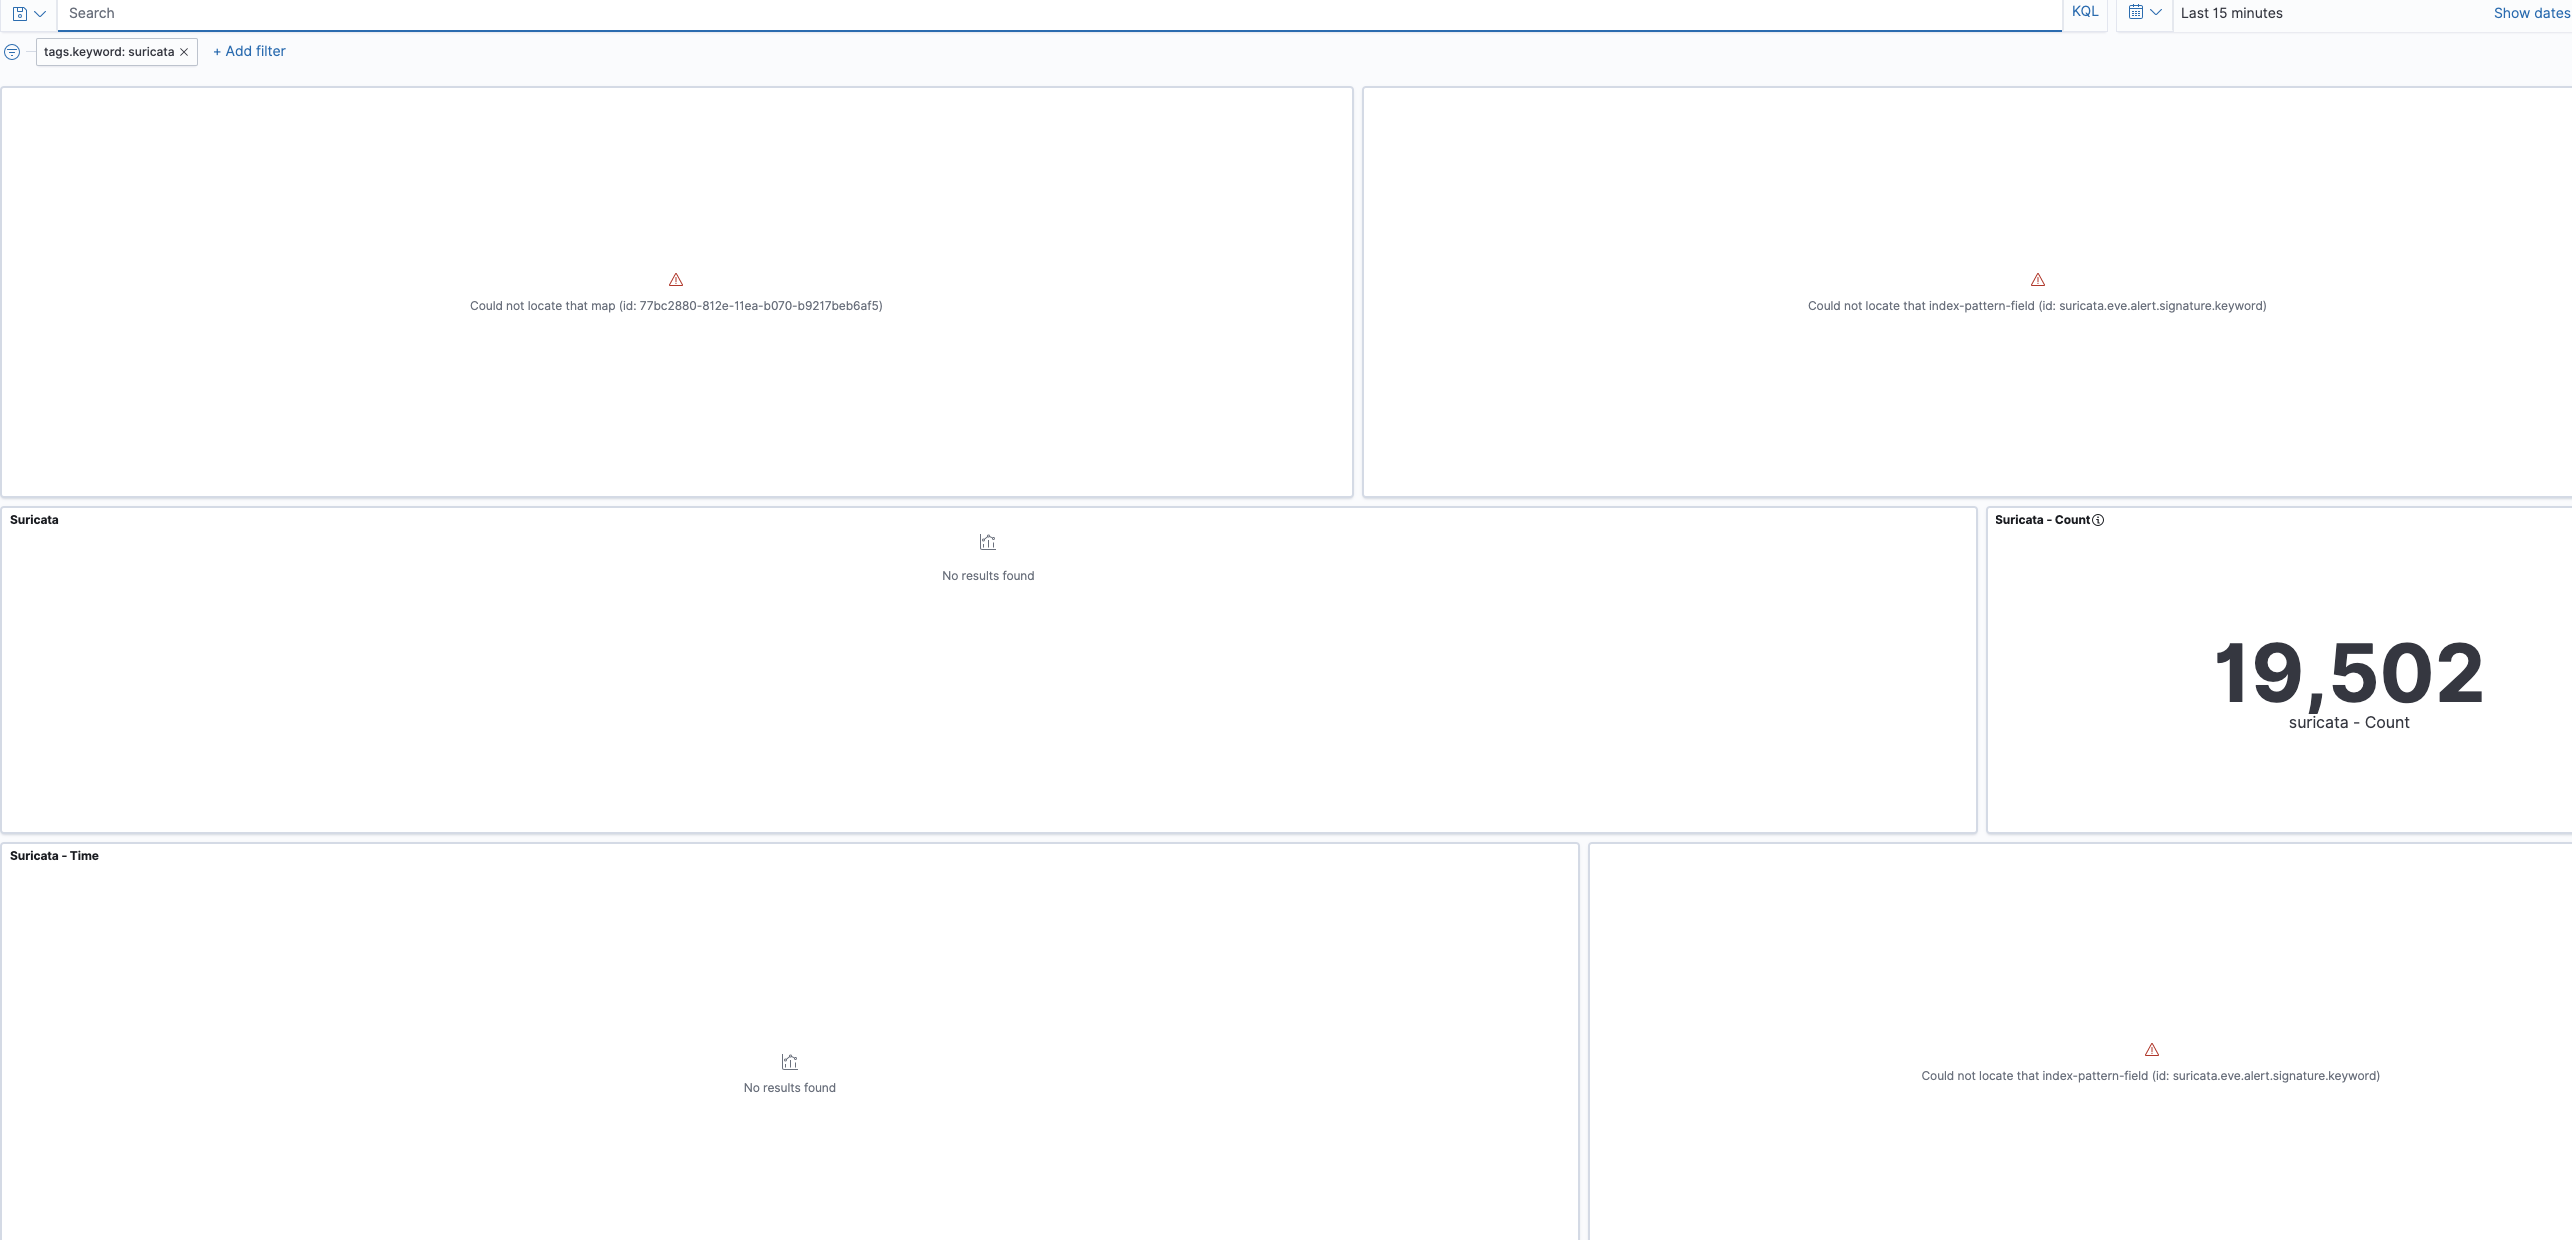
What am I still missing?
dsantanu
on 23 Jun 2020
So I use another option I omitted from here which is host-override.
You may or may not need it, can you check the discover page and see what the “host” field is showing as for your logs?
I think PfELK input has you specify an IP to match, but Syslog-NG I think sends it’s hostname.
If this is the case you can either;
- Change the statement
if [host] ~= ....to match the hostname instead
Or
- In your destination object in Syslog-NG, specify this option to override the host field before the no-parse flag;
host-override("YourPfsenseIP")
TehMuffinMoo
on 23 Jun 2020
Oh, I just had a proper look at your screenshots. I think the dashboards are pointing at an non-existent index pattern.
I’m not sure how the PfELK scripted installs handle importing dashboards, I think when I grabbed them I had to swap the index pattern IDs for the dashboards to point to the ones I had created.
I can probs help you with doing this too if you need it.
TehMuffinMoo
on 23 Jun 2020
Never wanted to bother you with all of these issues but would be very much delighted if can make use a bit more of your help.
Just one thing noticed: Looks like data is actually coming:
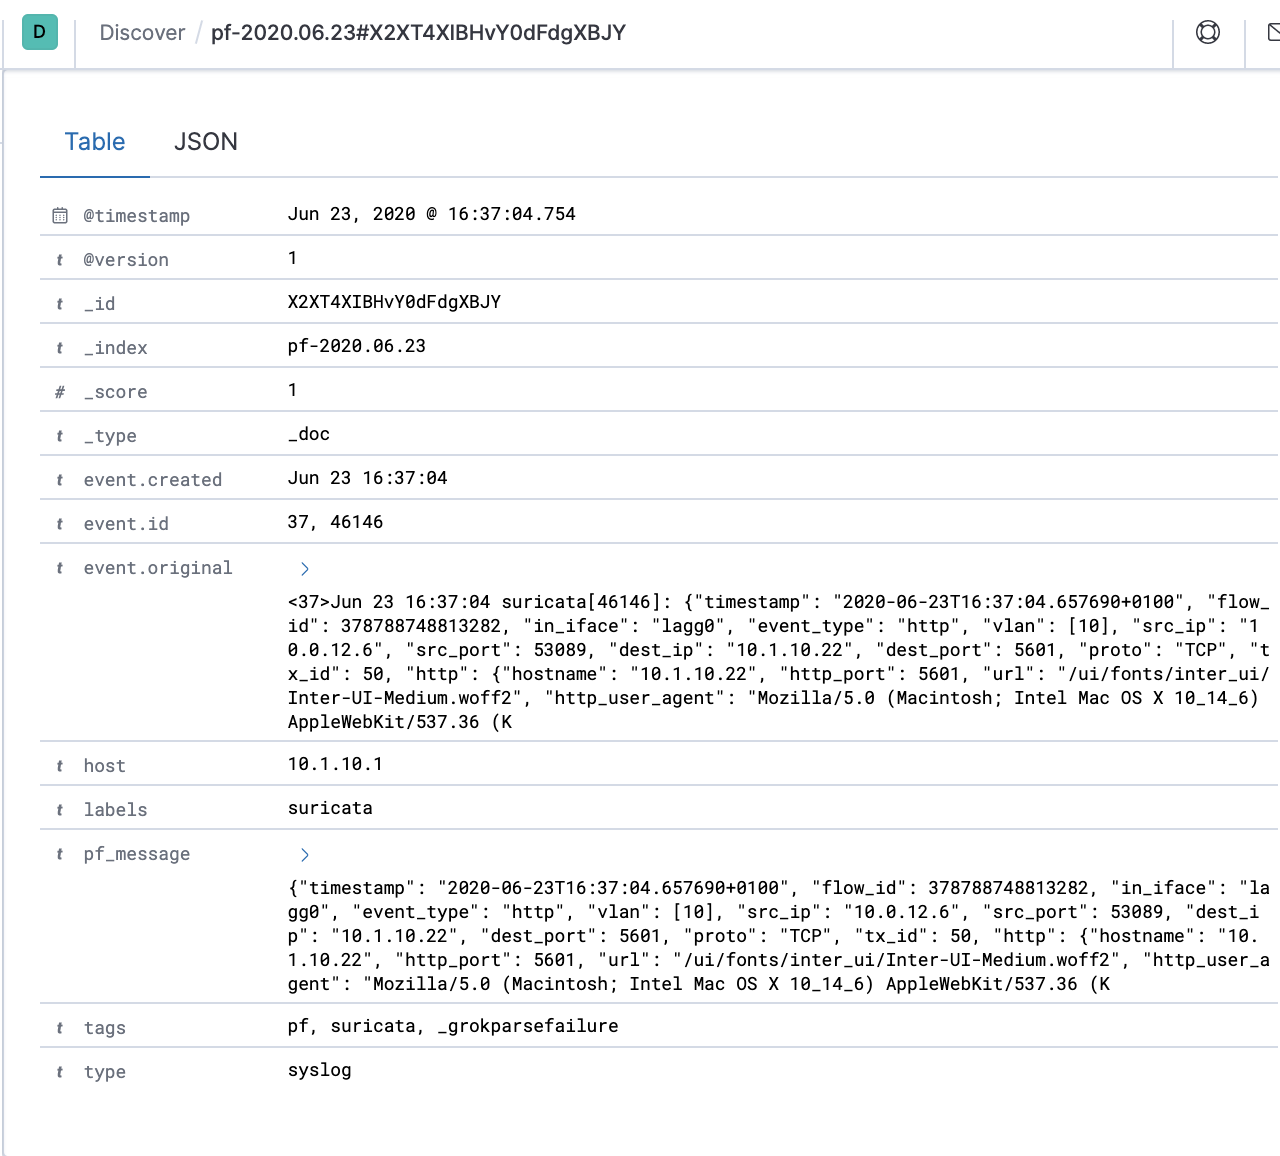
but still very much truncated. Also it says type == syslog - is it right?
The Host, in the data-set, is my pfSense box.
-S
dsantanu
on 23 Jun 2020
@dsantanu & @TehMuffinMoo
This is awesome! Thanks for providing screenshots and a solution!
I'd like to incorporate and include into pfELK and will test/validate in early July when I have some spare time but feel free to submit your guide/solution.
So it is receiving suricata logs from pfSense but based on your configuration nothing is being enriched. Referencing the info graphic  the logs are received but all enriching is omitted passing from 01-inputs.conf to 50-outputs.conf.
The first enrichment point occurs in 01-inputs.conf (line 27) if the 'pf' tag is not present then no further enriching occurs. However, it appears based on your screenshot that the tag was added. Unfortunately, since the log is sent from suricata (file) and not syslog/syslog-ng which truncates the message it is missing elements needed to match the initial grok pattern from line 33.
@dsantanu - can you provide the raw text outputs (event.original) for a dozen or so events. That should be sufficient for me to revise and tweak an update filter.
a3ilson
on 23 Jun 2020
I think I had to fiddle with the filter myself, I’ll send over a snippet of mine shortly..
Also, I did add one additional field you could probably roll up into your next update. I use vlans and like to have a separate field for vlan, instead of interface.vlan in one field.
Maybe a preference thing, but I like to search by interface and vlan individually!
I’ll be back..
TehMuffinMoo
on 23 Jun 2020
@dsantanu - can you provide the raw text outputs (event.original) for a dozen or so events. That should be sufficient for me to revise and tweak an update filter.
Sorry for my ignorance: How do i do that? Do you mean this?
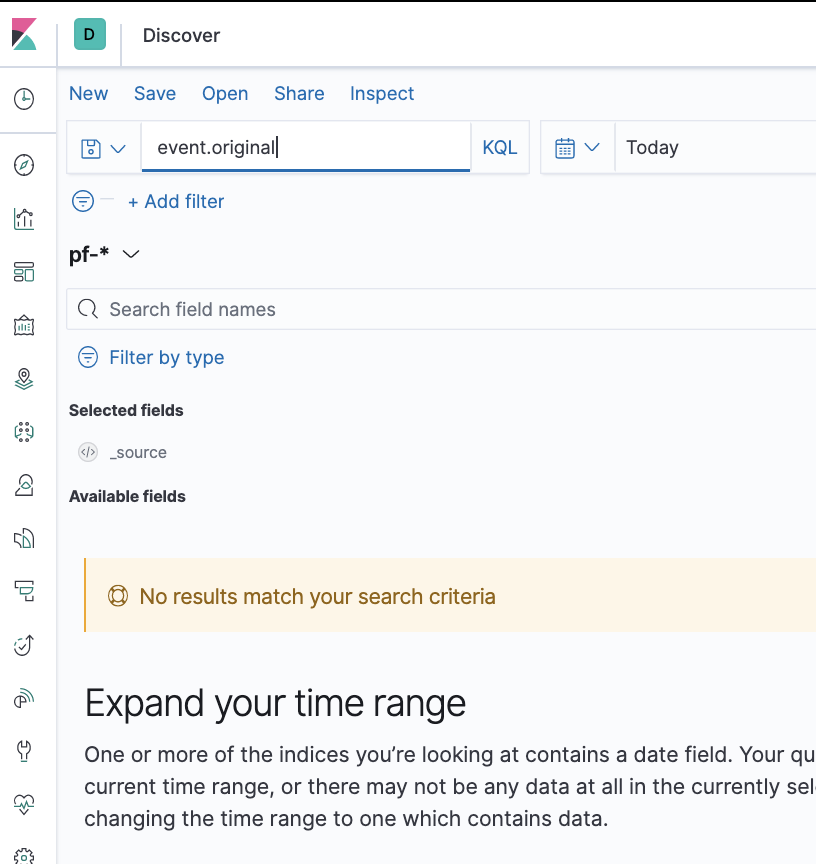
In that case, it's saying "No data found"!! Definately doing something wrong, I believe??
dsantanu
on 23 Jun 2020
If you just leave the search filter blank, and add “event.original” to the fields list on your left. This should do it.
I definitely made a change to my filter, just found it.. though from a quick look at your last screenshot with an event it doesn’t look like this would be your issue.
Raw events are a good start though!
TehMuffinMoo
on 23 Jun 2020
Syslog-NG shouldn't be truncating anything as it's using TCP, as you can see I get events much higher than that of the 1024 byte limit;

TehMuffinMoo
on 23 Jun 2020
right! now need to figure out why it doesn't like me.....
dsantanu
on 23 Jun 2020
@a3ilson, is this enough or what you wre looking for?
event.ORGL.xlsx
dsantanu
on 23 Jun 2020
Ah.... I know why it could be.
I suspect you're still getting logs from PfSense internal logging..
Can you check this is unticked ?

And then just restart Suricata on each of your interfaces it's applied to?
Edit: If this gives you the full logs, I suspect you'll need to modify your filter to allow the additional field added by Syslog-NG;
You would need to replace the match line in 01-inputs.conf from this;
filter {
  if "pf" in [tags] {
   grok {
     match => { "message" => "<(?<[event][id]>.*)>%{SYSLOGTIMESTAMP:[event][created]} %{DATA:labels}(?:\[%{POSINT:[event][id]}\])?: %{GREEDYDATA:pf_message}" }
...
To this;
filter {
  if "pf" in [tags] {
   grok {
     match => { "message" => "<(?<[event][id]>.*)>%{SYSLOGTIMESTAMP:[event][created]}\s+(%{HOSTNAME:[hostname]}\s+)?%{DATA:labels}(?:\[%{POSINT:[event][id]}\])?: %{GREEDYDATA:pf_message}" }
...
TehMuffinMoo
on 23 Jun 2020
@a3ilson, is this enough or what you wre looking for?
event.ORGL.xlsx
Yeah these are still the original truncated events from pfsense.
TehMuffinMoo
on 23 Jun 2020
@TehMuffinMoo spot-on re. Suricata log!! Now it's not truncated:
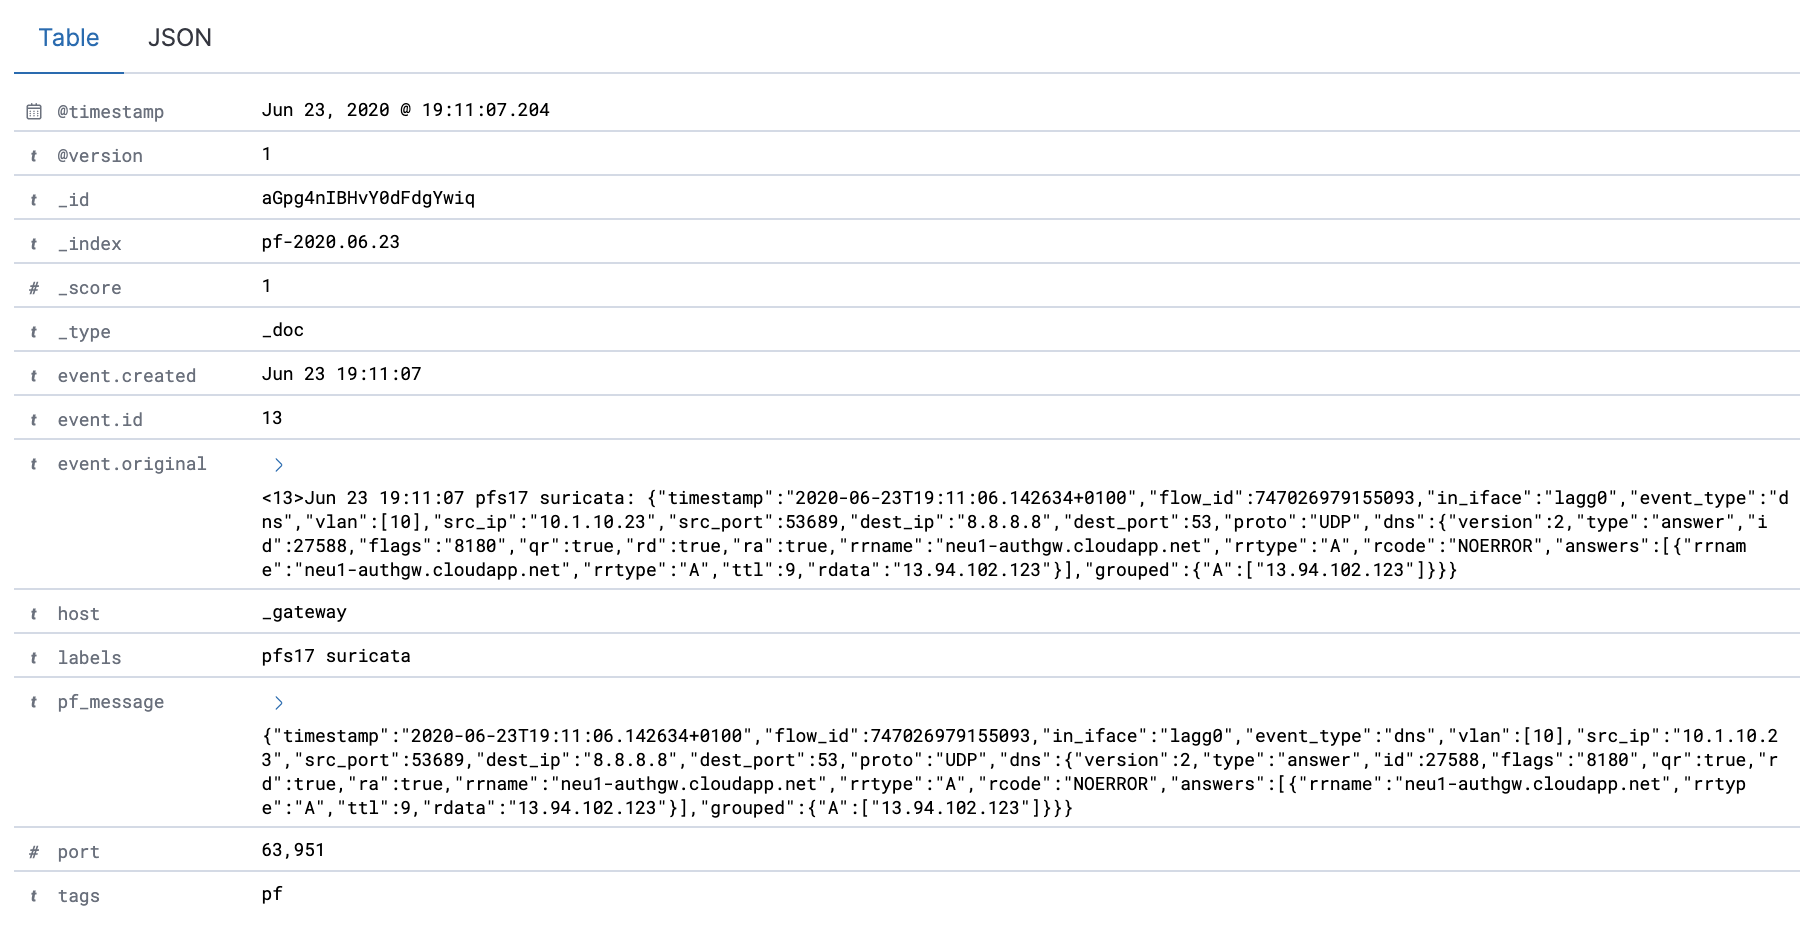
But Host says _gateway - should it be like that? and the Dashboard is still empty, apart from the Count.
dsantanu
on 23 Jun 2020
Yeah these are still the original truncated events from pfsense.
hang on.............. @TehMuffinMoo just managed me to get the full log. I'll do another event logs for you in 5/10 mins
dsantanu
on 23 Jun 2020
Edit: If this gives you the full logs, I suspect you'll need to modify your filter to allow the additional field added by Syslog-NG;
You would need to replace the match line in 01-inputs.conf from this;
filter {
  if "pf" in [tags] {
   grok {
     match => { "message" => "<(?<[event][id]>.*)>%{SYSLOGTIMESTAMP:[event][created]} %{DATA:labels}(?:\[%{POSINT:[event][id]}\])?: %{GREEDYDATA:pf_message}" }
...
To this;
filter {
  if "pf" in [tags] {
   grok {
     match => { "message" => "<(?<[event][id]>.*)>%{SYSLOGTIMESTAMP:[event][created]}\s+(%{HOSTNAME:[hostname]}\s+)?%{DATA:labels}(?:\[%{POSINT:[event][id]}\])?: %{GREEDYDATA:pf_message}" }
...
See my edit here, I can now see the hostname field populated in your event (pfs17). You'll need to apply the change to the filter and you should be good to go!
TehMuffinMoo
on 23 Jun 2020
But
Hostsays _gateway - should it be like that? and the Dashboard is still empty, apart from the Count.
Yeah this might relate to my earlier comment around you might need to use the host-override parameter in Syslog-NG to override it in logstash;
{
  wildcard-file(
    base-dir("/var/log/suricata")
    filename-pattern("eve.json")
    recursive(yes)
    follow-freq(1)
    program-override("suricata")
    host-override("YourPfSenseIP")        <<<<<<<<<
    flags(no-parse)
  );
};
TehMuffinMoo
on 23 Jun 2020
@a3ilson, is this enough or what you wre looking for?
event.ORGL.xlsxYeah these are still the original truncated events from pfsense.
Yes, but the messages are truncated...once your able to get it configured with the assistance of @TehMuffinMoo...it may be working without any further adjustments.
@TehMuffinMoo - based on this revision...were you able to get the suricata dashboard to populate?
a3ilson
on 23 Jun 2020
yeepeee!!!! atleast some of the Suricata Dashboard items are now being populated, apart from the
map:

and Signatures by Country:

maps works perfectly okay for Firewall Dashboard though. More things to edit/add?
dsantanu
on 23 Jun 2020
@a3ilson, is this enough or what you wre looking for?
event.ORGL.xlsxYeah these are still the original truncated events from pfsense.
Yes, but the messages are truncated...once your able to get it configured with the assistance of @TehMuffinMoo...it may be working without any further adjustments.
@TehMuffinMoo - based on this revision...were you able to get the suricata dashboard to populate?
Logs were still truncated due to a checkbox, this has been fixed so OP is now getting full logs.
Syslog-NG appends an additional hostname field to the log event, hence the need to change the filter to accommodate. It’s optional though, so should still work without using Syslog-NG!
In terms of using your dashboards, I’m pretty sure I had to manually edit the dashboards to point to the new unique identifier of my index pattern, as it was still associated with yours. I’m not skilled enough in this area to know if there’s a way to have it dynamically attach itself to an index pattern without using its unique ID..
TehMuffinMoo
on 23 Jun 2020
yeepeee!!!! atleast some of the Suricata Dashboard items are now being populated, apart...
Great news! Was that after applying the change to the filter?
For the map, that’s because it can’t find a map with that ID. You may simply need to remove/re-add this object to your dashboard.
For signatures by country, do your events have the GeoIP tag, and associated fields?
TehMuffinMoo
on 23 Jun 2020
Now I see additional 4 filters here:
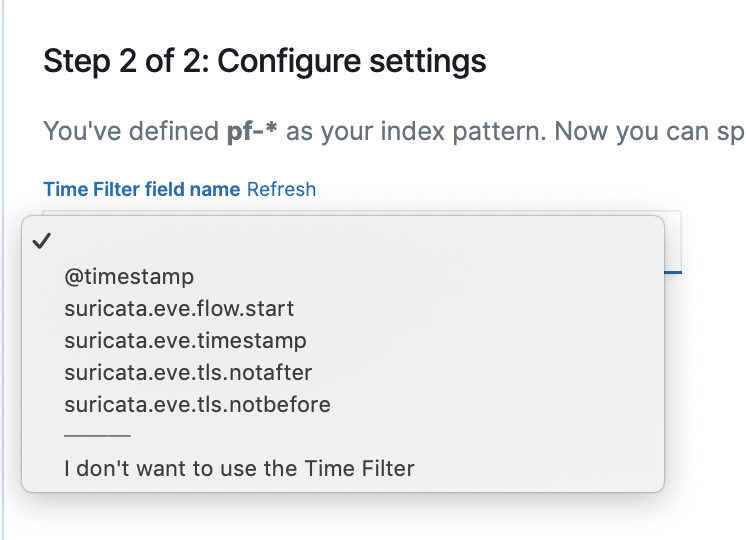
should I always choose the @timestamp ?
dsantanu
on 23 Jun 2020
Great news! Was that after applying the change to the filter?
Yes, I suppose
For the map, that’s because it can’t find a map with that ID. You may simply need to remove/re-add this object to your dashboard.
For signatures by country, do your events have the GeoIP tag, and associated fields?
Deleted the dashboard and re-imported - signatures came back but still no joy with map. How do I correct the map-id?
dsantanu
on 23 Jun 2020
should I always choose the
@timestamp?
Yeah keep it as @timestamp
Deleted the dashboard and re-imported - signatures came back but still no joy with map. How do I correct the map-id?
You have to edit the visualisation object in Kibana and replace the index pattern ID with your one.
I’m out at the moment so can’t do a how-to until later, but this might give you an idea;
https://discuss.elastic.co/t/change-visualization-index-under-saved-objects/188578
TehMuffinMoo
on 23 Jun 2020
Okay, I got the map back, directly editing this section:{
"id": "77bc2880-812e-11ea-b070-b9217beb6af5",
"name": "panel_0",
"type": "map"
} in the Suricata Dashboard.ndjson file (from the repo), replacing the id from the Firewall dashboard. but now I have lost the _Signatures by Country_.
77bc2880-812e-11ea-b070-b9217beb6af5
I don't think I have a _GeoIP_ tag in the event (yet it came back for a while, don't know how) - how do I add that tag?
dsantanu
on 24 Jun 2020
When you import the dashboard, it should identify all the visulizations where the index is missing, and then prompt you to pick your pf-* from a dropdown for each. If you try to re-import the dashboard, it should do that for you
revere521
on 24 Jun 2020
it is/was always asking me to that - and picked up -pf* from the dropdown every time but it didn't do that Suricata but the Firewall borad was just fine. For Suricata, it was just mentioning about this:
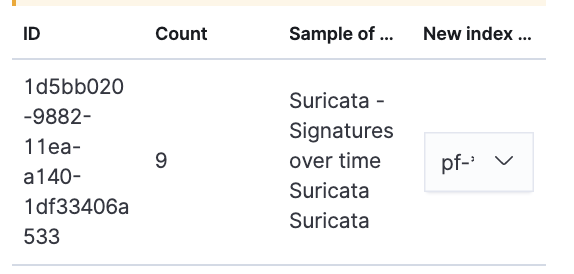
dsantanu
on 24 Jun 2020
okay, I think I see apattern - for the time , if I choose anything less than 30min, the Signature by Country goes away
dsantanu
on 24 Jun 2020
@TehMuffinMoo - thanks again!
I extracted your method within the wiki page...feel free to take a look, comment, update etc...
https://github.com/3ilson/pfelk/wiki/How-To:-Suricata-on-pfSense
a3ilson
on 24 Jun 2020
Thanks @a3ilson and happy to help! I’ll update it later on today.
@dsantanu You still having issues with GeoIP?
TehMuffinMoo
on 24 Jun 2020
@TehMuffinMoo, its coming and going. Like right now it's saying: _no result found_ but it was okay last night, when I last checked. I thought there is a pattern but I was actually wrong. I don't see any GeoIP in my events but it's still working sometimes adn most of the times it's not.
dsantanu
on 24 Jun 2020
So there’s no fields with geo. in the name?
I was thinking maybe your geo index pattern for long/latt but if you’ve got none that’s probably not it.
Do you have GeoIP listed in the tags of your events?
TehMuffinMoo
on 24 Jun 2020
You on discord? Hit me up;
This bit isn’t relevant to the original issue now, save the spam.
TehMuffinMoo#2107
TehMuffinMoo
on 24 Jun 2020
yeah, sure! good idea!!
dsantanu
on 24 Jun 2020
@TehMuffinMoo - thanks again!
I extracted your method within the wiki page...feel free to take a look, comment, update etc...
https://github.com/3ilson/pfelk/wiki/How-To:-Suricata-on-pfSense
Looks good! Only things I'd change is;
1) Add reference to needing to untick this checkbox if they've previously followed steps to set it up without Syslog-NG;
I suspect you're still getting logs from PfSense internal logging..
Can you check this is unticked ?
2) Clarify the failover( servers("192.168.0.10", "10.0.0.10") ) parameter. This is only required where you have multiple logstash instances you want to send to. This doesn't duplicate logs, simply loadbalances endpoints.
3) The host-override parameter may be required if Syslog-NG doesn't send the host as the source IP. This overrides the host value for the events when coming into logstash.
But
Hostsays _gateway - should it be like that? and the Dashboard is still empty, apart from the Count.Yeah this might relate to my earlier comment around you might need to use the host-override parameter in Syslog-NG to override it in logstash;
{
  wildcard-file(
    base-dir("/var/log/suricata")
    filename-pattern("eve.json")
    recursive(yes)
    follow-freq(1)
    program-override("suricata")
    host-override("YourPfSenseIP")        <<<<<<<<<
    flags(no-parse)
  );
};
Other than that, I think that's it!
TehMuffinMoo
on 24 Jun 2020
- Clarify the
failover( servers("192.168.0.10", "10.0.0.10") )parameter. This is only required where you have multiple logstash instances you want to send to. This doesn't duplicate logs, simply loadbalances endpoints.
I actualy have used the dns-name for tcp(...) and ip-address in failover(...) hoping it will next try IP address if name-resolution fails - saved me in two occasions in the past.
- The host-override parameter may be required if Syslog-NG doesn't send the host as the source IP. This overrides the host value for the events when coming into logstash.
yeah, I had to do that to get it working.
dsantanu
on 24 Jun 2020
@TehMuffinMoo Thanks for your help on this issue and @a3ilson thanks for your wiki post, this has solved my Suricata log issues. I recreated the map as suggested and I am now getting results on it and I am also seeing the populated Suricata - Count object.
However I appear to still be missing the suricata.eve.alert.signature.keyword and the Suricate - Time object, Suricata object display No results found. Do you have any idea why this might be?
 noodlemctwoodle
on 27 Jun 2020
noodlemctwoodle
on 27 Jun 2020
However I appear to still be missing the
suricata.eve.alert.signature.keywordand theSuricate - Timeobject,Suricataobject display No results found. Do you have any idea why this might be?
@a3ilson I’m not quite why this is, presumably as more informational events than alerts, so with significant term the most common entry for the signature field is null? In any case, me, @dsantanu and @noodlemctwoodle seem to have had this!
Add a filter to the visualisation for suricata.eve.alert.signature exists
If you don’t filter out informational logs you won’t get any results.
Like this (but with .eve., I have different field names)
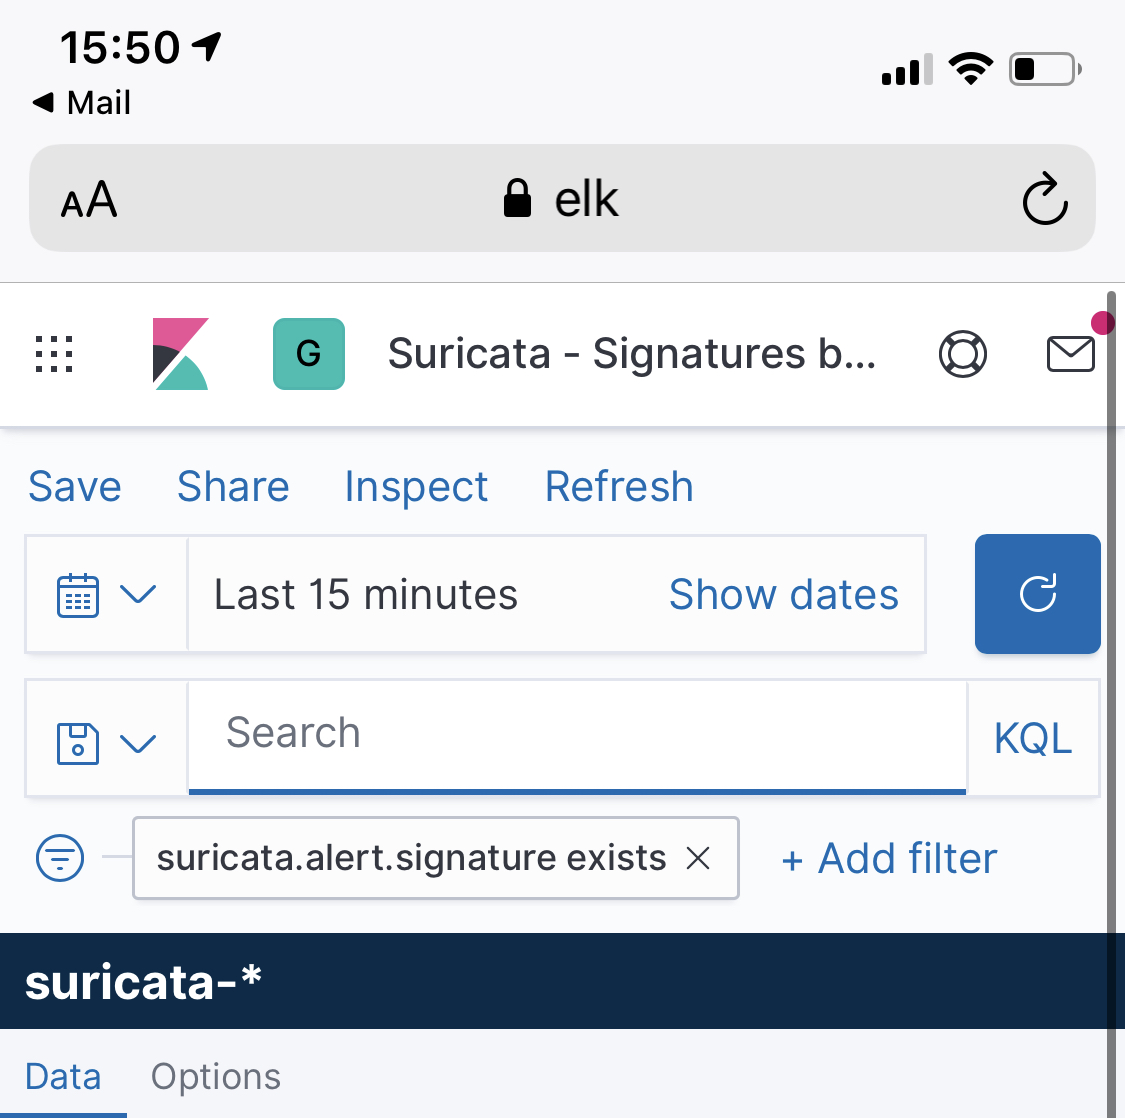
TehMuffinMoo
on 27 Jun 2020
Thanks! I'll work on rebuilding the Suricata dashboard.
Again thanks for all you help!
a3ilson
on 27 Jun 2020
I've created another issue for the suricata.eve.alert.signature exists within #136. Closing this issue as the truncated was solved by @TehMuffinMoo and posted to the wiki https://github.com/3ilson/pfelk/wiki/How-To:-Suricata-on-pfSense
a3ilson
on 27 Jun 2020
Related issues
 s7thamon
·
22Comments
s7thamon
·
22Comments
 geomaraugusto
·
13Comments
geomaraugusto
·
13Comments
 fastxl
·
5Comments
fastxl
·
5Comments
 InvokerFury
·
20Comments
InvokerFury
·
20Comments
 collse
·
8Comments
collse
·
8Comments
Most helpful comment
Pre-Requisites
The PfElk solution doesn't configure a TCP listener in logstash. You will need to create another configuration file in "/data/pfelk/configurations" called something like "01-inputs-custom.conf" and add the following;
````
01-inputs-custom.conf
input {
tcp {
port => 5544
}
}
````
And restart logstash;
systemctl restart logstashConfigure Suricata
In the Suricata configuration, the only thing you should need to change is the EVE Output Type from Syslog to File. This will start writing logs to a local file on your PfSense system, which we can then use Syslog-NG to read and forward on.
Install Syslog-NG Package in PfSense
You will want to install the Syslog-NG package from PfSense's package library.
Once installed, go to Syslog-NG under the services menu dropdown
Configure Syslog-NG
On the General tab, tick the option to enable Syslog-NG and save the configuration. The rest of the settings here don't matter as we won't be receiving logs with Syslog-NG.
Syslog-NG is comprised of three components. An input, processor and output.
The following example uses a wildcard pattern to find any files in subdirectories called eve.json. You can probably remove the program-override option if not needed for your scenario. This simply tags the "program" field in logstash with "suricata".
Object Type: Source
Object Name: Suricata
Object Parameters:
The "Log" object ties the Source->Destination together. (Processor)
Object Type: Log
Object Name: Suricata
Object Parameters:
The destination object specifies the output, this could be file, elasticsearch, syslog etc.
Object Type: Destination
Object Name: Suricata
Object Parameters:
That's it! Should just pick up your logs and send them on to PfElk.
I wrote this up quick, so any issues let me know! :)