Openstreetmap-carto: render ref numbers for allotments=plot
It could be nice to see a rendering of the ref=* numbers for allotments=plot. They represents parcels individual number.
http://wiki.openstreetmap.org/wiki/Tag:allotments%3Dplot
 antblant
All 62 comments
allotments key is currently not in the database - see https://github.com/gravitystorm/openstreetmap-carto/blob/master/openstreetmap-carto.style
 matkoniecz
on 16 Sep 2014
matkoniecz
on 16 Sep 2014
Is it something generally useful? I would be against rendering ref numbers of forests, allotments, highway lamps, etc etc.
Roads are rare case where ref is widely used for an identification.
matkoniecz
on 16 Oct 2017
This is useful if a friend wants to invite you to a barbecue on his plot. Also some people live permanently on plots, so this is their address of residence.
antblant
on 16 Oct 2017
with plots this would be equivalent to addr:housenumber only with a different operator of the numbers.
 HolgerJeromin
on 18 Oct 2017
HolgerJeromin
on 18 Oct 2017
with plots this would be equivalent to addr:housenumber only with a different operator of the numbers.
According to the wiki, ref is used to identify the plot. E.g., plot 5 or plot C or plot D1. However, when I look at the example referred to in the proposal (mapped by the person who wrote the proposal) it doesn't have a ref but has a name: "1in12 Club's Peasant Collective Plot". I would say that, in general, it would be nice for the renderer to use name if it exists otherwise use ref if that exists. In much the same way that a house name is shown, if it has one, otherwise the number is shown.
In addition to reasons mentioned above, this would be handy when people apply for an allotment so they can be told, for example, that plots 3 and 16 are available so they can go and see what's there unaccompanied.
The wiki probably ought to advise against using names of people on plots because of data protection issues, but that's a different matter.
 eehpcm
on 11 Feb 2018
eehpcm
on 11 Feb 2018
Could be quite easy to do, since it should be just another element similar to addr:housenumber.
 kocio-pl
on 1 Dec 2018
kocio-pl
on 1 Dec 2018
I've asked about this on the tagging list first, because there are two
competing ways to show this: lot=
The second is used over 6000 times and is mentioned on the current
allotments=plot wiki page (though it wasn't part of the proposal), but
the first is used over 1000 times and is mentioned on the
landuse=allotments page.
On 12/1/18, kocio-pl notifications@github.com wrote:
Could be quite easy to do, since it should be just another element similar
toaddr:housenumber.--
You are receiving this because you are subscribed to this thread.
Reply to this email directly or view it on GitHub:
https://github.com/gravitystorm/openstreetmap-carto/issues/432#issuecomment-443402396
 jeisenbe
on 7 Jan 2019
jeisenbe
on 7 Jan 2019
It looks like there is some support for using ref=* for these cases on the tagging list. While the numbers are fairly high, it looks like the usage is patchy. In many of the European provinces that I've downloaded there were no allotments=plot or at least none with ref=*, but I did find this one in Wales, and it looks like there are a number in Germany.
It looks like we would need to add an outline for allotment=plot so that the numbers make sense?
_Cardigan, Wales_ https://www.openstreetmap.org/#map=18/52.08803/-4.64677
With numbers only (and current colors, no borders) - for comparison
z18

z19

z18 - Ref numbers, plot and landuse outlines (and new color #c9e1bf)

z19

Currently we only show address numbers and unit numbers on buildings. I believe this would be the first time that numbers were rendered for a plot of land.
jeisenbe
on 7 Jan 2019
@jeisenbe
It looks like we would need to add an outline for allotment=plot so that the numbers make sense?
Yes please. It not only makes the numbers make sense, it makes the map far more useful. Somebody asking by email about available plots can be given a link and the information that (say) plots 4 and 10 are currently available. That would allow them to visit the allotment and look at the plots without needing somebody there to point out which plot is which.
I mapped that allotment based upon an image sent to me by the allotment committee of a drawing showing plot numbering. The reason that not all plots are numbered is because the image was unclear in places. I did ask for clarification but received no response. But that was after I told them that currently the plot outlines and numbers weren't rendered. If your change goes in I may be able to get more info out of them (another reason I support it).
I know this is almost cadastral mapping, and we're not supposed to do that, but there is nothing to prevent me drawing physical boundaries (hedges/fences/walls) between properties that are almost cadastral, so I don't see this as being much different (I mapped those outlines because they showed up in aerial imagery). In any case, _A foolish consistency is the hobgoblin for little minds._
The only other thing I'd mention is that I later learned (but have yet done nothing about) that one of the plots has a name. It is now the "Collective Orchard" or "Members Orchard" or "Common Orchard" or some such. I have a record of the actual name somewhere but it would take me a while to dig it out. So is there any possibility of rendering a name, if present? If so, the wiki page would have to caution that this should not be used for the name of a person who is assigned the plot because of possible problems with data protection legislation.
All that aside, I'm very happy with your proposal with the borders.
eehpcm
on 7 Jan 2019
It looks like Berlin has many allotments with plots and ref.
Check out this area in an editor (eg JOSM):
https://www.openstreetmap.org/#map=18/52.41328/13.42516
Test rendering:

Unfortunately, the plot outlines and numbers do not render here, because these plots are tagged not tagged with "area=yes" like the others in Wales (above). The database does not yet import the key "allotments" as a polygon, I think.
(Allotments 1 and 8 render because I changed the file, by adding "area=yes"; the surrounding plots do not render. This also happens in areas without buildings)
I can add a line to the lua transformations list, but I suspect this means we need to wait for the next database import to get many of these to render?
Is it worth doing a PR for this now or do we need to wait?
jeisenbe
on 7 Jan 2019
@jeisenbe
Unfortunately, the plot outlines and numbers do not render here, because these plots are tagged not tagged with "area=yes" like the others in Wales (above).
You should treat the area=yes on the Cardigan allotments as an aberration by a highly aberrant individual (me).
Back when I added them the wiki page said to map them as areas. So I added them using iD's area tool and gave them refs. Not only did they not render, the ref wasn't used as a label by iD, so it was very hard to ensure I hadn't misnumbered anything. So I followed the link in the proposal to an example and found that plot didn't have a ref but did have a name. So I tried duplicating the ref in the name. iD then used the name as a label, but placed it on the way rather than in the centre of the plot. Which was still confusing because most of the plots have at least one common way and that's where the label often appeared. On a hunch I added an explicit area=yes which cured the label placement. So I committed a bigger sin than tagging for the renderer, I tagged for the editor. iD has since fixed this issue with the name and will place it centrally rather than on the way even without area=yes, but still doesn't use the ref as a label if one is present.
In my opinion, the plots should have an implicit area property (like many other features) and not need an explicit area=yes. The Germans did the right thing whilst I cheated to make my life a little easier. I just subdivided three of the plots and removed the area=yes on them to see what happens. :)
If whatever you do means plots won't render until the next db import, I can live with that. It's been 10 months since I first commented here, and the issue has actually been open for nearly 4 years. Another few days doesn't matter if it means we can do it right.
eehpcm
on 7 Jan 2019
Now that #3625 is merged, we could add outlines for plots in allotments.
Can I do a PR for plots even though the tag is not yet imported into the
database?
What is our policy about features that require database reload?
On Tue, Jan 8, 2019 at 12:19 AM eehpcm notifications@github.com wrote:
@jeisenbe https://github.com/jeisenbe
Unfortunately, the plot outlines and numbers do not render here, because
these plots are tagged not tagged with "area=yes" like the others in Wales
(above).You should treat the area=yes on the Cardigan allotments as an aberration
by a highly aberrant individual (me).Back when I added them the wiki page said to map them as areas. So I added
them using iD's area tool and gave them refs. Not only did they not render,
the ref wasn't used as a label by iD, so it was very hard to ensure I
hadn't misnumbered anything. So I followed the link in the proposal to an
example and found that plot didn't have a ref but did have a name. So I
tried duplicating the ref in the name. iD then used the name as a label,
but placed it on the way rather than in the centre of the plot. Which was
still confusing because most of the plots have at least one common way and
that's where the label often appeared. On a hunch I added an explicit
area=yes which cured the label placement. So I committed a bigger sin than
tagging for the renderer, I tagged for the editor. iD has since fixed this
issue with the name and will place it centrally rather than on the way even
without area=yes, but still doesn't use the ref as a label if one is
present.In my opinion, the plots should have an implicit area property (like many
other features) and not need an explicit area=yes. The Germans did the
right thing whilst I cheated to make my life a little easier. I just
subdivided three of the plots and removed the area=yes on them to see what
happens. :)If whatever you do means plots won't render until the next db import, I
can live with that. It's been 10 months since I first commented here, and
the issue has actually been open for nearly 4 years. Another few days
doesn't matter if it means we can do it right.—
You are receiving this because you were mentioned.
Reply to this email directly, view it on GitHub
https://github.com/gravitystorm/openstreetmap-carto/issues/432#issuecomment-451968507,
or mute the thread
https://github.com/notifications/unsubscribe-auth/AoxshGg8QY5ZGbdOwPi0wRyZ_o_NbGTYks5vA2VxgaJpZM4BsD7z
.
jeisenbe
on 12 Jan 2019
It hasn't been done yet, we just use hstore for such features. To be more precise, they are imported, they are all just stored as "key=value" in the hstore column (instead of "value" in the "key" column). Look at the healthcare code for example: #3498.
kocio-pl
on 12 Jan 2019
~58% out of 11 360 plots have ref number tagged:
https://taginfo.openstreetmap.org/tags/?key=allotments&value=plot#combinations

kocio-pl
on 12 Jan 2019
I'm happy enough with the ref numbers, but do we need the outlines for the plots?
For residential areas, we do not render plots, so why would we need to do it for the much less important allotment subdivisions?
 polarbearing
on 12 Jan 2019
polarbearing
on 12 Jan 2019
@polarbearing
I'm happy enough with the ref numbers, but do we need the outlines for the plots?
I'd find it useful. So would others.
For residential areas, we do not render plots, so why would we need to do it for the much less important allotment subdivisions?
What is unimportant to one person is important to another. There are many POIs (such as women's clothing shops) that are of supreme disinterest to me, but I map them anyway because they are important to others. And even I may find such POIs useful for navigation.
Picture also the scenario where somebody applies for a plot by e-mail They receive a link to the map with the information that plots 3, 7 and 12 are available.
When I was obtaining information about my local plots by e-mail, I received a photo of a hand-drawn map with the plot outlines and numbers (the plot borders were distinguishable from aerial imagery given the hints in the photo). But some of it was too blurred to make out some of the numbers and the sequencing wasn't obvious. So I mapped the plots and numbered the ones that I could make out. When I asked for clarification of the remaining plot numbers I had to admit that currently the outlines weren't rendered. The previously enthusiastic person never responded, presumably thinking "What's the point when neither the outlines nor the numbers render?" And I'm left thinking "What's the point of going to the effort of mapping the invisible?"
Given that currently iD doesn't display the refs as labels (although it does display the names) it makes it hard to check that I've numbered things right. Although rendering the refs would help, having the borders too would make some errors less likely.
On top of all this, as an aside to responding to your question, I repeat my request that you consider rendering names if present (in the same way that house names are displayed as well as house numbers if both are present and there is enough room). Some plots have names as well as (sometimes instead of) refs: this from the example in the original proposal and
this one of mine.
eehpcm
on 12 Jan 2019
do we need the outlines for the plots?
I tested rendering just the ref numbers above, but they were hard to
interpret without the outline.
For residential areas, we do not render plots
We render house numbers on the buildings themselves. This is a much better
solution for residential areas.
Allotments generally do not have houses or house numbers, so there is no
where to show the number except on the plot itself.
Re: residential plot outlines: I’ve always appreciated seeing these on
G____e maps at very high zoom level, but these may be harder to verify than
allotment outlines, where the shape of the garden beds can show the line if
there is no fence or wall. Is there an approved tag for these, or are
imports of lot lines discouraged?
>
jeisenbe
on 13 Jan 2019
See the warnings in place=plot:
_OSM does not aim to be a land registry. You can add plot data if you want but only where the plot boundaries are actually visible on the ground. Do not import plot or land ownership data from third party sources.
Warning
OpenStreetMap data should be distributable as free as possible. By adding parcels and informations about their owners and residents you risk that OpenStreetMap data falls under data protection regulations. This could make usage and distribution of OpenStreetMap data illegal – maybe not in your country but in other countries!_
polarbearing
on 13 Jan 2019
@jeisenbe
Re: residential plot outlines: I’ve always appreciated seeing these on
G____e maps at very high zoom level, but these may be harder to verify than
allotment outlines, where the shape of the garden beds can show the line if
there is no fence or wall. Is there an approved tag for these, or are
imports of lot lines discouraged?
See polarbearing's warning. OSM is not intended to be a cadastral map. I sometimes plot walls/fences/hedges where these are both visible (whether on aerial imagery or from a survey) and useful in some way for comprehending the situation one may confront on the ground. For example, near public footpaths/bridleways, or on farmland used for public shows, or camping.
eehpcm
on 13 Jan 2019
Ok, I checked healthcare=clinic and healthcare=hospital drawn as a closed
way. They only render if marked area=yes
So PR #3498 https://github.com/gravitystorm/openstreetmap-carto/pull/3498 is
not a correct example
they are imported, they are all just stored as "key=value" in the hstore
column (instead of "value" in the "key" column). Look at the healthcare
code for example: #3498
https://github.com/gravitystorm/openstreetmap-carto/pull/3498
jeisenbe
on 13 Jan 2019
I got allotments=plot to render by adding 'allotments' to openstreetmap-carto.lua
Here's allotment ref in the same color as the text for landuse=allotments. The allotments=plot polygons have been given a 0.5 pixel wide outline at z19 and 0.3 pixel wide at z18, in the same color as the outline of landuse=allotments. The ref numbers sometimes are partially on top of a building because they are placed in the centroid of the plot polygon, not in relation to any building.
z18 with buildings
https://www.openstreetmap.org/#map=18/52.41328/13.42516
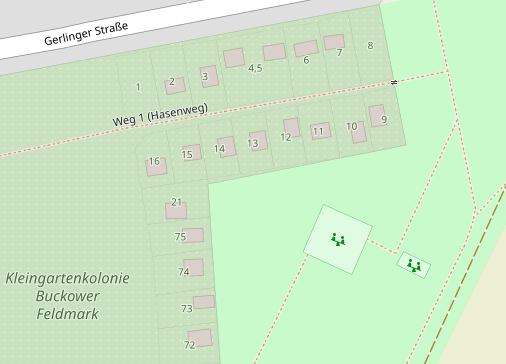
z19
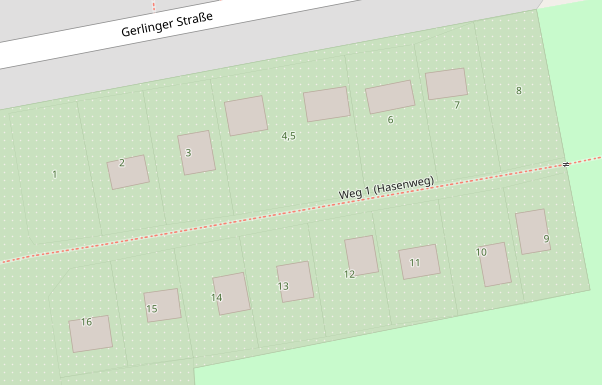
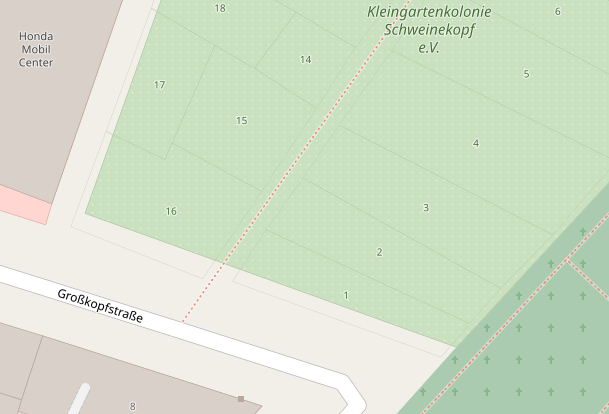
z18 plots only (some do not match up with outline of landuse)
https://www.openstreetmap.org/#map=18/52.56568/13.33226
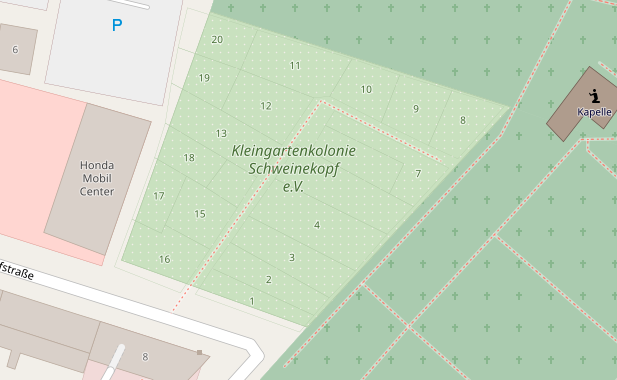
z19
jeisenbe
on 13 Jan 2019
@jeisenbe
Here's allotment ref in the same color as the text for landuse=allotments.
Those are very faint. Maybe it's just my monitor and/or my eyesight, but if I didn't know those borders were meant to be there, I wouldn't have noticed them. I have to look very carefully to see them.
But if that's all the other people here will let you do, I'll take it.
eehpcm
on 13 Jan 2019
There are more such problems. Maybe it's time to do a full conversion of different hstore values we use, but it needs changes in lua file probably and also consultation with OWG when they could reload database.
kocio-pl
on 13 Jan 2019
Should I submit a PR now? I’ve confirmed that allotments=plot will render
after reload, so any newly added or edited polygons will render.
But current allotments=plot will not render (unless they are currently
tagged with area=yes) until they are updated or the database is reloaded.
On Mon, Jan 14, 2019 at 3:38 AM kocio-pl notifications@github.com wrote:
There are more such problems. Maybe it's time to do a full conversion of
different hstore values we use, but it needs changes in lua file probably
and also consultation with OWG
https://github.com/openstreetmap/operations/issues when they could
reload database.—
You are receiving this because you were mentioned.
Reply to this email directly, view it on GitHub
https://github.com/gravitystorm/openstreetmap-carto/issues/432#issuecomment-453854462,
or mute the thread
https://github.com/notifications/unsubscribe-auth/AoxshIt-hchtBStWbBnlW-PFNhG5VunMks5vC30igaJpZM4BsD7z
.
jeisenbe
on 14 Jan 2019
The outline is the same width and darkness as the new landuse=allotments
outline at z19. Are those visible to you? It’s suppose to be subtle.
I agree that it’s a little too faint on z18
On Mon, Jan 14, 2019 at 12:45 AM eehpcm notifications@github.com wrote:
@jeisenbe https://github.com/jeisenbe
Here's allotment ref in the same color as the text for landuse=allotments.
Those are very faint. Maybe it's just my monitor and/or my eyesight, but
if I didn't know those borders were meant to be there, I wouldn't have
noticed them. I have to look very carefully to see them.But if that's all the other people here will let you do, I'll take it.
—
You are receiving this because you were mentioned.
Reply to this email directly, view it on GitHub
https://github.com/gravitystorm/openstreetmap-carto/issues/432#issuecomment-453840256,
or mute the thread
https://github.com/notifications/unsubscribe-auth/AoxshDF_Bq8n8svhi2Hm77bya_kv2Wmcks5vC1SfgaJpZM4BsD7z
.
jeisenbe
on 14 Jan 2019
@jeisenbe
The outline is the same width and darkness as the new landuse=allotments outline at z19. Are those visible to you? It’s suppose to be subtle.
I find it's as hard to see the border on landuse=allotments as on the plots themselves. But it doesn't
matter because the allotment is surrounded by different colours anyway. The only time it could possibly matter is if there were two adjacent landuse=allotments with a common border being operated under different names (an unlikely situation, but not impossible).
I think it's a little too faint at z18 and z19. If anything, z19 is worse. I have to move my head closer to the screen than normal in order to see the borders at z18 and even closer to see them at z19.
I liked the emphasis you gave the borders seven days ago. I could see those without struggling and without expecting anything. The current ones I have to know they're there so I can move my head to a position where I can see them. In normal usage those are map features I wouldn't realize were there.
Yes, it all depends on my eyesight, my monitor and the resolution I'm running the display at. Other people may see the borders more clearly. However, other map features don't give me problems. Hmmm, perhaps there are other map features that do give me problems but I haven't noticed them, but all the types of features I've mapped have not given me problems.
eehpcm
on 14 Jan 2019
@jeisenbe
Should I submit a PR now?
From my lofty position atop Mt Dunning-Kruger, I don't see any reason why not. If you're not breaking anything and nobody objects in principle, then go for it. A reload will happen eventually and some people will be pleasantly surprised when their allotment plots magically show up. Most of the ones I've mapped will show up straight away because they have area=yes. And I can even see what happens if I remove area=yes (I'm expecting them to continue to be rendered because I've edited them).
eehpcm
on 14 Jan 2019
I'm expecting them to continue to be rendered because I've edited them
I believe this is correct.
On Mon, Jan 14, 2019 at 9:21 PM eehpcm notifications@github.com wrote:
@jeisenbe https://github.com/jeisenbe
Should I submit a PR now?
From my lofty position atop Mt Dunning-Kruger, I don't see any reason why
not. If you're not breaking anything and nobody objects in principle, then
go for it. A reload will happen eventually and some people will be
pleasantly surprised when their allotment plots magically show up. Most of
the ones I've mapped will show up straight away because they have area=yes.
And I can even see what happens if I remove area=yes (I'm expecting them to
continue to be rendered because I've edited them).—
You are receiving this because you were mentioned.
Reply to this email directly, view it on GitHub
https://github.com/gravitystorm/openstreetmap-carto/issues/432#issuecomment-453986907,
or mute the thread
https://github.com/notifications/unsubscribe-auth/AoxshNir53LoU-H5IZkLEIUQ8EsdMvHyks5vDHZRgaJpZM4BsD7z
.
jeisenbe
on 14 Jan 2019
Pushing the PR when it only renders currently with area=yes will cause a lot of unnecessary adding of the latter tag, and cause confusion.
The privacy issue is also not addressed yet.
polarbearing
on 14 Jan 2019
@polarbearing
Pushing the PR when it only renders currently with area=yes will cause a lot of unnecessary adding of the latter tag, and cause confusion.
How so? Newly added plots will render without needing area=yes. Plots that are edited will render without needing area=yes. Existing plots without area=yes will render after a database reload (whenever that happens).
What you appear to be suggesting is that there are vast numbers of people waiting to add allotment plots but have been waiting to do so until they see here that rendering is being implemented. And that they will add those plots immediately after they see the PR announced but before it is actually implemented, which is the only situation in which they'd need to add area=yes.
Maybe I'm missing something, but I don't understand your reasoning.
The privacy issue is also not addressed yet.
You're right. I've just searched the whole page and there is no mention of the word "privacy" at all, except where you just used it to say it hadn't been addressed. Or did you mean the potential problem of somebody adding "ref=Fred Bloggs" which I raised and said the wiki page probably ought to be amended to warn against. Which I'll happily do once I'm sure that people here are going to stop coming up with non-issues against rendering plots. There's no point wasting my time adding a warning about something that will never be rendered anyway.
eehpcm
on 14 Jan 2019
Privacy was the shortcut for 'data protection regulations', [Sat, 12 Jan 2019 23:31:06 GMT].
Newly added plots will render without needing area=yes.
Is that the case? My understanding was that the column is not in the current database, which would affect new and old edits equally. But my understanding of the database data flow is limited.
polarbearing
on 14 Jan 2019
@polarbearing
Privacy was the shortcut for 'data protection regulations', [Sat, 12 Jan 2019 23:31:06 GMT].
I do not know of any plots which refer to an individual in the ref=. I had a memory that one plot had a name= along the lines of "Fred Bloggs" memorial plot." Not only has nobody stated if name=* will be rendered (I hope it will be), it appears my memory was defective. I do think it sensible to warn on the allotment plot wiki page not to use the names of living people when identifying plots, simply because the hand-drawn plan of my local allotments shows plot numbers and the names of the holders. We have a general warning anyway, but some mappers may not be aware of it and other allotment associations may also have plans which identify plot holders. Since it looks like this is on the point of going ahead, I'll amend the wiki page next.
My understanding was that the column is not in the current database, which would affect new and old edits equally. But my understanding of the database data flow is limited.
You know more of the database flow than I do, since I know nothing about it. I based my opinion on this:
I’ve confirmed that allotments=plot will render after reload, so any newly added or edited polygons will render. But current allotments=plot will not render (unless they are currently tagged with area=yes) until they are updated or the database is reloaded.
From that, existing plots without area=yes will render after a reload. Newly added or newly edited plots will render without area=yes. Until the reload, existing plots without area=yes will not render. I don't know what magic was involved to make that happen, but at a guess the relevant column has been added to the db.
I don't know how often the reload happens, but I joined this conversation about rendering plots 10 months ago. It started 4 years ago. I think we can wait a few weeks, or even months, for a reload to happen. Anyone reading this thread who wants plots to render before the reload won't be tempted to add area=yes because any trivial edit will cause the plot to render. At worst they add area=yes, make sure the plot renders, then remove area=yes (but any other tag like note=* would also work).
eehpcm
on 14 Jan 2019
I originally thought the key “allotments” was missing from the database.
@kocio-pl pointed out that the tag “allotments=plot” is in the hstore
column. The problem was that ‘allotments’ is not on the lists of keys to
import as polygons in the Lua transformations file, OpenStreetMap-carto.lua
I assume the polygon geometry is updated every time a way is edited in the
database, but someone with better understanding of the OSM servers should
confirm this.
Re: data protection, I was only planning to submit a PR to render “ref”,
since very few allotments=plot have a name, and to avoid this potential
privacy issue
On Tue, Jan 15, 2019 at 4:07 AM eehpcm notifications@github.com wrote:
@polarbearing https://github.com/polarbearing
Privacy was the shortcut for 'data protection regulations', [Sat, 12 Jan
2019 23:31:06 GMT].I do not know of any plots which refer to an individual in the ref=. I
had a memory that one plot had a name= along the lines of "Fred Bloggs"
memorial plot." Not only has nobody stated if name=* will be rendered (I
hope it will be), it appears my memory was defective. I do think it
sensible to warn on the allotment plot wiki page not to use the names of
living people when identifying plots, simply because the hand-drawn plan of
my local allotments shows plot numbers and the names of the holders. We
have a general warning anyway, but some mappers may not be aware of it and
other allotment associations may also have plans which identify plot
holders. Since it looks like this is on the point of going ahead, I'll
amend the wiki page next.My understanding was that the column is not in the current database, which
would affect new and old edits equally. But my understanding of the
database data flow is limited.You know more of the database flow than I do, since I know nothing about
it. I based my opinion on this:I’ve confirmed that allotments=plot will render after reload, so any newly
added or edited polygons will render. But current allotments=plot will not
render (unless they are currently tagged with area=yes) until they are
updated or the database is reloaded.From that, existing plots without area=yes will render after a reload.
Newly added or newly edited plots will render without area=yes. Until the
reload, existing plots without area=yes will not render. I don't know what
magic was involved to make that happen, but at a guess the relevant column
has been added to the db.I don't know how often the reload happens, but I joined this conversation
about rendering plots 10 months ago. It started 4 years ago. I think we can
wait a few weeks, or even months, for a reload to happen. Anyone reading
this thread who wants plots to render before the reload won't be tempted to
add area=yes because any trivial edit will cause the plot to render. At
worst they add area=yes, make sure the plot renders, then remove area=yes
(but any other tag like note=* would also work).—
You are receiving this because you were mentioned.
Reply to this email directly, view it on GitHub
https://github.com/gravitystorm/openstreetmap-carto/issues/432#issuecomment-454123443,
or mute the thread
https://github.com/notifications/unsubscribe-auth/AoxshFlIbLgf0xNud1IW8y8IAimXGdFGks5vDNVtgaJpZM4BsD7z
.
jeisenbe
on 14 Jan 2019
@jeisenbe
The problem was that ‘allotments’ is not on the lists of keys to import as polygons in the Lua transformations file
That sounds like a simple fix. Whether it only takes effect on a db reload or affects edits I don't know, and am not particularly worried about as long as db reloads occur more frequently than once a year.
Re: data protection, I was only planning to submit a PR to render “ref”, since very few allotments=plot have a name, and to avoid this potential privacy issue
Which just sets us up for a mapper who is determined to have the name appear putting it in the ref instead. Which is why I edited the wiki to say not to do that for either the ref or the name. Of course, not everybody reads the wiki, so somebody may do it anyway. :( Not rendering the name makes it slightly less likely to happen but, as I just said, that may just cause somebody to put the name in the ref.
Of the few plots I've found with names, none are the names of people. In fact, most of them appear to have the names of the allotments for the plot name, which is pointless. Your call.
eehpcm
on 14 Jan 2019
The privacy concern is not about rendering the ref number (which is not problematic, comparable to a house number), but the outline, showing the exact size of private property of an individual.
polarbearing
on 15 Jan 2019
Allotments are not owned privately, are they? I thought the entire area was
owned by an organization, and each lot was assigned to a family, but was
not owned privately; ie you cannot buy or sell it?
On Tue, Jan 15, 2019 at 8:33 AM polarbearing notifications@github.com
wrote:
The privacy concern is not about rendering the ref number (which is not
problematic, comparable to a house number), but the outline, showing the
exact size of private property of an individual.—
You are receiving this because you were mentioned.
Reply to this email directly, view it on GitHub
https://github.com/gravitystorm/openstreetmap-carto/issues/432#issuecomment-454204474,
or mute the thread
https://github.com/notifications/unsubscribe-auth/AoxshL9NFTgM2F37SaW-U774uDYEa0F4ks5vDRO2gaJpZM4BsD7z
.
jeisenbe
on 15 Jan 2019
ie you cannot buy or sell it?
Such assumptions must be invalid somewhere on the world :-)
I know an individual private owned allotment-like place in Ettlingen, Germany even without central infrastructure (no fresh water, waste water, toilet, power, no central meeting place)
HolgerJeromin
on 15 Jan 2019
@polarbearing
The privacy concern is not about rendering the ref number (which is not problematic, comparable to a house number), but the outline, showing the exact size of private property of an individual.
In that were the case then we must remove all house outlines immediately. They show the exact size of private property of an individual. Of course, that's not the case. The real problem is the potential for a living individual being identified with the property (be it an allotment plot or a house). But this is possible even with houses: somebody could use name=* to add the name of the person living in the house.
What exacerbates the problem with allotment plots is that publicly-available maps produced by the organization running the allotments may contain the names of the individuals operating the plots. This is true of the allotments near me. When I went to survey them (there are no gates or barriers to access the plots) I spotted just such a map on display in the window of one of the sheds (belonging to the person at the head of the organization). The risk is that a mapper seeing such a map may consider it acceptable to add names. It's even possible that such a map may refer to plots _only_ by names of people operating them, which might cause a mapper to use those names as the ref=* (which is a free-form field). Overall, though, I consider a warning in the wiki to be adequate to deal with this remote possibility, otherwise we'd better remove name=* from houses, just in case.
Also, as jeisenbe pointed out, allotments are not owned privately. This may mean giving the holder's name wouldn't contravene privacy legislation, but it's better to be safe than sorry given the old legal maxim "the law is an ass" (note: that much-used quote is taken out of context, but it is nonetheless considered by most to be accurate even in truncated form).
And in response to HolgerJeromin, if it's privately-owned then it may be "allotment-like" (for small values of "like") but it is not an allotment in OSM terms of landuse=allotments but a privately-owned area used for agricultural purposes and should be mapped as a garden or a nursery (or whatever landuse other than allotment is appropriate).
eehpcm
on 15 Jan 2019
somebody could use name=* to add the name of the person living in the house.
I've seen this happen more then a few times in California. One guy posted his own information, including his phone number. There was even someone in southern California that was using the name field on houses near him to out drug dealers and people with criminal records.
So its bound to happen. I don't think things like are a reason to render or not render something though. If its not the intention of the tag to reveal private information, its not on OSM if it gets miss used that way, outside of removing the specific instances where it happens.
 Adamant36
on 15 Jan 2019
Adamant36
on 15 Jan 2019
landuse=allotments MAY be owned or just operated by a company or a trust, but what we are talking here is allotments=plot, which is only a part of the allotments area and is supposed to be owned/rented by an individual or a single owner. It's even written in the wiki page.
I don't buy the argument making it similar to housenumbers. Yes, for small building=detached/house in a village, the whole house is owned by a single owner so there is 1:1 mapping. But in apartment/residential buildings in cities with many owners, you can't find out the owner of a part of the building easily. Yes, cadastre offices offer the information containing property/flat/house numbers, but rarely you see physical location of the individual flats.
So mapping allotments=plot with an official reference number (that can be looked up in a cadastre database) is similar to mapping individual flats inside a building and their exact geographical location.
I'm sure more people would object to that.
Yes, some people already start mapping rooms or shops inside office/civic/mall buildings, but that is not the same.
 aceman444
on 15 Jan 2019
aceman444
on 15 Jan 2019
official reference number ( that can be looked up in a cadastre
database...
Is that how things work in Europe? My understanding is that in Britain the
whole landuse=allotments has one owner, and that the plots are assigned or
perhaps rented, but are not separate registered properties.
In the USA the location of all plots of land and the names of their owners
are public information, and a number of websites (Zillow, Redfin etc) will
give you the name of the registered landowner, last date of sale, last sale
price, square footage of the lot and any buildings, etc etc - as Gmaps
shows lot outlines in the USA too. Is this information not public in some
European countries?
On Wed, Jan 16, 2019 at 12:48 AM aceman444 notifications@github.com wrote:
landuse=allotments MAY be owned or just operated by a company or a trust,
but what we are talking here is allotments=plot, which is only a part of
the allotments area and is supposed to be owned/rented by an individual or
a single owner. It's even written in the wiki page.I don't buy the argument making it similar to housenumbers. Yes, for small
building=detached/house in a village, the whole house is owned by a single
owner so there is 1:1 mapping. But in apartment/residential buildings in
cities with many owners, you can't find out the owner of a part of the
building easily. Yes, cadastre offices offer the information containing
property/flat/house numbers, but rarely you see physical location of the
individual flats.
So mapping allotments=plot with an official reference number (that can be
looked up in a cadastre database) is similar to mapping individual flats
inside a building and their exact geographical location.
I'm sure more people would object to that.Yes, some people already start mapping rooms or shops inside
office/civic/mall buildings, but that is not the same.—
You are receiving this because you were mentioned.
Reply to this email directly, view it on GitHub
https://github.com/gravitystorm/openstreetmap-carto/issues/432#issuecomment-454440567,
or mute the thread
https://github.com/notifications/unsubscribe-auth/AoxshMtFyAV-hBd_xStu6j54GSDrR4hxks5vDfg7gaJpZM4BsD7z
.
jeisenbe
on 15 Jan 2019
@jeisenbe
My understanding is that in Britain the whole landuse=allotments has one owner, and that the plots are assigned or perhaps rented, but are not separate registered properties.
That's pretty much how it operates. The owner might be an individual (unlikely) or an association, or a local council. The history of my local allotments is complicated. It has been in the hands of the county council and then the town council, it's currently in the hands of the allotment association but it reverts to the town council if that association disbands.
As to which information is public, and _how_ public, that probably varies depending upon the country and the owner of the allotment. But it doesn't really matter. Whoever owns the allotment is responsible for ensuring whatever data is made available complies with local data protection/privacy legislation. The allotment owner may have a publicly-accessible database linking plot holder's name to plot number. Or a sheet of paper in the window of a shed (as for my local allotments). It doesn't matter as long as we only show the plot number. If there is information relating plot number to holder's name made available by the allotment owner that is not our concern, any more than it is our concern if the list of those on the electoral register is publicly available (meaning that if our map shows a house number you can determine who lives there): house numbers are observable by anybody from the road.
So not only is there no general cadastral database for allotment plots (not in the UK), even if there were it wouldn't be a problem because that information linking plot number to holder is made available by somebody else and would be available whether or not we map the plot numbers.
If there's no cadastral information it's not a problem at all. If there is cadastral information then it's not our problem. Only if we map cadastral information would it (possibly, depending on the legislation in the particular country) be our problem.
As for gmaps, I just checked for my local allotments. Not only does it not show the individual plots, it doesn't even show the allotment. Sometimes some POIs are hidden unless you actually query for them, which I just did. Still nothing. Gmaps doesn't (in general) show plot boundaries of anything in the UK. And it renders buildings as rectangles whether they're rectangular or not, and only of approximately the right size.
eehpcm
on 15 Jan 2019
I think the danger of showing living people's names is the same as in the name of the building - there might be places like that ("Old McDonald's farm", "My plot" etc.), which should be fixed, the bugs like this do not invalidate rendering numbers.
kocio-pl
on 15 Jan 2019
For what it's worth, I would vehemently discourage the rendering of plot boundaries. This will encourage the mapping of plot boundaries, and this "mapping" will largely be imports of high detail and questionable use. We don't normally map plot boundaries in OSM. They are rarely verifiable on the ground. If there's a fence, map the fence. If there's a wall, map the wall. But you can't see where the plot is. So don't map it's outline, and don't encourage people to invent and map some outline it by rendering it.
 woodpeck
on 16 Jan 2019
woodpeck
on 16 Jan 2019
@woodpeck
They are rarely verifiable on the ground.
Actually, allotment plot boundaries often are visible on aerial imagery and on the ground. At least the ones near me are.
What aren't visible are the numbers assigned to those plots. But they too are verifiable by asking the organization responsible for the allotments.
eehpcm
on 16 Jan 2019
There's been some pretty bad quality imports of residential plot data in America. I ts something that happens with everything though. I dont see why this should be the exception. Its not it cant just be cleaned up in this case like it is everywhere else
Im also still mixed on how much rendering something inharently leads to an "x increase" or whatever in imported data of that feature. I think in the case of imports it has more to do with someone providing the data in the first place, because the opertunity cost of adding millions of features to the map at that point is so low. Even if it doesn't render.
Going off that also assumes there's a bunch of plot information sources to import in the first place. Which probably isn't true. I doubt the venders of most allotments know how to turn there maps into shape files and id think its something to detailed for a state goverment to provide on a mass scale. Which is probably why Google doesn't provide it, Because its not avalible for import at any real scale, if at all, to make it worth doing.
Adamant36
on 16 Jan 2019
Actually, allotment plot boundaries often are visible on aerial imagery and on the ground
No, they are absolutely invisible. What is visible are physical objects that people erect along where they think their boundary is, e.g. hedges and fences. These are mappable and already rendered.
polarbearing
on 16 Jan 2019
We show field boundaries in farmland even when there is no fence, due to
signs such as different crops.
Allotments are similar to farmland in this way
On Wed, Jan 16, 2019 at 5:23 PM polarbearing notifications@github.com
wrote:
Actually, allotment plot boundaries often are visible on aerial imagery
and on the groundNo, they are absolutely invisible. What is visible are physical objects
that people erect along where they think their boundary is, e.g. hedges and
fences. These are mappable and already rendered.—
You are receiving this because you were mentioned.
Reply to this email directly, view it on GitHub
https://github.com/gravitystorm/openstreetmap-carto/issues/432#issuecomment-454691900,
or mute the thread
https://github.com/notifications/unsubscribe-auth/AoxshLm63X--narj6LgQbpusN3n4t_NBks5vDuF7gaJpZM4BsD7z
.
jeisenbe
on 16 Jan 2019
No. It would be comparable if you mapped the flower bed vs. the veggie bed, that would be your different crops that are ground-verifyable. The different farmlands are different landuse, not legal plot boundaries.
Plot boundaries are not ground-verifyable. The fence might be in a different place than the property boundary. A hedge would be planted so that its width does not cover the neighbours ground.
Most famous example is the Berlin Wall, few segments remaining, which left a few meters of East German territory on the western side, thus everybody touching the wall from the west would stand on eastern ground.
polarbearing
on 16 Jan 2019
If I understand you correctly, using it for rendering refs would be OK, but explicitly showing it would be bad?
kocio-pl
on 16 Jan 2019
@polarbearing
No, they are absolutely invisible.
This is not always the case. Take a look at these allotments in your favourite editor. Turn off the OSM data layer. You see those things that look like fences or hedges? They're not. I've been there and they're the boundaries between plots where the two relevant people are reluctant to go right to the edge of their plots in case they end up hoeing or digging a small fraction of their neighbour's plot. These borders are even more visible in a survey. I know that for a fact because I went there and had a look around.
eehpcm
on 16 Jan 2019
@woodpeck
I already responded to a different part of your post, but something else about it kept niggling at me. I finally figured out what.
If there's a wall, map the wall. But you can't see where the plot is.
Yes you can. Maybe not on all allotments but on some of them. I know because I've mapped my local allotments using a combination of aerial imagery and survey. Most of the plots are clearly visible from one or the other.
So don't map it's outline, and don't encourage people to invent and map some outline it by rendering it.
And that's the bit that niggled me. You're implying that mappers invent stuff, and the more types of object we render the more they'll invent. If I can't figure out what something is, I don't map it. You make it sound like I'm in the minority. If you're right then we should all give up on OSM entirely, because by that thinking most mappers will just make stuff up because they can.
eehpcm
on 16 Jan 2019
@Adamant36
Going off that also assumes there's a bunch of plot information sources to import in the first place. Which probably isn't true. I doubt the venders of most allotments know how to turn there maps into shape files
They wouldn't know how and wouldn't see the point if they did know how. But they may produce a hand-drawn map for their own reference, as my local allotment association did, which they made available to me. Which confirmed most of the plot borders I could _already see_ on aerial imagery and gave me the plot numbers. I consider that hand-drawn map to be an authoritative source and also verifiable (any other mapper could also request it, and a copy is on display at the allotment itself). But let me repeat, for the benefit of people who keep insisting that plot borders are invisible, that (at least for some allotments) those borders are clearly visible.
Here's a question for the "invisible borders" people, and the "unverifiable" people. What if the operator of the allotments signed up with OSM and added the plots personally? What spurious objections would you then come up with to disallow them? I figure "local knowledge" is a legitimate source. I figure a hand-drawn map made by the allotment operator and made available to a mapper for the specific purpose of adding the plots to OSM is "local knowledge."
eehpcm
on 16 Jan 2019
Take a look at these allotments in your favourite editor. Turn off the OSM data layer.
If I turn off the data layer, I see the JOSM background. When I load Bing / DigitalGlobe / ESRI imagery, I see that the mapper has aligned the plot mapping sometimes to physical objects like flowerbed boundaries or hedges, and sometimes the boundaries go through the middle of an equally dark area. Vegetation is different on different images.
So, what physical objects that delineates the boundary are you expecting me to see, and which aerial image are _you_ looking at?
polarbearing
on 16 Jan 2019
If I understand you correctly, using it for rendering refs would be OK, but explicitly showing it would be bad?
That's what I mean. The refs can be treated similar to addr:housenumber, labelled from a node or the middle of a polygon. I'd not show the plot outline.
polarbearing
on 16 Jan 2019
It doesn’t look like the maintainers want to add new features such as these
until the next database reload, which could be some time from now. See #3644
On Wed, Jan 16, 2019 at 10:00 PM polarbearing notifications@github.com
wrote:
If I understand you correctly, using it for rendering refs would be OK,
but explicitly showing it would be bad?That's what I mean. The refs can be treated similar to addr:housenumber,
labelled from a node or the middle of a polygon. I'd not show the plot
outline.—
You are receiving this because you were mentioned.
Reply to this email directly, view it on GitHub
https://github.com/gravitystorm/openstreetmap-carto/issues/432#issuecomment-454770530,
or mute the thread
https://github.com/notifications/unsubscribe-auth/AoxshDDnyQ3h4jyvmEAPc-PQlhS9Am7gks5vDyJpgaJpZM4BsD7z
.
jeisenbe
on 16 Jan 2019
@polarbearing
If I turn off the data layer, I see the JOSM background. When I load Bing / DigitalGlobe / ESRI imagery, I see that the mapper has aligned the plot mapping sometimes to physical objects like flowerbed boundaries or hedges,
I'm glad you can see the hedges. Because there aren't any hedges. Those "flowerbed" boundaries are plot boundaries. They aren't even accumulations of weeds. They're the thin strip between plots where neither operator has dug/tilled the ground. And in many cases they're visible on aerial imagery. So much so that you thought they were hedges.
and sometimes the boundaries go through the middle of an equally dark area. Vegetation is different on different images.
It's also different between aerial imagery and on the ground. A survey helped me identify some boundaries. As did the placement of sheds.
And what also helped was a hand-drawn map the allotment operator sent me for the explicit purpose of adding the plots. Given the boundaries that were clearly visible in aerial imagery and/or on the ground, that map let me fill in the rest. That map counts as local knowledge, a permitted source. It is authoritative and definitive. And it's verifiable. A copy is displayed in the window of a shed on the allotment.
It's not as verifiable as it could be. When I asked the operator for clarification about some of the plot numbers (too blurry to make out) I had to admit that currently they would not be rendered. The allotment operator lost interest in the matter. So I had the potential of making 20 people aware of the existence and utility of OSM, some of whom might then evangelize or even become mappers. Instead I have an allotment operator who probably bad-mouths OSM if asked about it.
It must be me that's in the wrong. I had the bizarre idea that mapping things that people want to see mapped would help popularize OSM.
eehpcm
on 16 Jan 2019
@jeisenbe
It doesn’t look like the maintainers want to add new features such as these until the next database reload,
Sigh. I can't understand the reasoning behind that attitude. Somebody adds or edits an allotment plot or healthcare hospital and it renders. That person is happy and moves on to map something else. Maybe, just maybe, there's a slender chance that somebody notices a healthcare hospital has rendered but one he/she mapped some time ago hasn't. If so, there's a good chance that person tries editing the old object and magically it renders. There's a slender chance that (on top of wondering why their object isn't rendered but other instances of that object are) the person checks github issues first, and realizes an edit will fix it. There's a very slender chance that the person (after noticing a rendering disparity) raises the problem on github without checking if it's already a known issue.
Is delaying fixing a problem to any extent whatsoever better than a partial fix that will, subsequently, become a full fix? It appears the maintainers think so. I don't see it.
which could be some time from now.
It's been 4 years and counting for allotment plots. Weeks or months won't make much difference. Years would become frustrating.
eehpcm
on 16 Jan 2019
Those "flowerbed" boundaries are plot boundaries. They aren't even accumulations of weeds. They're the thin strip between plots where neither operator has dug/tilled the ground.
This example proves me it's worth rendering plot boundaries.
It's been 4 years and counting for allotment plots. Weeks or months won't make much difference. Years would become frustrating.
I believe lack of decision is the worst thing when someone is waiting. We have more issues accumulated from 1,5 year, so it would be best to do database reload anyway. Let's hear the response from OSMF OWG first, so we could synchronize things - https://github.com/openstreetmap/chef/issues/211.
kocio-pl
on 17 Jan 2019
3786 will import allotments as a polygon key after the next database reload. This has not yet been scheduled. After that, it would be possible to consider rendering this feature.
jeisenbe
on 7 Sep 2019
If ever it does get rendered, please consider rendering the name of the plot (if it has one), or the ref (if it doesn't have a name). Here is a very crude attempt with uMap at getting allotment plots to render with plot labels appearing, and the allotment label disappearing, at higher zooms; and borders appearing at medium to high zooms. Zoom out to see things disappear. Yes, it's ugly. I'm sure you guys can do it better.
eehpcm
on 7 Sep 2019
It is now possible to submit a PR to render this feature. Since v5.0.0 all allotments=* features will be imported as polygons when mapped as closed ways.
jeisenbe
on 13 Apr 2020
Related issues
 Thorwynn
·
3Comments
Thorwynn
·
3Comments
 Vort
·
3Comments
Vort
·
3Comments
 lakedistrictOSM
·
3Comments
lakedistrictOSM
·
3Comments
 jengelh
·
4Comments
jengelh
·
4Comments
 boothym
·
5Comments
boothym
·
5Comments
Most helpful comment
This example proves me it's worth rendering plot boundaries.
I believe lack of decision is the worst thing when someone is waiting. We have more issues accumulated from 1,5 year, so it would be best to do database reload anyway. Let's hear the response from OSMF OWG first, so we could synchronize things - https://github.com/openstreetmap/chef/issues/211.