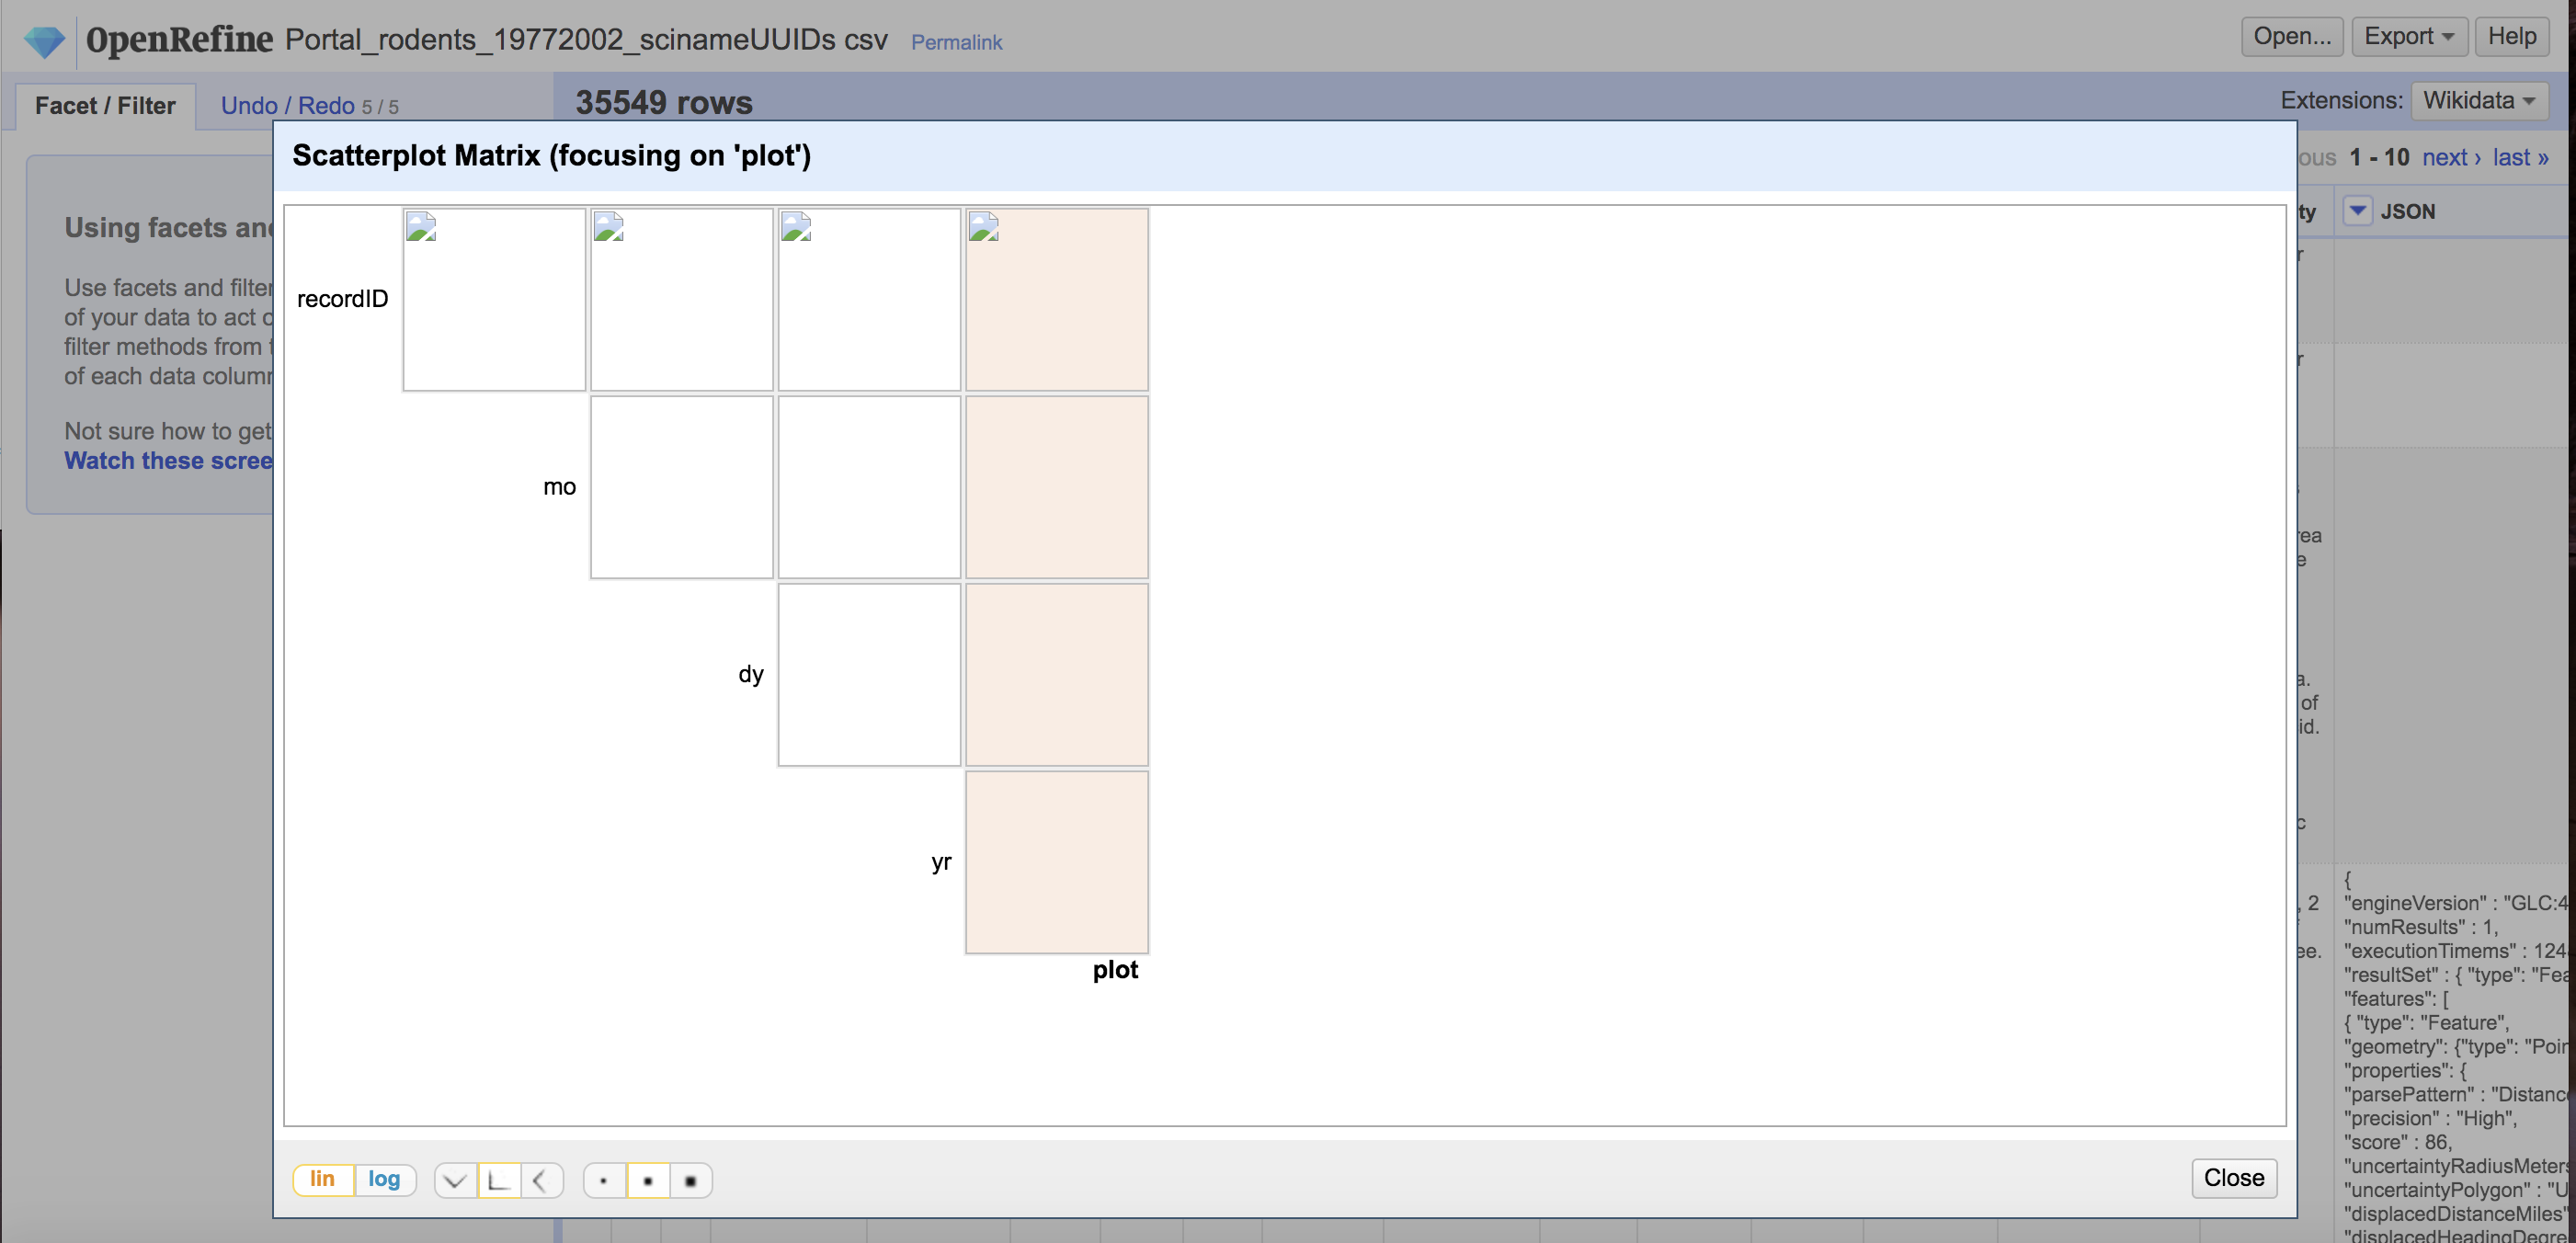
The plots are not displaying when I do a scatterplot facet. Using the current edition of OR. Tried it in both Firefox & Mozilla on a Windows 10 Machine (scatterplots failed to display in both browsers, though the failure to display looked different in the different browsers). I tried it with two different data sets, on three different machines.
 suezwicker
All 4 comments
@suezwicker if you can get hold of any screenshots, I think it would help understand the issue.
 wetneb
on 15 Aug 2019
wetneb
on 15 Aug 2019
It’s working on the computer I’m using today.
I’ll check tomorrow when I’m back in my other office, & screenshot if it’s still not working.
Attached is a screen shot of a proper scatter plot. At the time that I put in my ticket, I was getting little ‘image missing’ icons on the top left of each box instead of a scatter plot.
Thx,
Sue
[cid:[email protected]]
From: Antonin Delpeuch notifications@github.com
Sent: Thursday, August 15, 2019 9:23 AM
To: OpenRefine/OpenRefine OpenRefine@noreply.github.com
Cc: Zwicker, Sue ZwickerS@si.edu; Mention mention@noreply.github.com
Subject: Re: [OpenRefine/OpenRefine] Scatterplot (#2117)
@suezwickerhttps://nam02.safelinks.protection.outlook.com/?url=https%3A%2F%2Fgithub.com%2Fsuezwicker&data=02%7C01%7Czwickers%40si.edu%7C080671729534438d915608d72183b9ab%7C989b5e2a14e44efe93b78cdd5fc5d11c%7C0%7C0%7C637014721964334088&sdata=%2BIBNYB1cXKWlcECC7Qs96IjkbnI6Dvsp1d0wldx%2FRKs%3D&reserved=0 if you can get hold of any screenshots, I think it would help understand the issue.
—
You are receiving this because you were mentioned.
Reply to this email directly, view it on GitHubhttps://nam02.safelinks.protection.outlook.com/?url=https%3A%2F%2Fgithub.com%2FOpenRefine%2FOpenRefine%2Fissues%2F2117%3Femail_source%3Dnotifications%26email_token%3DAIBEBAZ5EDCHXS36RZMHPL3QEVKEBA5CNFSM4IKXMDB2YY3PNVWWK3TUL52HS4DFVREXG43VMVBW63LNMVXHJKTDN5WW2ZLOORPWSZGOD4LZGCQ%23issuecomment-521638666&data=02%7C01%7Czwickers%40si.edu%7C080671729534438d915608d72183b9ab%7C989b5e2a14e44efe93b78cdd5fc5d11c%7C0%7C0%7C637014721964334088&sdata=i0khrY8bmK%2FDehUKc5ntzpKOmbl35PvuI4q2BAfmdKk%3D&reserved=0, or mute the threadhttps://nam02.safelinks.protection.outlook.com/?url=https%3A%2F%2Fgithub.com%2Fnotifications%2Funsubscribe-auth%2FAIBEBA4XW6YMVCFIVFNACWLQEVKEBANCNFSM4IKXMDBQ&data=02%7C01%7Czwickers%40si.edu%7C080671729534438d915608d72183b9ab%7C989b5e2a14e44efe93b78cdd5fc5d11c%7C0%7C0%7C637014721964344083&sdata=TJBYcCDsugcqetzKZa%2F5wv%2FgSgGT8KeuFLe58SAKV2A%3D&reserved=0.
suezwicker
on 15 Aug 2019
Hello, I am running into a similar issue with scatterplots with version 3.2. I am using an iOS (macOS High Sierra 10.13.6), Chrome browser (Version 76.0.3809.100 (Official Build) (64-bit)) Attached is a screenshot. For the dataset, we are working with the dataset from the Data Carpentries OpenRefine for Ecologists module (https://datacarpentry.org/OpenRefine-ecology-lesson/setup.html)
Thank you
 craigca
on 15 Aug 2019
craigca
on 15 Aug 2019
Came here looking to see if anyone had the same issue. I'm using the same dataset (from Data Carpentries OpenRefine for Ecologists), but I get the same problem when I try a different file. If I View Image on one of the broken panes, or try to export a plot, I get error messages that start like this (formatting is a bit awkward, sorry):
`
code | "error"
:-- | :--
message | "Cannot deserialize value of type int from String \"lin\": not a valid Integer value\n at [Source: (String)\"{\"name\":\"recordID (x) vs. mo (y)\",\"cx\":\"recordID\",\"cy\":\"mo\",\"l\":500,\"ex\":\"value\",\"ey\":\"value\",\"dot\":4,\"dim_x\":\"lin\",\"dim_y\":\"lin\",\"type\":\"scatterplot\",\"from_x\":0,\"to_x\":0,\"from_y\":0,\"to_y\":0,\"base_color\":\"888888\"}\"; line: 1, column: 111] (through reference chain: com.google.refine.commands.browsing.GetScatterplotCommand$PlotterConfig[\"dim_x\"])"
`
 atraxler
on 21 Aug 2019
atraxler
on 21 Aug 2019
Related issues
 felixlohmeier
·
23Comments
wetneb
·
28Comments
felixlohmeier
·
23Comments
wetneb
·
28Comments
 tfmorris
·
33Comments
tfmorris
·
33Comments
 psychemedia
·
45Comments
wetneb
·
30Comments
psychemedia
·
45Comments
wetneb
·
30Comments
Most helpful comment
Came here looking to see if anyone had the same issue. I'm using the same dataset (from Data Carpentries OpenRefine for Ecologists), but I get the same problem when I try a different file. If I View Image on one of the broken panes, or try to export a plot, I get error messages that start like this (formatting is a bit awkward, sorry):
`
code | "error"
:-- | :--
message | "Cannot deserialize value of type
intfrom String \"lin\": not a valid Integer value\n at [Source: (String)\"{\"name\":\"recordID (x) vs. mo (y)\",\"cx\":\"recordID\",\"cy\":\"mo\",\"l\":500,\"ex\":\"value\",\"ey\":\"value\",\"dot\":4,\"dim_x\":\"lin\",\"dim_y\":\"lin\",\"type\":\"scatterplot\",\"from_x\":0,\"to_x\":0,\"from_y\":0,\"to_y\":0,\"base_color\":\"888888\"}\"; line: 1, column: 111] (through reference chain: com.google.refine.commands.browsing.GetScatterplotCommand$PlotterConfig[\"dim_x\"])"`