Openrefine: Why not a column variable ?
I see several questions on StackOverflow that involve being able to iterate each cell of a column, for example here or here. Since Open Refine has not a "column" variable, I have to advise each time to create a unique false record for the entire dataset, and then use row.record.etc.
Would it be a good idea to create a column variable that allow to treat each cell of a column as an element of an array?
 ettorerizza
All 36 comments
That would break the idea behind OpenRefine's data model, that transformations are applied row-wise (or record-wise). Most transformations in OpenRefine can be applied to a data stream, where each row is discovered gradually: you don't need to know the whole dataset before starting to run your operations on it. While that's indeed a restriction for the user, it's a very useful guarantee to have if we want to develop more scalable backends (for instance in a map-reduce fashion).
So, I might be wrong, but this really looks like an important design decision to me. OpenRefine is not a spreadsheet software.
That being said, there already are some exceptions to this philosophy (for instance, the transpose operations), so it wouldn't be the first hack that bypasses the spirit of the model.
 wetneb
on 17 Nov 2017
wetneb
on 17 Nov 2017
Another related question on the mailing list : https://groups.google.com/forum/#!topic/openrefine/kOyVbjbe6s8
ettorerizza
on 21 Nov 2017
OpenRefine has traditionally stayed away from providing Statistics and will
remain that way (yes, I myself am making a hard line, here's why). There
is such a rich ecosystem of great opensource tools that already provide
tons of value for users. And for OpenRefine users, its just an export away
to get that value.
We can certainly make it a bit easier to integrate with other tools, and in
fact the JDBC connector option that we are working on is one of those
ways. We're working on others as well. Keep the ideas coming on what
other tools / processes that you would like OpenRefine to somehow
integrate. That's what we want to hear about, (and not discussions about
adding everything including the kitchen sink into OpenRefine) :)
 thadguidry
on 21 Nov 2017
thadguidry
on 21 Nov 2017
@thadguidry @wetneb No problem to close the discussion. But I want to make sure I've been clear, because the column variable I'm proposing is not primarily about making stats or turning Open Refine into a spreadsheet. Its main purpose would be to be able to answer questions such as "in the following dataset, what names in ColumnA are also in ColumnB?"
ColumnA, ColumnB
Jean, Albert
Albert,Jean
Pierre,Thad
Antonin,Jacky
I can answer the question using a cheap trick, but it's difficult for users to understand the logic behind it.
ettorerizza
on 22 Nov 2017
@ettorerizza The slippery slope. Your asking questions about data, and more advanced questions. Working with Arrays seems to be a growing need for our OpenRefine users and that question falls into that Category. I'm worried and wondering about the presentation to the user as well as further operations needed or wanted. Let's walk through some scenarios...
- You ask OpenRefine that question with a new menu option on ColumnA "UNION against other Column" or through a Transform with a new GREL function.
cells["ColumnA"].union(ColumnB)
It produces what is called an Intersection in Mathematics ( A ∩ B ) and its output could be represented as an array
["Jean","Albert"]
or held in heap memory, or not outputting anything at all, until we have the full command or operation that you want to perform with that Intersecting Set.
Does OpenRefine display that array ? always ? what if its 3.5 million elements in that Set ?
- You ask OpenRefine to produce an Array on ColumnA with Transform menu option.
We give you a way to produce an Array from the Column's list of values. We can hold it as a variable, call it
cells["ColumnA"].asArray()
(similar to numpy.asarray)
and it internally produces
["Jean","Albert","Pierre","Antonin"]
How do you intend to further use it ? What other commands would be useful before or after or with
cells["ColumnA"].asArray() ?
- Extending and overload join() seems hackish since it currently expects an Array, but we could make it produce one with a special case if the input was a Column list ? (I don't like special casing when there are alternative approaches, but...)
cells.ColumnA.join(",")
- ???
thadguidry
on 22 Nov 2017
I'm feeling (and I guess this is what @thadguidry is also saying) there are several different types of (potentially overlapping) requirements in this issue and they don't necessarily all have the same solution. It might be worth us considering the different cases separately and seeing whether there is a reasonable approach without breaking OpenRefine.
Perhaps our starting point should be one or more use cases describing the scenario and what the desired outcome is (basically formalising the examples Ettore has linked to so far)
For example I don't think we need a column variable to deliver (e.g.) a facet which provides a union of values across two columns (basically a union of two facets?)
 ostephens
on 22 Nov 2017
ostephens
on 22 Nov 2017
@ostephens Yeah, my scenarios are just to get you guys thinking , really thinking , about how you ideally would like to handle various things in OpenRefine. Write them up together in a Google Doc and share it, link it here. We need clarity from our Users on a lot of these advanced topics, then we can come to agreement. I won't shut the door on this issue now, until we get more clarity from you guys. :) But don't expect us to turn OpenRefine into a Stat tool, but sure some better advanced functions or viz or integrations with other tools we can work on.
OK, now go collaborate and then get back to us in this issue. :)
thadguidry
on 22 Nov 2017
I've before my eyes a user case which illustrates the potential utility of this variable "column". Let's take a txt file containing lines (for example those of an ocerized PDF) with no other structure than this one: the lines we are interested in are always followed by a line starting with the word "total".
Example:
row2
INTERESTING ROW1
total 1MB
row4
row5
row6
row7
INTERESTING ROW2
total 16MB
row8
INTERESTING ROW3
total 3MB
In the real file, interesting lines are not in capital letters. In fact, let's say that they do not contain any pattern that allows to filter them by a regular expression. They can only be found by first identifying the rows starting with "total", then taking the ones preceding them.
How to extract interesting lines with GREL? This is, I think, a fairly common problem.
Regarding the file size issue : is there no way to ensure that operations on a number of rows too large to fit in RAM are done by chunks, as does pandas with the argument chunksize (pd.read_csv ("very_big_file.csv", chunksize = 1000))?
ettorerizza
on 15 Feb 2018
@ettorerizza, I don't think this qualifies. The record capability can handle this:
- Reverse the ordering of your rows
- Create a new column based on there being a match to "^total [0-9]+MB$" (otherwise blank).
- Move the new column to the beginning and switch to record mode.
Your interesting rows are then the second element in the record.
The record variables can then be used to extract the interesting rows. Fill down can be used, followed by a re-sort, if you want your data back in the original order.
I like the record model as while it breaks the row-based, stream-friendly data model, it does so in a very limited fashion by only giving access to nearby rows (i.e., rows in the same record).
 nanobrad
on 25 Mar 2019
nanobrad
on 25 Mar 2019
@nanobrad's comment has flagged this issue to me again, and I can see after suggesting a way forward I left @ettorerizza's use case hanging.
The two appraoches that spring to mind for the use case that @ettorerizza describes are:
- Supporting the ability to reference a row offset of some kind
OR - Adding more flexibility to Records mode to allow records to be created in a variety of ways (as @nanobrad describes, you can convert the type of pattern described into Records, and that is how I'd currently solve the problem as a user, but it's a bit convoluted)
I don't think either of these approaches would mean keeping all values in a column in memory at once, and I think could still fulfil the criteria "Most transformations in OpenRefine can be applied to a data stream, where each row is discovered gradually".
but I have to admit that coding wise this dives into parts of OpenRefine I've tended to avoid looking at, so I'm shooting in the dark here a bit
ostephens
on 29 Mar 2019
I do not know if the example I gave was the most relevant. Here is a simpler one. I have a column of numbers:
1
2
3
4
How can we calculate the sum of the values contained in the column (or their average)? We can use the Stat extension, but it is no longer compatible with OR 3.2. We can also create a dummy record for the whole dataset, like this:
Id              MyColumn
anyword         1
                2
                3
                4
From there, we can calculate what we want with this column, since there is a variable row.record.cells that allows treating the records (here all the dataset) as arrays. Now, we can get our sum by doing:
row.record.cells.MyColumn.value.sum ()
My question was basically: cannot we simplify all this to access the column directly as an array? My proposal is not revolutionary, that's how Pandas, R and so on model their dataframes.
ettorerizza
on 29 Mar 2019
By the way, the fact that the row.record variable requires a column name (row.record.cells['Explicit Column Name'].value) limits its possibilities. For example, we cannot use it with All -> Transform. It would be useful to simplify this formula a bit.
ettorerizza
on 29 Mar 2019
Yes it's not revolutionary and yes it makes sense in a lot of other tools.
But OpenRefine is just not designed for that, in my opinion. If you want to compute the sum of values of a column as you would do in Excel, you will run into another issue: there is no simple way to add a single row at the end to hold the total (and again, that is for a good reason: it's a different task than what OpenRefine is designed for). And then you are going to have a hard time isolating this row (unless you flag/star it manually, but that's quite ugly).
I think it's worth explaining what harm you would do by adding a feature like that. Because yes, it's easy to implement, and you need it, so why would we forbid you from doing that?
Currently, the variables available to GREL expressions can all be computed locally, either from the current record or the current row (depending on the mode). That means most workflows can in principle be parallelized, and if we get a chance to revamp the backend to use modern map/reduce-like backends, we would critically rely on this guarantee to leverage the locality and get an efficient implementation, that scales well.
Now, you can say that at the moment it does not make any difference because everything is loaded in memory anyway. But this means that we would let users develop workflows that would later become unsupported.
I think it is worth making clear that OpenRefine is great, but is really not suited to every job you might want to do on a table. OpenRefine is good at what it is designed for - we should not add hacks to pretend it is suited for other things.
That being said, if people want to implement it as an extension (just like the extension which adds blank rows to a project), I think it would make sense to make sure OpenRefine makes it possible for extensions to add new GREL variables.
wetneb
on 29 Mar 2019
Thanks for these explanations, @wetneb (that answer the question and allow me to explain it myself if asked).
ettorerizza
on 29 Mar 2019
So with the two use cases that @ettorerizza describes - my view would be:
The first one is about cleaning the data in someway - I absolutely see it as the kind of problem that OpenRefine should help with and should provide tools for doing it.
The second is about (admittedly simple) statistical analysis - which I don't see as part of OpenRefine's core functionality
So I'm very much favour in finding solutions to the first type of problem, but not so much the second (not that I want to make these things impossible in OpenRefine, just not the focus for how we build the software).
That said - these are my views and I think as a community we should discuss them and the trade-offs - this should be something we work towards as a community
ostephens
on 29 Mar 2019
@ostephens I completely agree. But often both dimensions (data cleaning and analysis) intertwine. Tools like workbench have integrated it, and may become serious alternatives to OpenRefine. I understand perfectly that OR can't offer all the features of a spreadsheet, but basic descriptive statistics on the dataset seem essential to me in a data cleaning tool.
ettorerizza
on 29 Mar 2019
@ettorerizza what would you see as the fundamental "basic descriptive statistics" for a dataset? Can you say a bit more about how they help with the data cleaning process?
ostephens
on 29 Mar 2019
I mean (for a numeric column) max, min, mean, median, sum, things like
that. The stat extension is (was) very useful for this, IMHO it probably
deserves to be updated and integrated in OR core.
Almost all of these things can be visualized with facets, but it's much more convenient to have them at a glance in a quick summary. This allows to immediately see if something is wrong in the dataset.
ettorerizza
on 29 Mar 2019
I think it would be nice to integrate these statistics in facets directly - we can already use facets to compute extremal values. Similar statistics could be made available there, and potentially integrated in the visualization (for instance the mean/median could be displayed in the histograms for numeric facets). But it would need to be non intrusive so that it does not take up much more space than facets currently occupy, I think.
That would have the advantage of letting users compute these statistics for arbitrary expressions without creating them in a new column.
wetneb
on 29 Mar 2019
This was exactly what occurred to me @wetneb (although every time I use a facet with a histogram I die a little bit inside)
ostephens
on 29 Mar 2019
(why, what is wrong with the histograms? is it an issue with the way "binning" is done, the bounds the UI let you define, maybe?)
wetneb
on 29 Mar 2019
I think it is a mixture of the binning and the UI - it always feels incredibly clunky, fiddly to select the ranges you want, no easy option to get more fine-grained binning on particular ranges...
IMO :)
ostephens
on 29 Mar 2019
I think it would be nice to integrate these statistics in facets directly
If OpenRefine wants to attract datajournalists, that seems essential to me. Most of them do not need the full functionality of Excel, so calculating averages, sums, and percentages is enough. "In the 'gender' column I filter men, I look at the average, and that's fine, I can write a line about that in my article." Forcing them to open Excel for such basic calculation would be counterproductive. But this is maybe part of another discussion.
ettorerizza
on 29 Mar 2019
I've opened an enhancement request for this. @ettorerizza if you were able to add:
- An example data set
- Any information about how this basic stat data might help with data cleaning tasks (e.g. is "select all rows with values in the 1st Quartile" a useful thing to do? Trying to get an idea of what functionality might be needed here)
- Any ideas of how you would like this to display in a facet - e.g. as @wetneb suggests overlaid on the histogram
and Any other information...
That would be brilliant
ostephens
on 29 Mar 2019
@ostephens I will gather some examples. The first that comes to my mind is the filling of missing values. In many scientific fields, "data cleaning" means filling these values one way or the other, for example with the mean or median of the column.
ettorerizza
on 29 Mar 2019
I think it is a mixture of the binning and the UI - it always feels incredibly clunky, fiddly to select the ranges you want
Yep, selecting values in the histogram is a pain when the majority of them are grouped into a single bin. Numeric log facet is more convenient but it also displays the logarithm of values, which is not very human-friendly to select the ones we are interested in.

ettorerizza
on 29 Mar 2019
UPDATE: Basic stats in OpenRefine (visual or not), I am OK with, but beyond that...
So....
This is a long-standing debate on what to offer in OpenRefine as a direct feature, and what could be offered as Community extensions or integrations.
Data Analysis as done by most Data Scientists and Data Journalists has been thoroughly investigated by me and David Huynh in the past as to their wants/desires. We know and realize that its an important need by those communities. As @wetneb stated however, Data Analysis is not a primary feature of OpenRefine.
Having said that, instead what we have tried to do is boost the knowledge and awareness for developers of Data Analysis tools to offer them some ideas and provide guidance and collaboration opportunities for integrations with OpenRefine. As a matter of fact, that is exactly what transpired when I gave my talk last year at the Dallas R meetup, and opened an issue for collaboration and ideas, as well as our main Wiki page to collaborate OpenRefine integration ideas with R lang and Jupyter We have some limited interest from various developers (like Tony Hirst @psychemedia and others) , most can be seen on the mailing list.
What I would suggest, @ettorerizza is that rather than request Features around Data Analysis in OpenRefine, that you instead become our Data Analysis Ambassador and try to win some more hearts (and developer contributions!!!) from the Python and R communities to hack on integrations. (I've given many ideas to all in the issues, wiki, and mailing list in the past, even most recently with GraalVM in the issue on that Wiki page.
thadguidry
on 29 Mar 2019
Hi @thadguidry . I do not ask for any feature in data analysis. I use other tools much faster for that. And if I want to quickly get a statistic about a column, I can write a little Jython one-liner (BUT at the cost of the clunky manipulation that I mentioned above, ie adding a false record for the entire dataset). The summary statistics we are discussing here are not data analysis for me; they are just basic information about the dataset and its columns. A bit like the number of rows/records that OpenRefine constantly displays on the screen.
ettorerizza
on 29 Mar 2019
This is the way to go. You could overload the histogram facet, but I would
suggest a separate "Statistical Facet" that allows the user to explore a
column's quartiles, outliers, and sigmas in a more precise fashion than the
current histogram. I would do a Gaussian (or Normal) mode and a quartile
mode.
Quartile mode would use the rules of the ggplot box plot to determine
outliers (1.5*IQR).
Gaussian mode would use sigmas.
Give a "choices" link that allows one to copy all the statistics like the
current plugin.
To cleanse:
- Select all rows outside +/- 3 sigma
- Determine validity, mass delete, etc.
GREL could be extended with a facet* function (like facetCount), which are
already inherently column based (and I assume indexed/cached).
On Fri, Mar 29, 2019, 6:46 AM Owen Stephens notifications@github.com
wrote:
I've opened an enhancement request for this. @ettorerizza
https://github.com/ettorerizza if you were able to add:
- An example data set
- Any information about how this basic stat data might help with data
cleaning tasks (e.g. is "select all rows with values in the 1st Quartile" a
useful thing to do? Trying to get an idea of what functionality might be
needed here)- Any ideas of how you would like this to display in a facet - e.g. as
@wetneb https://github.com/wetneb suggests overlaid on the histogramAny other information...
—
You are receiving this because you were mentioned.
Reply to this email directly, view it on GitHub
https://github.com/OpenRefine/OpenRefine/issues/1340#issuecomment-477969206,
or mute the thread
https://github.com/notifications/unsubscribe-auth/AAke1xWWDo0DDJqM4DdPHKsZWNG1dRw8ks5vbf0VgaJpZM4QiKuL
.
nanobrad
on 29 Mar 2019
@nanobrad thanks - could you add this comment to #2001 so we can capture all requirements under that issue please? Also examples or rough sketches of how you expect this to look would be great
ostephens
on 29 Mar 2019
@ettorerizza Yes, I know, and understand... you want a nice visual or a report dialog that shows what Pandas DataFrame.Describe() does as well as other stats. Yes, that was a common need asked before in Journalist meetings. I'm OK with that and either a report dialog or Facets, but not much more built into OpenRefine. The "more" would be handled by better integrations with other Data tools as proposed on our Wiki page.
thadguidry
on 29 Mar 2019
@thadguidry I would say that the most important part for me is that OpenRefine can be used as a Swiss knife for basic analysis. That is, it is possible to perform both a data cleanup and a few quick calculations without having to switch to another software.
Here is, for example, a dataset that I use for an introductory data journalism course.
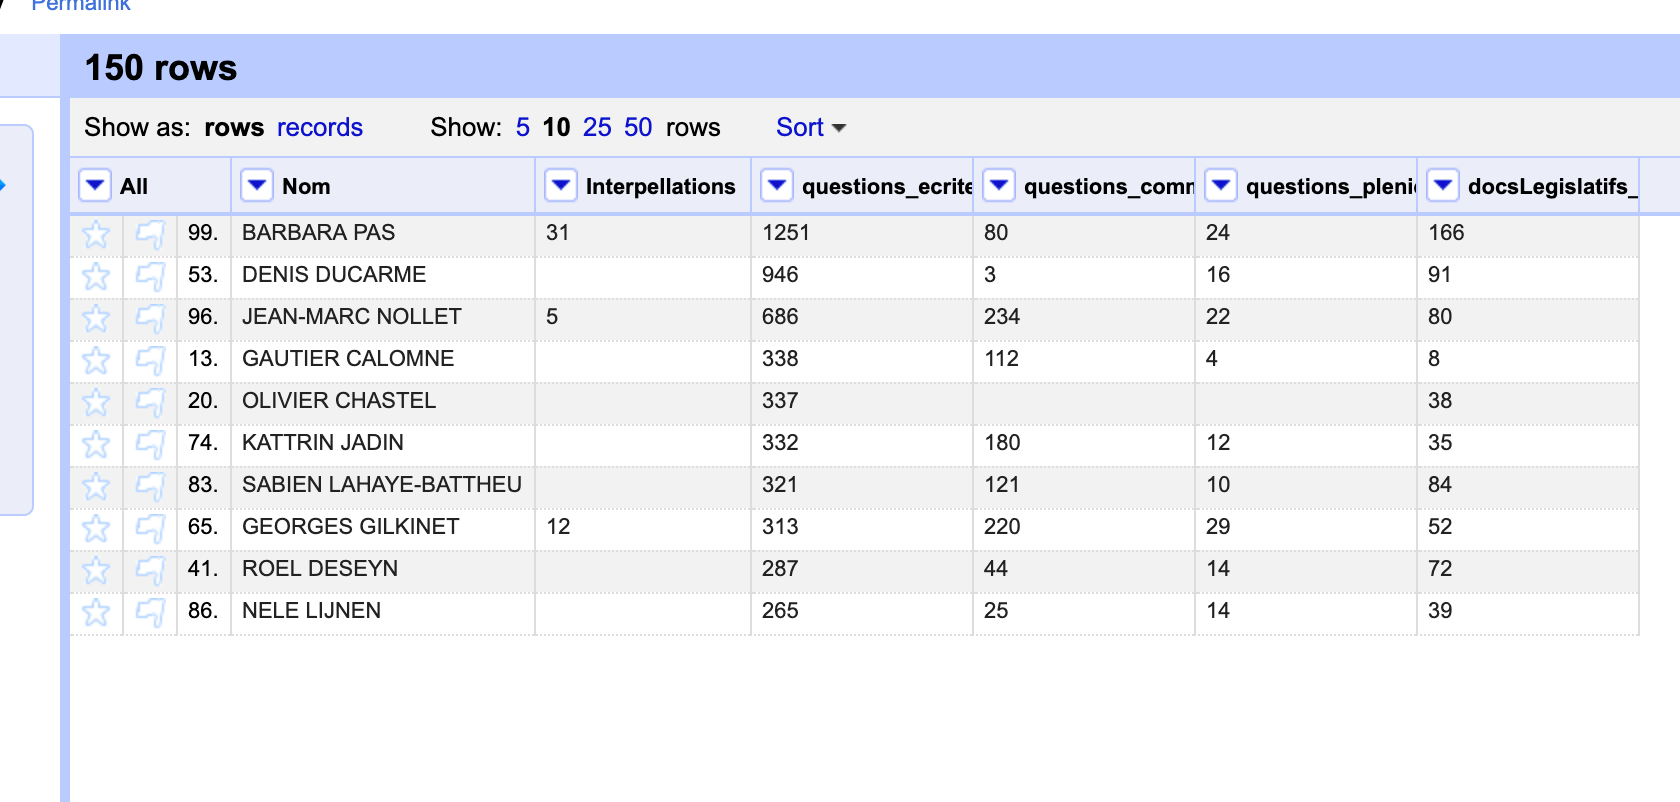
After cleaning out the MPs names, let say that I want to simply focus on those whose number of written questions ("questions écrites") is in the upper median, or above average. Without the stat extension, I should tell students to export their dataset and reopen it in Excel or Google Spreadsheet. Which makes two tools to explain for a basic manipulation.
Whatever the power of OpenRefine, this is not a sustainable way to teach DDJ at a time when all-in-one tools more user-friendly appeared. I feel that the current trend (at least in data journalism and in the geeky librarian world) is towards integrated tools that do a bit of everything. I suspect it must be a reaction to the daunting number of tools that a novice data wrangler is supposed to learn.
So, as a user, I would say in summary: OK that OpenRefine never becomes a full-fledged data analysis or visualization tool, and obviously OK for better integration with existing platforms like G Spreadsheet, Rstudio or Jupyter Notebooks; but that does not prevent us from thinking about what can make it a standalone tool for fairly simple needs - those of the majority of users, such as journalists, librarians, Wikidata lovers and so on.
ettorerizza
on 29 Mar 2019
@ettorerizza Point taken. And we seem to be in agreement.
thadguidry
on 29 Mar 2019
I see several questions on StackOverflow that involve being able to iterate each cell of a column, for example here or here.
Hi @ettorerizza, just to tell you, your two cases are different.
For #2, there is a simple grel function in v3.4. It's actually the cross() function that got a major boost.
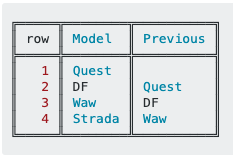
You can now easilly do, from a « Transform » on column Previous, or a « Create column from… » from any column: cross(cells["row"].value - 1, "ProjectName", "row")[0].cells["Model"].value
For #1, you could first create a new sequential numerical ID column with index+1 as calculation, and do the same trick.
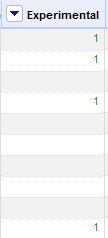
ID|Experimental|calculated
-|-|-
1|1|null
2|1|1
3||2
4|1|1
5||2
6||3
7||4
8||5
9||6
10|1|1
Can be done with: if(value != "", value, cross(cells["ID"].value - 1, "ProjectName", "ID")[0].cells["Experimental"].value + 1).
But, this could be done without creating any new column. If we incorporation « Enhance cross() with empty "project name" calling parameter to represent the current project and empty column name to represent the index #2504 », then, it would simply be: if(value != "", value, cross(rowIndex - 1)[0].cells["Experimental"].value + 1).
I think it could be VERY handy to have that. What do think?
Regards, Antoine
 antoine2711
on 6 Apr 2020
antoine2711
on 6 Apr 2020
That would break the idea behind OpenRefine's data model, that transformations are applied row-wise (or record-wise). Most transformations in OpenRefine can be applied to a data stream, where each row is discovered gradually: you don't need to know the whole dataset before starting to run your operations on it. While that's indeed a restriction for the user, it's a very useful guarantee to have if we want to develop more scalable backends (for instance in a map-reduce fashion).
Hi @wetneb. I think we have already unleashed the demon…
ID|Nom|Escalier
-|-|-
1|"Antoine"|null
2|"Antonin"|null
3|"Anthony"|null
4|"Anton"|null
And then: « Transform » on column « Escalier » with: cross(cells.ID.value - 1, "ProjectName", "ID")[0].cells.Nom.value + cells.Nom.value + " + "
ID|Nom|Escalier
-|-|-
1|"Antoine"|null
2|"Antonin"|"Antoine + "
3|"Anthony"|"Antonin + Antoine + "
4|"Anton"|"Antonin + Antoine + Anthony + "
That being true, maybe today, but per our philosophy, this is in no way guarantee to work. Note that this ONLY happens if you read the column you are writing to…
Regards, Antoine
antoine2711
on 6 Apr 2020
Sure, we already have functions which can be used to escape the restriction to only look at values in a given row: cross, but also facetCount, and others if I recall correctly.
wetneb
on 6 Apr 2020
Related issues
wetneb
·
3Comments
thadguidry
·
4Comments
antoine2711
·
3Comments
 dantexier
·
4Comments
dantexier
·
4Comments
 kushthedude
·
3Comments
kushthedude
·
3Comments
Most helpful comment
This is the way to go. You could overload the histogram facet, but I would
suggest a separate "Statistical Facet" that allows the user to explore a
column's quartiles, outliers, and sigmas in a more precise fashion than the
current histogram. I would do a Gaussian (or Normal) mode and a quartile
mode.
Quartile mode would use the rules of the ggplot box plot to determine
outliers (1.5*IQR).
Gaussian mode would use sigmas.
Give a "choices" link that allows one to copy all the statistics like the
current plugin.
To cleanse:
GREL could be extended with a facet* function (like facetCount), which are
already inherently column based (and I assume indexed/cached).
On Fri, Mar 29, 2019, 6:46 AM Owen Stephens notifications@github.com
wrote: