Nivo: Is there a histogram chart component?
Struggling to find a histogram chart. Can someone point me to a sample?
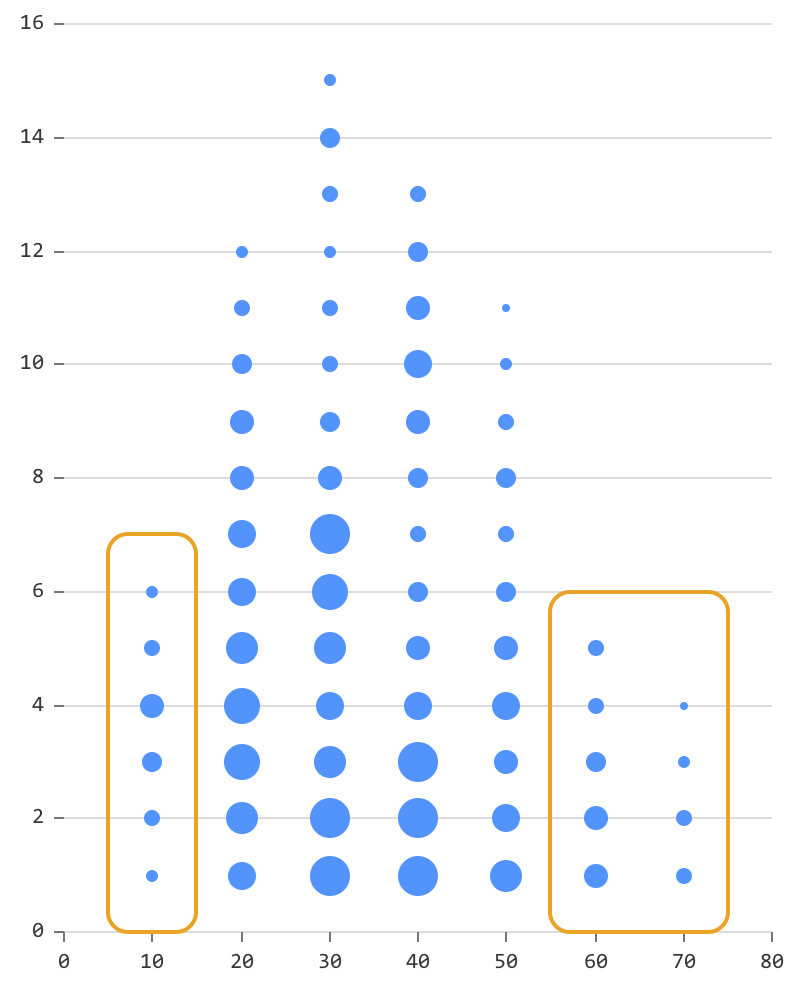
We want to create a chart component that is half bubble chart, half histogram.
So far, the closest we have found is this bubble chart that uses an axes similar to a bar chart
This is what we are aiming to re-create using Nivo. Any histogram samples would get us going in the right direction.

 simongis
All 10 comments
Appart from the Bar component, there's no such pre-made chart, however you'll probably be able to achieve this using the ScatterPlot component.
 plouc
on 29 Nov 2018
plouc
on 29 Nov 2018
I've created an example using the ScatterPlot component => https://codesandbox.io/s/komnl0zx25
plouc
on 29 Nov 2018
Wow! Excellent. Let me report back after the weekend. Big thanks
simongis
on 29 Nov 2018
any news on this?
plouc
on 11 Dec 2018
We struggled to get it to work to our requirements. Another dev will report his workings wirh a codepen sample tomorrow.
simongis
on 11 Dec 2018
@plouc
let me setting up a codepen.
Actually the chart will be used in the Webmap (Web that have the Map and UI component (chart) interact with the Map).
Example interaction is when we mouseover the Map, the chart e.g. the bubble highlighted and vice versa (mouseover the bubble, the Map highlighted).
 abumuawiyah
on 12 Dec 2018
abumuawiyah
on 12 Dec 2018
@abumuawiyah Can you get a codepen setup for this next week? Would still like to know if we can get better interaction between an Esri map and a custom histogram component.
simongis
on 15 Dec 2018
any update?
plouc
on 14 Jan 2019
Hi @plouc ,
I am sorry for not being responsive as currently moved to another project.
I have commit the code into my github
https://github.com/abumuawiyah/esrimapscatterplot
and can be review in Stackblitz
https://stackblitz.com/github/abumuawiyah/esrimapscatterplot
if you have issue review it in Stackblitz,
you can access it here:
http://iluvnivoandesri.surge.sh/
the chart & map-interaction code can be view here:
src/components/react-mapview/map/index.js
What we need to do with Nivo chart and map is, if we are hovering the map, we would like the plot/bubble highlighted as well.
I personally like Nivo especially on responsiveness and we plan to use Nivo chart as core chart library.
abumuawiyah
on 15 Jan 2019
I'm closing this issue as I was able to reproduce the example. @abumuawiyah, the example doesn't seem to work on Stackblitz :/
Feel free to comment if you have other questions.
plouc
on 21 Mar 2019
Related issues
 p45mark
·
3Comments
p45mark
·
3Comments
 stahlmanDesign
·
3Comments
stahlmanDesign
·
3Comments
 KENNYSOFT
·
3Comments
KENNYSOFT
·
3Comments
 pratikguru
·
3Comments
pratikguru
·
3Comments
 ellipticaldoor
·
4Comments
ellipticaldoor
·
4Comments
Most helpful comment
I've created an example using the ScatterPlot component => https://codesandbox.io/s/komnl0zx25