Nivo: How I can avoid float numbers on y axis?
Right now I have this chart
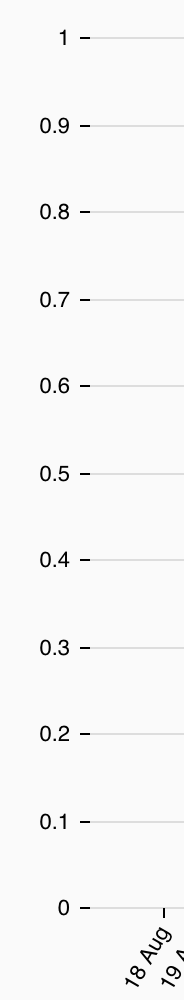
But I know that I'm never going to have float values, can I only show integers?
 ellipticaldoor
All 4 comments
Yes, you can set the tickValues property to [0, 1] for example.
 plouc
on 19 May 2018
plouc
on 19 May 2018
@plouc is there no other option? What if the y values are in the thousands?
 strahius
on 2 Dec 2019
strahius
on 2 Dec 2019
Recently ran into the floats problem while visualising data with a narrow range of values (single-digit; with a wide range of values this shouldn't happen anyway?).
tickValues also takes a number which will then define the number of ticks to display (docs). So if you use the number of unique values on the axis as argument, the floats should be gone:
<Line
axisLeft={{
tickValues: data.reduce((set, { y }) => set.add(y), new Set()).size
}}
/>
 kkkrist
on 5 Mar 2020
kkkrist
on 5 Mar 2020
Had a similar problem where it didn't make sense to show these float intervals:
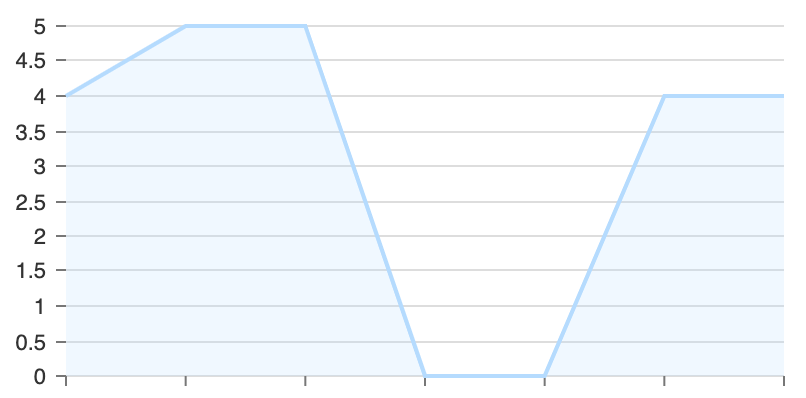
Found a solution to this problem via https://stackoverflow.com/a/12643613
can set format to:
<Line
  axisLeft={{
    format: e => Math.floor(e) === e && e
  }}
/>
Which will result in the tick values of any floats not showing:
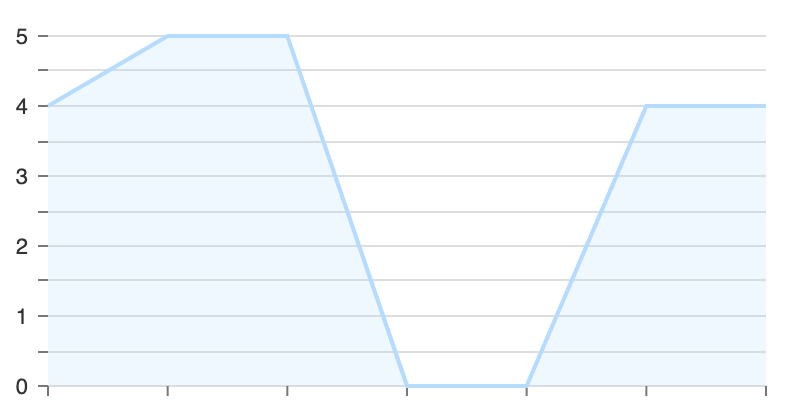
This should work with a dynamic interval range (not limited by the data itself)
 timbrunette
on 28 Apr 2020
timbrunette
on 28 Apr 2020
Related issues
 stahlmanDesign
·
3Comments
stahlmanDesign
·
3Comments
 p45mark
·
3Comments
p45mark
·
3Comments
 PattieC4ke
·
3Comments
PattieC4ke
·
3Comments
 danpettay
·
3Comments
danpettay
·
3Comments
 vagnervst
·
4Comments
vagnervst
·
4Comments
Most helpful comment
Had a similar problem where it didn't make sense to show these float intervals:

Found a solution to this problem via https://stackoverflow.com/a/12643613
can set
formatto:Which will result in the tick values of any floats not showing:

This should work with a dynamic interval range (not limited by the data itself)