Netdata: Netdata slaves dissapear after enabling TLS
Hi,
I have installed netdata with helm chart on kubernetes.
I have created backend with type graphite to send metrics to influxDB. However, after enabeling TLS, all the slaves are missing from netdata and only master is remaining. Here is my configuration in value.yaml:
master:
[web]
          ssl key = /etc/netdata/ssl/key/key.pem
          ssl certificate = /etc/netdata/ssl/cert/cert.pem
          bind to = *=dashboard|registry|badges|management|streaming|netdata.conf^SSL=force
          bind to = *=dashboard|registry|badges|management|streaming|netdata.conf^SSL=force *:20001=dashboard|registry|badges|management|streaming|netdata.conf
[backend]
          # host tags =
          enabled = yes
          type = graphite
          ssl skip certificate verification = yes
          hostname = netdata-master-0
          destination = tcp:influxdbIP:2003
          update every = 10
          send hosts matching = system. *

slave:
stream:
      enabled: true
      path: /etc/netdata/stream.conf
      data: |
        [stream]
          enabled = yes
          destination = netdata:19999:SSL
          api key = 11111111-2222-3333-4444-555555555555
          ssl skip certificate verification = yes
          timeout seconds = 60
          buffer size bytes = 1048576
          reconnect delay seconds = 5
          initial clock resync iterations = 60
Can someone please help me how to get back the slaves on netdata, and send the metrics to influxDB?
Thanks
 Peggy4444
All 58 comments
Hi @Peggy4444
Can you share exact values.yaml? The one from OP looks a little bit wrong.
all the slaves are missing from netdata and only master is remaining.
Have you checked master/slave logs? Is netdata master pod running? Are slaves pods running?
 ilyam8
on 28 Apr 2020
ilyam8
on 28 Apr 2020
HI @Peggy4444 ,
What is your Netdata version?
What are the slave logs related the connection after you set SSL?
 thiagoftsm
on 28 Apr 2020
thiagoftsm
on 28 Apr 2020
replicaCount: 1

image:
  repository: netdata/netdata
  tag: v1.20.0
  pullPolicy: Always

sysctlImage:
  enabled: false
  repository: alpine
  tag: latest
  pullPolicy: Always
  command: []

service:
  type: ClusterIP
  port: 19999
  # Use a static loadBalancerIP. Only to be used with type LoadBalancer
  # loadBalancerIP: 10.0.1.69

ingress:
  enabled: true
  annotations:
    kubernetes.io/ingress.class: nginx
    kubernetes.io/tls-acme: "true"
  path: /
  hosts:
    - netdata.k8s.local
#  tls:
#    - secretName: netdata-tls
rbac:
  create: true
  pspEnabled: true

serviceAccount:
  create: true
  name: netdata


master:
  resources: {}
    # limits:
    #  cpu: 4
    #  memory: 4096Mi
    # requests:
    #  cpu: 4
    #  memory: 4096Mi

  nodeSelector: {}

  tolerations: []

  affinity: {}

  env: {}
    # To disable anonymous statistics:
    # DO_NOT_TRACK: 1
  podLabels: {}

  podAnnotations: {}

  database:
    persistence: false
    # Set '-' as the storageclass to get a volume from the default storage class.
    storageclass: "-"
    volumesize: 2Gi

  alarms:
    persistence: false
    # Set '-' as the storageclass to get a volume from the default storage class.
    storageclass: "-"
    volumesize: 100Mi

  configs:
    stream:
      enabled: true
      path: /etc/netdata/stream.conf
      data: |
        [11111111-2222-3333-4444-555555555555]
          enabled = yes
          history = 3600
          default memory mode = save
          bind to = 0.0.0.0:19999
        [plugins]
          cgroups = no
          tc = no
          enable running new plugins = no
          check for new plugins every = 72000
          python.d = no
          charts.d = no
          go.d = no
          node.d = no
          apps = no
          proc = no
          idlejitter = no
          diskspace = no
          # [web]
          #ssl key = /etc/netdata/ssl/key/key.pem
          #ssl certificate = /etc/netdata/ssl/cert/cert.pem
          #bind to = *=dashboard|registry|badges|management|streaming|netdata.conf^SSL=force
          #bind to = *=dashboard|registry|badges|management|streaming|netdata.conf^SSL=force *:20001=dashboard|registry|badges|management|streaming|netdata.conf
        [backend]
          # host tags =
          enabled = yes
          # data source = average
          # type = opentsdb
          type = graphite
          #ssl skip certificate verification = yes

          #ssl skip certificate verification = yes
          #prefix = netdata
          hostname = netdata-master-0
          destination = tcp:10.104.188.65:2003
          update every = 10
          # buffer on failures = 10
          # timeout ms = 20000
          # send names instead of ids = yes
          # send charts matching = *
          send hosts matching = system. *
    health:
      enabled: true
      path: /etc/netdata/health_alarm_notify.conf
      data: |
        SEND_EMAIL="NO"
        SEND_SLACK="YES"
        SLACK_WEBHOOK_URL=""
        DEFAULT_RECIPIENT_SLACK=""
        role_recipients_slack[sysadmin]="${DEFAULT_RECIPIENT_SLACK}"
        role_recipients_slack[domainadmin]="${DEFAULT_RECIPIENT_SLACK}"
        role_recipients_slack[dba]="${DEFAULT_RECIPIENT_SLACK}"
        role_recipients_slack[webmaster]="${DEFAULT_RECIPIENT_SLACK}"
        role_recipients_slack[proxyadmin]="${DEFAULT_RECIPIENT_SLACK}"
        role_recipients_slack[sitemgr]="${DEFAULT_RECIPIENT_SLACK}"
    example:
      enabled: false
      path: /etc/netdata/health.d/example.conf
      data: |
        alarm: example_alarm1
          on: example.random
        every: 2s
        warn: $random1 > (($status >= $WARNING)  ? (70) : (80))
        crit: $random1 > (($status == $CRITICAL) ? (80) : (90))
        info: random
          to: sysadmin

slave:
  enabled: true
  resources: {}
    # limits:
    #  cpu: 4
    #  memory: 4096Mi
    # requests:
    #  cpu: 4
    #  memory: 4096Mi

  nodeSelector: {}

  tolerations:
    - operator: Exists
      effect: NoSchedule

  affinity: {}
  podLabels: {}

  podAnnotationAppArmor:
    enabled: true

  podAnnotations: {}

  configs:
    netdata:
      enabled: true
      path: /etc/netdata/netdata.conf
      data: |
        [global]
          memory mode = none
        [health]
          enabled = no
    stream:
      enabled: true
      path: /etc/netdata/stream.conf
      data: |
        [stream]
          enabled = yes
          #destination = netdata:19999:SSL
          destination = netdata:19999
          api key = 11111111-2222-3333-4444-555555555555
          #ssl skip certificate verification = yes
          timeout seconds = 60
          buffer size bytes = 1048576
          reconnect delay seconds = 5
          initial clock resync iterations = 60
    coredns:
      enabled: true
      path: /etc/netdata/go.d/coredns.conf
      data: |
        update_every: 1
        autodetection_retry: 0
        jobs:
          - url: http://127.0.0.1:9153/metrics
          - url: http://kube-dns.kube-system.svc.cluster.local:9153/metrics
    kubelet:
      enabled: true
      path: /etc/netdata/go.d/k8s_kubelet.conf
      data: |
        update_every: 1
        autodetection_retry: 0
        jobs:
          - url: http://127.0.0.1:10255/metrics
          - url: https://localhost:10250/metrics
            tls_skip_verify: yes
    kubeproxy:
      enabled: true
      path: /etc/netdata/go.d/k8s_kubeproxy.conf
      data: |
        update_every: 1
        autodetection_retry: 0
        jobs:
          - url: http://127.0.0.1:10249/metrics

  env: {}
    # To disable anonymous statistics:
    # DO_NOT_TRACK: 1
netdata version is v1.20.0
These are the logs from slaves:
2020-04-28 14:49:14: netdata INFO  : STREAM_SENDER[worker-2] : STREAM worker-2 [send to netdata:19999]: connecting...
2020-04-28 14:49:15: 204: 9345 '[172.16.0.61]:44406' 'CONNECTED'
2020-04-28 14:49:15: 204: 9345 '[172.16.0.61]:44406' 'DISCONNECTED'
2020-04-28 14:49:15: 204: 9345 '[172.16.0.61]:44406' 'DATA' (sent/all = 568/1455 bytes -61%, prep/sent/total = 0.27/0.56/0.84 ms) 200 '/api/v1/info'
2020-04-28 14:49:19: netdata ERROR : STREAM_SENDER[worker-2] : Cannot resolve host 'netdata', port '19999': Try again (errno 22, Invalid argument)
2020-04-28 14:49:19: netdata ERROR : STREAM_SENDER[worker-2] : STREAM worker-2 [send to netdata:19999]: failed to connect
2020-04-28 14:49:24: netdata INFO  : STREAM_SENDER[worker-2] : STREAM worker-2 [send to netdata:19999]: connecting...
2020-04-28 14:49:29: netdata ERROR : STREAM_SENDER[worker-2] : Cannot resolve host 'netdata', port '19999': Try again (errno 22, Invalid argument)
and from master:
2020-04-28 14:58:51: 1473: 104 '[10.244.0.0]:63652' 'DATA' (sent/all = 128/134 bytes -4%, prep/sent/total = 0.17/0.21/0.38 ms) 200 '/api/v1/alarms'
2020-04-28 14:58:51: 1596: 104 '[10.244.0.0]:60233' 'CONNECTED'
2020-04-28 14:58:51: 1596: 104 '[10.244.0.0]:60233' 'DISCONNECTED'
2020-04-28 14:58:51: netdata ERROR : WEB_SERVER[static2] : The server is configured to always use encrypt connection, please enable the SSL on slave with hostname 'master-from-snapshot'. (errno 11, Resource temporarily unavailable)
Hi @Peggy4444
Can you share exact
values.yaml? The one from OP looks a little bit wrong.all the slaves are missing from netdata and only master is remaining.
Have you checked master/slave logs?
@ilyam8 is the configuration ok in the values.yaml?
Peggy4444
on 28 Apr 2020
@thiagoftsm please check stream section for both master and slave
https://github.com/netdata/netdata/issues/8847#issuecomment-620657271
ilyam8
on 28 Apr 2020
@thiagoftsm any feedback from values.yaml? :) I just commented out some of the SSL lines. but they are un-commented in my VM
Peggy4444
on 28 Apr 2020
@thiagoftsm any feedback from values.yaml? :) I just commented out some of the SSL lines. but they are un-commented in my VM
Hi @Peggy4444 , I am testing a PR right now, so I did not have time to see the configuration, please, give me more few minutes and I will work on this issue.
I am sorry for the delay!
thiagoftsm
on 28 Apr 2020
@Peggy4444 ,
I did not see you mapping /etc/netdata/netdata.conf on master, I only saw lines for stream.conf and these options:
# [web]
          #ssl key = /etc/netdata/ssl/key/key.pem
          #ssl certificate = /etc/netdata/ssl/cert/cert.pem
          #bind to = *=dashboard|registry|badges|management|streaming|netdata.conf^SSL=force
          #bind to = *=dashboard|registry|badges|management|streaming|netdata.conf^SSL=force *:20001=dashboard|registry|badges|management|streaming|netdata.conf
are specified inside netdata.conf, because it affects the stream and the web server. The same explanation an be applied to [plugins] and backend.
On the other hand the slave looks like correct.
Please, can you map netdata.conf on the master and move the options from /etc/netdata/netdata.conf to this file.
Another important thing, you do not need to enable TLS on Netdata to work with TLS using influxDB. When you enable TLS on Netdata it affects the access to Netdata only. It is possible to work with Influx and TLS independent of Netdata configuration.
thiagoftsm
on 28 Apr 2020
@thiagoftsm Thanks!
can you please help me how to do the mapping? Im new to Helm chart and I dont know where to find the netdata.conf.
But I think that will be great solution, as I always have trouble to get the slaves back and make them stable.
Peggy4444
on 28 Apr 2020
@Peggy4444 this time I will request @ilyam8 help, because I never worked with Helm chart too.
@ilyam8 how can @Peggy4444 to map netdata.conf and move sections from stream.conf?
thiagoftsm
on 28 Apr 2020
@thiagoftsm @ilyam8
and what if I just want to work with and enable TLS using influxdb?
" It is possible to work with Influx and TLS independent of Netdata configuration."
I guess type=graphite cannot be used for enabling TLS. Then I will use opentsdb:https (port 4242).
Is it enough to add the following in the backend section?:
[backend]
enabled = yes
type = opentsdb:https
ssl skip certificate verification = yes
destination = tcp:10.104.188.xx:4242
hostname = netdata-master-0
send hosts matching = system. *
With this configuration, I dont receive any error in logs, however, metrics cannot be sent to influxdb with opentsdb type. Is there anything else I need to add to backend section?
Peggy4444
on 28 Apr 2020
You are right, using OpenTSDB as backend it is possible to use TLS. I remember that when I worked with OpenTSDB they did not have by default TLS, I had to use a bridge for this.
thiagoftsm
on 28 Apr 2020
@vlvkobal what backend we use to send data to InfluxDB?
thiagoftsm
on 28 Apr 2020
Lest do step at a time.
https://learn.netdata.cloud/docs/agent/web/server#enabling-tls-support
@Peggy4444 how did you configure tls support on the master?
#ssl key = /etc/netdata/ssl/key/key.pem
#ssl certificate = /etc/netdata/ssl/cert/cert.pem
These files ^^
ilyam8
on 28 Apr 2020
@vlvkobal
Or Using prometheus-remote-write? Although I do not know what is the the port for this backend as I cannot find it in influxdb configmap.
Peggy4444
on 28 Apr 2020
@ilyam8 Exactly following instruction here:
https://learn.netdata.cloud/docs/agent/web/server#enabling-tls-support
and modifying statefulset.yaml
so I can access the files from netdata master container (as Im working on k8s), not local /etc dir
Peggy4444
on 28 Apr 2020
i see you added everyting to the stream.conf
All these backend, plugins, etc stuff should be in the netdata.conf
https://github.com/netdata/helmchart/blob/f613b20060ed3f38798173d8e5994fd9659a0741/values.yaml#L90-L109
ilyam8
on 28 Apr 2020
@ilyam8 Right,
I changed it to netdata.conf and re-installed helmchart. But same issue.
So netdata cannot send metrics to influxdb with type=opentsdb:https, and enabling TLS
Peggy4444
on 28 Apr 2020
@Peggy4444 what are the error messages that you are receiving?
thiagoftsm
on 28 Apr 2020
@thiagoftsm no specific error message. Just the backend chart cannot be populated. and thats because influxDB only accepts secure connection, but netdata and opentsdb are not secure. Here are some strange logs:
Master:
netdata ERROR : MAIN : HEALTH [netdata-master-0]: cannot open health file: /var/lib/netdata/health/health-log.db.old (errno 2, No such file or directory)
2020-04-28 19:46:26: netdata ERROR : STATSD : LISTENER: IPv6 bind() on ip '::1' port 8125, socktype 2 failed. (errno 99, Address not available)
2020-04-28 19:46:26: netdata ERROR : STATSD : LISTENER: Cannot bind to ip '::1', port 8125
2020-04-28 19:46:26: netdata ERROR : STATSD : LISTENER: IPv6 bind() on ip '::1' port 8125, socktype 1 failed. (errno 99, Address not available)
2020-04-28 19:46:26: netdata ERROR : STATSD : LISTENER: Cannot bind to ip '::1', port 8125
2020-04-28 19:46:26: netdata INFO  : STATSD : LISTENER: Listen socket udp:127.0.0.1:8125 opened successfully.
The rest is only this log which never stops:
2020-04-28 19:58:35: 201: 101 '[10.244.3.1]:41566' 'CONNECTED'
2020-04-28 19:58:35: 201: 101 '[10.244.3.1]:41566' 'DISCONNECTED'
2020-04-28 19:58:35: 201: 101 '[10.244.3.1]:41566' 'DATA' (sent/all = 649/1697 bytes -62%, prep/sent/total = 0.54/0.44/0.98 ms) 200 '/api/v1/info'
on the slaves:
netdata ERROR : STREAM_SENDER[worker-3] : STREAM worker-3 [send to netdata:19999]: failed to connect
netdata ERROR : STREAM_SENDER[worker-3] : Cannot resolve host 'netdata', port '19999': Try again (errno 22, Invalid argument)
node.d.plugin: ERROR: Cannot read user-configuration file /etc/netdata/node.d/named.conf: ENOENT: no such file or directory, open '/etc/netdata/node.d/named.conf'.
node.d.plugin: ERROR: Cannot read stock-configuration file /usr/lib/netdata/conf.d/node.d/named.conf: ENOENT: no such file or directory, open '/usr/lib/netdata/conf.d/node.d/named.conf', using internal defaults.
netdata ERROR : PLUGIN[tc] : child pid 8691 exited with code 1.
netdata ERROR : PLUGIN[tc] : TC: tc-qos-helper.sh exited with code 1. Disabling it. (errno 22, Invalid argument)
netdata ERROR : STREAM_SENDER[worker-3] : STREAM worker-3 [send to netdata:19999]: failed to connect
netdata ERROR : STREAM_SENDER[worker-3] : Cannot resolve host 'netdata', port '19999': Try again (errno 22, Invalid argument)
@vlvkobal
So netdata cannot send metrics to influxdb with type=opentsdb:https, and enabling TLS
did you test it?
ilyam8
on 28 Apr 2020
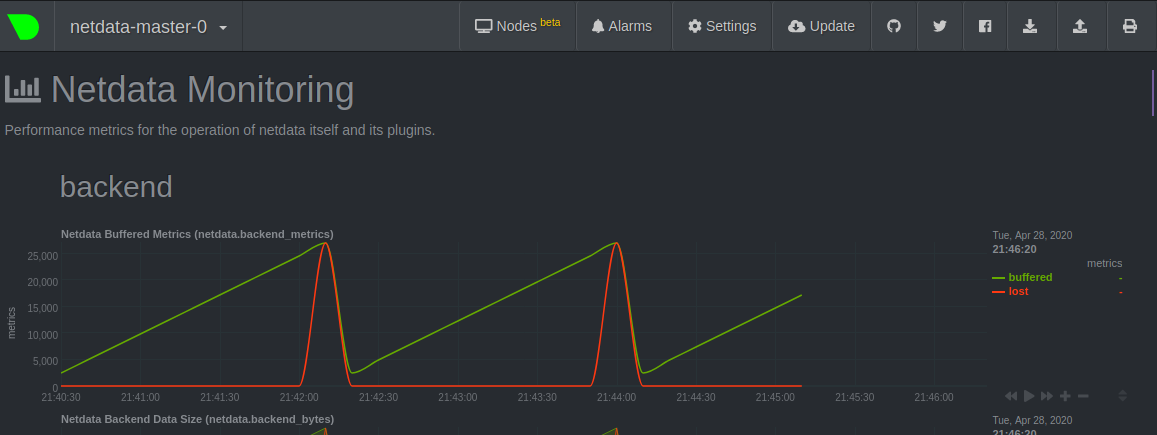
@ilyam8 testing what? I just added this backend to netdata.conf in values.yaml:
[backend]
enabled = yes
type = opentsdb:https
ssl skip certificate verification = yes
destination = tcp:10.104.188.65:4242
hostname = netdata-master-0
send hosts matching = system. *
but it cannot send metrics to influxdb as you see in the below chart:

Peggy4444
on 28 Apr 2020
i asked @vlvkobal
ilyam8
on 28 Apr 2020
i asked @vlvkobal
I see :)
Peggy4444
on 28 Apr 2020
netdata ERROR : STREAM_SENDER[worker-3] : STREAM worker-3 [send to netdata:19999]: failed to connect netdata ERROR : STREAM_SENDER[worker-3] : Cannot resolve host 'netdata', port '19999': Try again (errno 22, Invalid argument)
About this error, it is because Netdata cannot resolve netdata host, did you already try to use an IP address here?
thiagoftsm
on 29 Apr 2020
InfluxDB can use Graphite, OpenTSDB, or Prometheus remote write protocols, but only opentsdb:https supports SSL.
 vlvkobal
on 29 Apr 2020
vlvkobal
on 29 Apr 2020
you dont use IP addresses in k8s, netdata is a service name
https://github.com/netdata/helmchart/blob/master/templates/service.yaml
https://kubernetes.io/docs/concepts/services-networking/service/#service-resource
ilyam8
on 29 Apr 2020
@Peggy4444 please work out your master-slave configuration first and only after that try to configure the backend. Streaming and backends are independent parts, so don't try to do everything at once.
vlvkobal
on 29 Apr 2020
@ilyam8 @thiagoftsm Do you mean I should change the line in : https://github.com/netdata/helmchart/blob/master/values.yaml#L178
from destination = netdata:19999
to: netdata.default.svc.cluster.local:19999
?
I just applied this change. But not helpful. Master-slave has still problem.
Is there any other line I need to modify?
Peggy4444
on 29 Apr 2020
i think netdata == netdata.default.svc.cluster.local, it doesnt change anything.
Do you see netdata service?
kubectl get service netdata
What did you do to debug connectivity problems?
ilyam8
on 29 Apr 2020
@ilyam8 yes I have netdata service. name: netdata
with a clusterIP and port 19999:30789/TCP
I dont know what to do to debug connectivity problem. I can just see streaming for master-slave has problem. Is there any way to manage master-slave configuration?
Peggy4444
on 29 Apr 2020
Well, it works by default, if you install helmchart w/o modification it works. So lets start from the beginning - master/slave setup working.
Try to helm delete&&purge and install again.
ilyam8
on 29 Apr 2020
@ilyam8 thanks, good idea.
What is the exact command to delete & purge?
$ helm delete&&purge netdata Error: "helm uninstall" requires at least 1 argument
or
$ helm delete netdata --purge
Peggy4444
on 29 Apr 2020
depends on helm version, for v2 you need to add --purge flag
ilyam8
on 29 Apr 2020
@ilyam8 Im using v.3 and unfortunately there is not any flag for --purge in helm delete or helm uninstall.
But the history is kept whenever I use $ helm delete netdata
and it seems purge is the default flag in helm3? https://github.com/helm/helm/issues/5804
Im just curious the command "helm delete&&purge" is working for you without error in helm3?
Peggy4444
on 29 Apr 2020
Yes, purge is default for v3, helm delete&&purge i meant delete and purge the release, i didnt mean exact command.
ilyam8
on 29 Apr 2020
Zendesk ticket #20 has been linked to this issue.
 cakrit
on 30 Apr 2020
cakrit
on 30 Apr 2020
Comment made from Zendesk by Christopher Akritidis on 2020-05-01 at 11:19:
I know where the issue is coming from, will write on GitHub.
cakrit
on 1 May 2020
Comment made from Zendesk by Christopher Akritidis on 2020-05-01 at 12:05:
Ok, I saw the discussion in 8847 and it has to do with streaming, which is unrelated to this report. I will unlink it, so it doesn't get confusing.
The issue here is caused by an confusing link between the "alarm persistence" and the netdata instance unique identifier (MACHINE_GUID), which is not apparent in the documentation for values.yaml. `/var/lib/netdata` is used to store both the alarms log and the `registry` information (specifically netdata.registry.unique.id). So we'll need to update our helm chart, to make it much clearer. We'll possibly need to force /var/lib/netdata to always use persistent storage, but that will be discussed in an issue.
What you can do from your side as a workaround, to prevent new netdata masters from appearing is to turn the master alarms persistence flag to true and provide a storageclass that will work in your environment.
cakrit
on 1 May 2020
We have three completely different issues mentioned here and it's gotten extremely confusing:
- One had to do with the lack of persistence on the master, which caused multiple masters to keep appearing on netdata cloud (nodes view). An issue was created in netdata/helmchart to address an improvement that we need on that respect, but the workaround is to utilize a persistent storage for "alarms".
- The second issue here seems to be to get streaming working with TLS in k8s. Let's simplify this very long discussion please and just write what exactly needs to be added to our default settings for the master and the slave. We first need to get this working ourselves obviously, I'd never tested this. Note @Peggy4444 that this is quite unnecessary, because we're talking about communication within your k8s cluster (if anyone but the admin can get in there, you have much bigger problems). @ilyam8 and @thiagoftsm just do a quick test and put the required changes to our default
values.yamlhere. - The third has to do with exporting data to a secure opentsdb backend. As @vlvkobal said, let's first get the master/slave setup working.
cakrit
on 4 May 2020
Hi All @cakrit @ilyam8 @zack-shoylev @thiagoftsm @vlvkobal
Here is what we found to debug connectivity and streaming problem:
The Helm chart installs netdata with dnsPolicy: ClusterFirstWithHostNet, which causes DNS errors, making slave - master streaming haphazard (even without encrypting streaming, or influxdb backend). Setting it to ClusterFirst solves the problem, but we are afraid that we lose some of the metrics.
Peggy4444
on 5 May 2020
I prepared https://github.com/netdata/helmchart/pull/96, but we'll need to get some more info on why it was done in the first place. I didn't see any missing metrics in my test @Peggy4444, so I suggest you keep that setting for now. I assume you also saw in the k8s docs that ClusterFirstWithHostNet depends on the value HostNetwork and set that one to false or removed it as well in the daemonset.
Assuming this fixes problem number 2 for you, I suggest the discussion continues on the third point, with the exporting/backend.
cakrit
on 5 May 2020
This seems very similar to https://github.com/kubernetes/kubernetes/issues/87852 (_which I'm trying to understand myself, I came here firstly from the PR so apologies I'm a bit out-of-context here, so trying to catch up and see if there's something missed with DNS itself_).
 prologic
on 5 May 2020
prologic
on 5 May 2020
Hi All,
Here are some updates regarding the issues:
flannel - DNS problem: As disscussed in issue #96 & #87852 , we replaced flannel with calico. The streaming and connection of master-slaves are working well with calico, and enabeling HostNetwork. So there is no more problem with streaming configuration, and no more disappearing slaves.
opentsdb:https backend: does not work with self-signed certificate, is there a config setting to skip verification?
when streaming is encrypted i) the opentsdb:http backend does not work, ii) no additional ports are opened for unencrypted dashboard with this setting:
bind to = *=dashboard|registry|badges|management|streaming|netdata.conf^SSL=force *:20000=netdata.conf^SSL=optional *:20001=dashboard|registry
Peggy4444
on 11 May 2020
Hi @Peggy4444 ,
opentsdb:https backend: does not work with self-signed certificate, is there a config setting to skip verification?
@vlvkobal we have an option for this inside stream.conf, do we have for exporting.conf or netdata.conf?
when streaming is encrypted i) the opentsdb:http backend does not work, ii) no additional ports are opened for unencrypted dashboard with this setting:
This should not affect the opentsdb, because their TLS contexts are completely independent, but I will take a look. Thank you to give us this additional information.
thiagoftsm
on 11 May 2020
There are no SSL-related options for the opentsdb:https backend. You can enable/disable it. That's it.
vlvkobal
on 12 May 2020
opentsdb:https backend: does not work with self-signed certificate, is there a config setting to skip verification?
8111 - the same problem?
vlvkobal
on 12 May 2020
opentsdb:https backend: does not work with self-signed certificate, is there a config setting to skip verification?
8111 - the same problem?
It is possible to have relationship with this.
thiagoftsm
on 12 May 2020
@vlvkobal yes, but we even did not set up a reverse proxy with Nginx.
Normal opentsdb:https backend does not work with self-signed certificate
Peggy4444
on 12 May 2020
@Peggy4444 the last time that I worked with OpenTSDB it did not have enabled TLS communication, and according the resources of the current release ( http://opentsdb.net/docs/build/html/resources.html ) this is only possible using proxy.
thiagoftsm
on 12 May 2020
@thiagoftsm @vlvkobal true, but I am not using OpenTSDB. Im using influxdb with type:opentsdb:https
Do we still need reverse proxy?
Peggy4444
on 12 May 2020
For InfluxDB, it looks like they already support TLS, but our exporting is not, on the other hand, the backend is already accepting this.
We expect in the next days to have support for Influx and OpenTSDB in the next weeks merged in our exporting system.
Best regards!
thiagoftsm
on 12 May 2020
@thiagoftsm, @Peggy4444 is using backends ([backend] section in netdata.conf), so TLS should be supported in his case.
vlvkobal
on 13 May 2020
Thank you @vlvkobal .
I will work on this tomorrow.
thiagoftsm
on 14 May 2020
We have tested several backend type over calico to see the result. but opentsdb:http is not working in influxdb.
we use the latest version from all of those, no error in influxdb logs, and such errors in netdata master logs: 2020-05-14 10:41:19: netdata ERROR : BACKENDS : BACKEND: failed to write data to database backend 'influxdb:4242'. Willing to write 8021137 bytes, wrote 370132 bytes. Will re-connect.
2020-05-14 10:41:29: netdata ERROR : BACKENDS : heartbeat missed 19999752 monotonic microseconds
@thiagoftsm , @vlvkobal Is there any result of testing over backend opentsdb:http? would you please kindly share the result, and the network plugin with us?
Peggy4444
on 14 May 2020
Hi @Peggy4444 ,
I created now the PR #9068 that expects to fix the problems that you are having with this.
We apologize the delay to deliver the solution.
best regards!
thiagoftsm
on 16 May 2020
Related issues
 UltimateByte
·
68Comments
UltimateByte
·
68Comments
 ldelossa
·
107Comments
ldelossa
·
107Comments
 askd77
·
71Comments
askd77
·
71Comments
 ScrumpyJack
·
66Comments
ScrumpyJack
·
66Comments
 lukasmalkmus
·
71Comments
lukasmalkmus
·
71Comments
Most helpful comment
Comment made from Zendesk by Christopher Akritidis on 2020-05-01 at 11:19: