Netdata: Alarm "system.softnet_stat" is very strict.
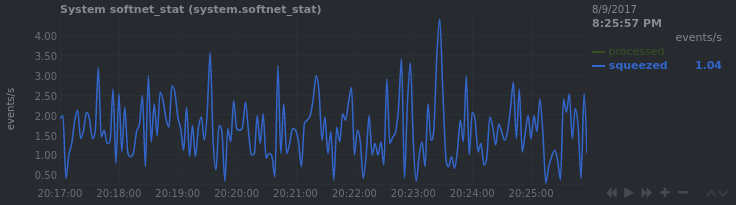
I find myself in the situation that I get the system.softnet_stat alarm most of the time. Here is a reminder what I'm talking about:

So at first I thought I might have a serious issue with my server, but after reading the Red Head guide linked on the dashboard I think the alarm is just "to strict". In the guide on page nine it says:
This value can be doubled if the 3rd column in
/proc/net/softnet_statis increasing, which indicates that the SoftIRQ did not get enough CPU time. Small increments are normal and do not require tuning.
On my two core server cat /proc/net/softnet_stat looks like this:
000008c5 00000000 00000006 00000000 00000000 00000000 00000000 00000000 00000000 00000000
0000acd2 00000000 00000006 00000000 00000000 00000000 00000000 00000000 00000000 00000000
Lets take a look at the graph:

Most of the time, the blue squeezed line is 0 and I have never seen a dropped package. Lets zoom in a bit:

Ah there it is: squeezed=0,001 :)
Maybe the alarm should only count when the squeezed value is bigger than 1.
 lukasmalkmus
All 71 comments
The value just prior to 0,001 should be 0,999. So it is one. These fractions appear when netdata calculates the rate of it (e.g 1 packet in 1,1 seconds is 0.999 on the first second and 0,001 on the second).
If you look closer at the alarm on the netdata sceenshot you posted, it says:
sum of all values of dimension squeezed, of chart system.softnet_stat, starting 1 hour ago and up to now, with options abs, unaligned.
So, it calculates the 1 hour sum. How much is it on your system?

It is 10. So making this > 1 will not help.
When I realized this check is not easy to overcome (I have such a server too), I had 2 paths:
- make it more loose to stop triggering the alarm, for example
> 5 / hour, - or keep it complaining (there is something wrong when this happens - the system is not powerful enough for the work it has), but somehow work around the alarms. So I decided to add this:

So, it is silent. It does not send any notifications. You see it, only when you have the dashboard open.
On one of my servers that had a lot of issues, including dropped packets, I had to install this as /etc/sysctl.d/99-network-tuning.conf:
# http://www.nateware.com/linux-network-tuning-for-2013.html
# Increase Linux autotuning TCP buffer limits
# Set max to 16MB for 1GE and 32M (33554432) or 54M (56623104) for 10GE
# Don't set tcp_mem itself! Let the kernel scale it based on RAM.
net.core.rmem_max = 16777216
net.core.wmem_max = 16777216
net.core.rmem_default = 16777216
net.core.wmem_default = 16777216
net.core.optmem_max = 40960

# cloudflare uses this for balancing latency and throughput
# https://blog.cloudflare.com/the-story-of-one-latency-spike/
net.ipv4.tcp_rmem = 4096 1048576 2097152

net.ipv4.tcp_wmem = 4096 65536 16777216

# Also increase the max packet backlog
net.core.netdev_max_backlog = 100000
net.core.netdev_budget = 50000

# Make room for more TIME_WAIT sockets due to more clients,
# and allow them to be reused if we run out of sockets
net.ipv4.tcp_max_syn_backlog = 30000
net.ipv4.tcp_max_tw_buckets = 2000000
net.ipv4.tcp_tw_reuse = 1
net.ipv4.tcp_fin_timeout = 10

# Disable TCP slow start on idle connections
net.ipv4.tcp_slow_start_after_idle = 0

# If your servers talk UDP, also up these limits
net.ipv4.udp_rmem_min = 8192
net.ipv4.udp_wmem_min = 8192
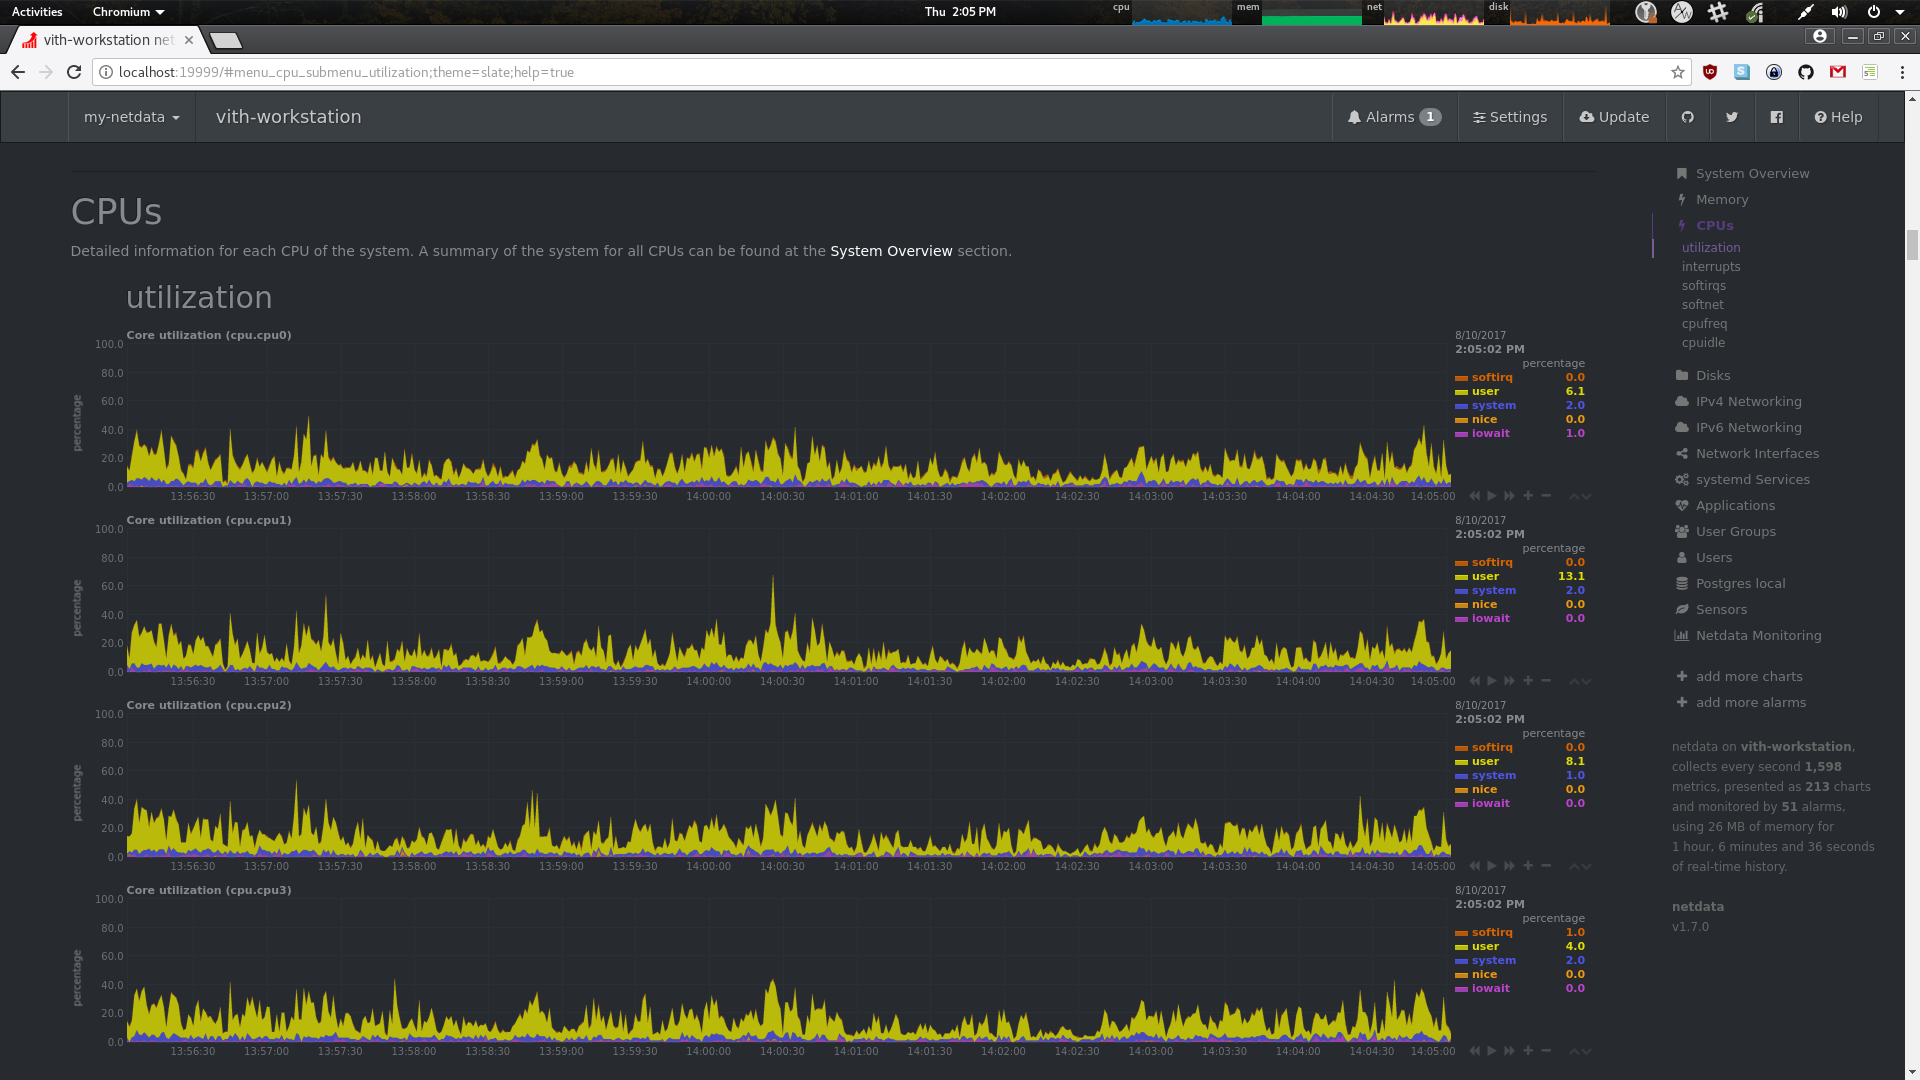
Using the above settings, I do not have dropped packets any more, and the budget issue is rare. For sure the machine that produces these alarms, is not powerful enough for what it does. I believe that if you check the softirq charts of your machine, you will see something like this on a core:

This means the core was 100% working to deliver packets, but it was not fast enough to handle them all.
Check also #984.
Of course, If you have better ideas, I am open...
 ktsaou
on 5 Oct 2016
ktsaou
on 5 Oct 2016
Thanks for clarification. I just discovered the 0,999 values, had to zoom in to detect them.
But this is still confusing: The server is a fresh installation, CPU idling most of the time (0-10%), system load is far below 0.5 all the time. There is literally no network traffic, just a very, very small amount.
I will apply some different kernel settings to tune the tcp/ip stack and see if thats helping and report back. Since this is a virtual server (KVM) and the host machine is shared by other VMs, this could be an issue.
lukasmalkmus
on 6 Oct 2016
Try the sysctl settings I gave you above. They may solve the issue.
ktsaou
on 6 Oct 2016
Did it solve it.
I am evaluating the idea of increasing the threshold, although I am not exactly sure about the value.
ktsaou
on 11 Oct 2016
No, I tried multiple settings over the last week and didn't saw any difference! I also haven't noticed any problems. I couldn't see that the softnet_stat influences any other metrics/values.
lukasmalkmus
on 11 Oct 2016
Is it 10/hour a good threshold for your case?
ktsaou
on 12 Oct 2016
I can't really tell if it is useful to introduce a threshold just because there have been two issues about it. Can you give me some more time? I will spin up a DigitalOcean droplet with the same setup and do some testing.
I'm still thinking there might be an issue because im running in a KVM environment.
lukasmalkmus
on 12 Oct 2016
ok. nice!
ktsaou
on 12 Oct 2016
I also see 1hour netdev budget ran outs warning pretty much all the time. In the last hour there were only 2 squeezed events, which did not even match the peaks in the load.

Apart from that, the server looks healthy and there is very little pressure on the resources overall.

How are your tests going @LukasMa?
 kachkaev
on 19 Oct 2016
kachkaev
on 19 Oct 2016
I couldn't really isolate the issue. It is fascinating: On a 20$ DigitalOcean VPS I have not seen one single squezzed event in the last week (6d4h to be honest)! But my "personal" server with comparable hardware hosted by a different provider is showing the 1hour netdev budget ran outs all the time. It seems to be exactly like your problem: Little pressure on resources, but still ~3 events per hour. The highest value I witnessed was 11 but that was only one time. The squezzed events don't match with load peeks, disk utilization and other monitored stats.
lukasmalkmus
on 19 Oct 2016
So, shall I set the threshold to > 10 /hour ?
ktsaou
on 19 Oct 2016
Might be worth a try 👍
But it still annoys me that I can't identify the issue. It might have something to do with my provider and his hardware/drivers (my VPS is KMV virtualized).
lukasmalkmus
on 19 Oct 2016
ok, did that.
I'll merge it later today.
ktsaou
on 23 Oct 2016
I'm getting the same errors:

Unfortunatly i have 350+ events. My server is also virtualized, maybe there are issues underlying in the way the virtualization works ?
 Thumpxr
on 13 Dec 2016
Thumpxr
on 13 Dec 2016
Have you tried increasing the budget via sysctl?
ktsaou
on 13 Dec 2016
I did as you commented here but still get alarms, although lower.

Thumpxr
on 14 Dec 2016
yes, I know. This is why they are silent alarms.
If you have raised the budget enough (e.g. 50000 or 100000) and still happens, I have concluded that it is an indication the machine is under-powered for what it does: the machine tries to dequeue an ethernet device, and hits this limit. So, it receives packets in a rate faster than it can process them.
If you have any suggestions, of course I am open to discuss them...
ktsaou
on 14 Dec 2016
@Thumpxr I only noticed this problem on a specific KVM machine and guess this problem relates to visualization. Netdata works without a problem on my RaspPi 2 and a DigitalOcean VPS. So maybe you have the same problem.
lukasmalkmus
on 14 Dec 2016
maybe there are issues underlying in the way the virtualization works ?
I have concluded that it is an indication the machine is under-powered for what it does
I'm getting this on a lightly loaded, fairly beefy non-virtualized install too.

This is a quad core Xeon E3-1225 v3 @ 3.20GHz. 6GB used out of 16GB ram. Linux kernel 4.12.4-1-ARCH (Arch Linux)
I am running an ipfs daemon, but total CPU usage only floats between 5-10%.
Network IO looks like it only gets up to around 150 kB/s per direction at most.
Tried the sysctl tuning config; no difference.
Haven't observed any actual issues using the machine; just saw the alarm and was curious.
 vith
on 10 Aug 2017
vith
on 10 Aug 2017
@vith 1000 events ever 10 mins is quite big.
Could you please post the following:
sysctl net.core.netdev_max_backlog
sysctl net.core.netdev_budget
Also, can you check the per-core interrupts if there are spikes to 100% to any of them?
ktsaou
on 10 Aug 2017
$ sysctl net.core.netdev_max_backlog
net.core.netdev_max_backlog = 100000

$ sysctl net.core.netdev_budget
net.core.netdev_budget = 50000
I am using your /etc/sysctl.d/99-network-tuning.conf from https://github.com/firehol/netdata/issues/1076#issuecomment-251797867

vith
on 10 Aug 2017
I'm on a similarly under-loaded box and getting ~300 events under "10min netdev budget ran outs". Tried using the sysctl settings @ktsaou listed, but that didn't appear to have any impact.
EDIT: I built and ran dropwatch, which may or many not be the right tool for the job, I'm not really sure. I let it capture for a few minutes and then aggregated the data by function+offset:
num_packets  function+offset
1114         nf_hook_slow+7c
419          icmpv6_rcv+311
200          netlink_broadcast_filtered+335
184          unix_stream_connect+292
128          sk_stream_kill_queues+4d
113          ip_rcv_finish+11d
112          dst_discard+9
88           __udp4_lib_rcv+ae4
69           __netif_receive_skb_core+6f6
60           ipv6_rcv+a8
59           __brk_limit+1e1ada1f
40           tcp_v4_rcv+117
40           netlink_unicast+1f6
38           __udp4_lib_rcv+b0
24           ip6_mc_input+a1
16           udp_destruct_sock+59
11           kfree_skb_list+17
11           ip_forward+103
4            __udp6_lib_rcv+72a
2            kauditd_hold_skb+74
1            tcp_v6_rcv+222
It's not clear to me which (if any) of these is responsible for the current "squeezed" statistic values.
 tycho
on 9 Sep 2017
tycho
on 9 Sep 2017
It's not clear to me which (if any) of these is responsible for the current "squeezed" statistic values.
unfortunately it is not clear for me either.
300 in 10min are quite a lot.
It is strange that the kernel runs out of budget in an under-loaded machine.
The alarm is silent, but since many of us cannot find a solution to this, it might be better to comment it out.
ktsaou
on 9 Sep 2017
I've commented it on my machine. It was being noisy and not telling me anything (I also have almost all of net.conf and udp_errors.conf commented for similar reasons)
tycho
on 9 Sep 2017
I'm still getting a large number of alarms for a high number of budget run outs.
system.softnet_stat: 10min netdev budget ran outs 101 events
number of times, during the last 10min, ksoftirq ran out of sysctl net.core.netdev_budget or time slice, with work remaining (this can be a cause for dropped packets)
I've set the associated sysctls as recommended above by @ktsaou but it didn't seem to make any difference.
$ grep netdev /etc/sysctl.d/30-network-tuning.conf
net.core.netdev_budget=50000
net.core.netdev_max_backlog = 100000
Is this a problem with my setup, or a problem with netdata, or neither?
 johnramsden
on 25 Sep 2017
johnramsden
on 25 Sep 2017
Well, it states that your softirq are running behind the work they have to do, but if you don't have dropped packets, you can ignore it.
It seems that for certain machines it is impossible to fix. This is why the alarm is silent (does not send notifications - they appear only on the dashboard).
ktsaou
on 25 Sep 2017
Hi ya, I'm running Arch Linux, I have just recently switch to the LTS kernel, not too long after I did that, the netdev_budget warning disappeared. So it might a bug with the linux kernel!
 CJ-Jackson
on 26 Dec 2017
CJ-Jackson
on 26 Dec 2017
I'm also getting this warning on a 6-core KVM VPS running centos7 and I also have dropped packets:
These are persistent warnings:
- 10min netdev budget ran outs 42 events
- inbound packets dropped ratio 0.34%
- inbound packets dropped 645 packets
This is a recurring one (around 8-10 times a day): - 1m_ipv4_tcp_listen_drops 1..3
network I/O: 0.3/6 mb/s
load average: 2.87, 2.86, 2.77
Some info:
$ ifconfig eth0
eth0: flags=4163<UP,BROADCAST,RUNNING,MULTICAST>  mtu 1500
        inet ...
        inet6 fe80::200:ff:fe37:5027  prefixlen 64  scopeid 0x20<link>
        ether 00:00:00:37:50:27  txqueuelen 1000  (Ethernet)
        RX packets 3954064816  bytes 329913485582 (307.2 GiB)
        RX errors 0  dropped 8405423  overruns 0  frame 0
        TX packets 1623052693  bytes 7571121125739 (6.8 TiB)
        TX errors 0  dropped 0 overruns 0  carrier 0  collisions 0
$ sysctl net.core.netdev_budget
net.core.netdev_budget = 50000
$ sysctl net.core.netdev_max_backlog
net.core.netdev_max_backlog = 100000
$ cat /proc/net/softnet_stat
fb86b966 00000000 000a5102 00000000 00000000 00000000 00000000 00000000 00000000 00000000
06aab97c 00000000 00001fd0 00000000 00000000 00000000 00000000 00000000 00000000 00000000
075d4f70 00000000 00001f90 00000000 00000000 00000000 00000000 00000000 00000000 00000000
06d758e5 00000000 00001d07 00000000 00000000 00000000 00000000 00000000 00000000 00000000
05c5d418 00000000 00001b68 00000000 00000000 00000000 00000000 00000000 00000000 00000000
05286c83 00000000 00001f47 00000000 00000000 00000000 00000000 00000000 00000000 00000000
$ egrep "CPU|virtio0-input" /proc/interrupts
           CPU0       CPU1       CPU2       CPU3       CPU4       CPU5
 26: 2554387546          0          0          0          0       3146   PCI-MSI-edge      virtio0-input.0
Should I ignore it?
 evpav
on 28 Dec 2017
evpav
on 28 Dec 2017
Should I ignore it?
Well,
1m_ipv4_tcp_listen_dropsis bad. You should not ignore this. This is probably due to an unresponsive server you run.inbound packets droppedis quite high, but I am not sure about the cause. I have seen this happening due to corrupted packets received, protocols not supported (ie server is IPv4 only, but it receives IPv6 packets, etc). I would suggest to investigate this a bit further.10min netdev budget ran outs, this is something you can ignore. It may or may not be related to your dropped packets. If they happen at the same time, this could be the cause of your dropped packets. If they don't happen together, I would ignore this.
ktsaou
on 3 Jan 2018
```On one of my servers that had a lot of issues, including dropped packets, I had to install this as /etc/sysctl.d/99-network-tuning.conf:
http://www.nateware.com/linux-network-tuning-for-2013.html
Increase Linux autotuning TCP buffer limits
Set max to 16MB for 1GE and 32M (33554432) or 54M (56623104) for 10GE
Don't set tcp_mem itself! Let the kernel scale it based on RAM.
net.core.rmem_max = 16777216
net.core.wmem_max = 16777216
net.core.rmem_default = 16777216
net.core.wmem_default = 16777216
net.core.optmem_max = 40960
cloudflare uses this for balancing latency and throughput
https://blog.cloudflare.com/the-story-of-one-latency-spike/
net.ipv4.tcp_rmem = 4096 1048576 2097152
net.ipv4.tcp_wmem = 4096 65536 16777216
Also increase the max packet backlog
net.core.netdev_max_backlog = 100000
net.core.netdev_budget = 50000
Make room for more TIME_WAIT sockets due to more clients,
and allow them to be reused if we run out of sockets
net.ipv4.tcp_max_syn_backlog = 30000
net.ipv4.tcp_max_tw_buckets = 2000000
net.ipv4.tcp_tw_reuse = 1
net.ipv4.tcp_fin_timeout = 10
Disable TCP slow start on idle connections
net.ipv4.tcp_slow_start_after_idle = 0
If your servers talk UDP, also up these limits
net.ipv4.udp_rmem_min = 8192
net.ipv4.udp_wmem_min = 8192
```
Can you give a brief explanation of that the above actually does? Or point me in the right direction to find out?
I am also wanting to get rid of the warning about the issue reported in this post. I have applied the above recommended settings to sysctl, but I want to ensure it's fine to do this on any environment (as opposed to something specific).
 inspiredearth
on 10 Feb 2018
inspiredearth
on 10 Feb 2018
The above are mainly buffer size changes. To achieve higher throughput and avoid buffer overruns, the networking layer buffers are increased. There should be plenty of documentation on these around the net.
Which one are you interested specifically?
ktsaou
on 11 Feb 2018
couldn't really isolate the issue. It is fascinating: On a 20$ DigitalOcean VPS I have not seen one single squezzed event in the last week (6d4h to be honest)! But my "personal" server with comparable hardware hosted by a different provider is showing the 1hour netdev budget ran outs all the time.
It seems that for certain machines it is impossible to fix. This is why the alarm is silent (does not send notifications - they appear only on the dashboard).
I'm having this issue too, after putting a medium load on test server for a while I get 10min netdev budget ran outs 2145 events while other resources like CPU aren't utilized much, changing netdev_budget doesn't seem to have any effect. One of my friends said it is possible that underlying hypervisor can't handle these packets and causes this issue. I'm not big on virtualization and networking, could it be the reason for this issue?
 ghost
on 15 Feb 2018
ghost
on 15 Feb 2018
I have the same problem (lots of squeezed events, not other real problems). I've spent lots of time reading lots of docs over the internet regarding net_dev_budget at linux network stack, until i found the source code responsible for the time_squeeze: https://github.com/torvalds/linux/blob/v4.13/net/core/dev.c#L5572
Turns out, budget isn't the only variable controlling for packet being squeezed out. There is also time frame, during which everything is supposed to be processed. By default at 4.13 Linux kernel it is 2000 us. So changing the budget after certain value does nothing, if processing takes more than 2000 us. After I've increased net.core.netdev_budget_usecs to 5000 just to test it (sudo sysctl -w net.core.netdev_budget_usecs=5000). And all of the time_squeezes has disappeared. By tweaking this value and netdev_budget, I found out that tweaking netdev_budget has 0 effect on amount of time_squeezed events (on my machine and at relatively low load), but netdev_budget_usecs needed to be at least at 4250 for time_squeezed to disappear. I'm far from being a linux expert, so I don't know if setting this value to the double of the original value might cause any problems, but it seems to work for now.
 jusio
on 23 Feb 2018
jusio
on 23 Feb 2018
nice finding @jusio ! thank you for sharing!
I'll give it a try and report back...
ktsaou
on 25 Feb 2018
hm... the netdev_budget_usecs sysctl was added in kernel 4.12 https://github.com/torvalds/linux/commit/7acf8a1e8a28b3d7407a8d8061a7d0766cfac2f4
The problematic server I have has 3.13, so can't test.
ktsaou
on 25 Feb 2018
And it seems that before 4.12 this time was hardcoded to 2 jiffies...
ktsaou
on 25 Feb 2018
In PR #3472 I updated the info text of the alarm to state that net.core.netdev_budget_usecs is related.
ktsaou
on 25 Feb 2018
I'm on a 4.13 kernel and setting the net.core.netdev_budget_usecs to 5000 was the only thing that helped.
Now I've to find out why I have 600 packets inbound drop in the last 10 min...
 ccremer
on 28 Feb 2018
ccremer
on 28 Feb 2018
I know this issue is closed, but I'd like to register that I had several warnings about packet drop in my bounding interface. I noted that they were periodically dropped(Every 30seconds, 3 packets). I used tcpdump to identify the packet and found out that my interface(3 eth bounded using mode 802.3ad) were receiving LLDP packets from the switch, and these packets were been dropped(No problem). I had to change the drop packets warning threshold, in my case, > 60, I have 3 interfaces, 3 packets each interface, every 30 seconds, 10 minutes warning, leads to 60 packets every 10 minutes.
 0x3333
on 21 Mar 2018
0x3333
on 21 Mar 2018
@ktsaou Is it possible to make alarm triggers dependent on the state of alarms defined in other files? If so, I think I might have a solution to make this (and the other softnet stuff) significantly less annoying.
 Ferroin
on 20 Jul 2018
Ferroin
on 20 Jul 2018
hm... it seems it does not. You can only get the value of other alarms, not their status.
I could implement this though. What do you have in mind?
ktsaou
on 22 Jul 2018
The primary case when this is potentially useful is indicating a possible cause for packet drops. if there are no dropped packets however, it usually ends up just being an always present annoyance because there's no easy way to reliably get it to not trigger. Given this, I was thinking it might make sense to update it so that it only triggers if the number of dropped packets is consistently high (consistently high in this case meaning not just a spike in drops due to something like a packet storm).
Ferroin
on 23 Jul 2018
Hi all,
I had about 2800 softirqs squeezed in 10min, which I gues it's a lot. Problem was solved by increasing netdev_budget_usecs to 5000, as previously mentioned.
I would like to ask if your problem is related to i40e driver behaviour, for those of you that are running physical servers.
 papage
on 5 Sep 2018
papage
on 5 Sep 2018
@papage It doesn't seem to be driver specific from what I've seen. I've observed these issues with two different Broadcom drivers, 6 different Intel ones, the (unfortunately) ubiquitous r8169 driver, and about a dozen different USB to GbE adapters.
Ferroin
on 6 Sep 2018
The primary case when this is potentially useful is indicating a possible cause for packet drops. if there are no dropped packets however, it usually ends up just being an always present annoyance because there's no easy way to reliably get it to not trigger
yes you are right. Can you open a new issue for this?
ktsaou
on 10 Sep 2018
For anyone looking for solutions, what worked for me was using the above 99-network-tuning.conf, but I changed some values, as follows:
net.ipv4.tcp_rmem = 4096 5242880 33554432
net.core.netdev_budget = 60000
net.core.netdev_budget_usecs = 6000
 billykwooten
on 20 Dec 2018
billykwooten
on 20 Dec 2018
For anybody using ansible - here is a simple update to run against your hosts
 millsy
on 11 Feb 2019
millsy
on 11 Feb 2019
did anyone solve this ?
 Hostile
on 19 Apr 2019
Hostile
on 19 Apr 2019
nope. still happens for me.
 nimbius
on 28 Jun 2019
nimbius
on 28 Jun 2019
We'll prioritize #4145, to follow @Ferroin's suggestion to take into account dropped packets, before triggering this alarm. I'll keep this open to properly tune the alarm, once the ability to do that check is implemented.
 cakrit
on 2 Jul 2019
cakrit
on 2 Jul 2019
Hi guys,
the combination of your advices helped me to solve my udp errors. My "/etc/sysctl.d/99-network-tuning.conf" looks as follows:
# http://www.nateware.com/linux-network-tuning-for-2013.html
# Increase Linux autotuning TCP buffer limits
# Set max to 16MB for 1GE and 32M (33554432) or 54M (56623104) for 10GE
# Don't set tcp_mem itself! Let the kernel scale it based on RAM.
net.core.rmem_max = 16777216
net.core.wmem_max = 16777216
net.core.rmem_default = 16777216
net.core.wmem_default = 16777216
net.core.optmem_max = 40960

# cloudflare uses this for balancing latency and throughput
# https://blog.cloudflare.com/the-story-of-one-latency-spike/
## net.ipv4.tcp_rmem = 4096 1048576 2097152
net.ipv4.tcp_rmem = 4096 5242880 33554432

net.ipv4.tcp_wmem = 4096 65536 16777216

# Also increase the max packet backlog
net.core.netdev_max_backlog = 100000
## net.core.netdev_budget = 50000
net.core.netdev_budget = 60000
net.core.netdev_budget_usecs = 6000

# Make room for more TIME_WAIT sockets due to more clients,
# and allow them to be reused if we run out of sockets
net.ipv4.tcp_max_syn_backlog = 30000
net.ipv4.tcp_max_tw_buckets = 2000000
net.ipv4.tcp_tw_reuse = 1
net.ipv4.tcp_fin_timeout = 10

# Disable TCP slow start on idle connections
net.ipv4.tcp_slow_start_after_idle = 0

# If your servers talk UDP, also up these limits
net.ipv4.udp_rmem_min = 8192
net.ipv4.udp_wmem_min = 8192
After changing the configuration I had to reboot my machine. Is there a way to get this to work without a reboot?
Regards Hoppel
 hoppel118
on 8 Jul 2019
hoppel118
on 8 Jul 2019
Is there a way to get this to work without a reboot?
sudo sysctl
       -p[FILE], --load[=FILE]
              Load  in  sysctl  settings  from  the file specified or /etc/sysctl.conf if none
              given.  Specifying - as filename means reading data from standard input.   Using
              this option will mean arguments to sysctl are files, which are read in the order
              they are specified.  The file argument may be specified as regular expression.
or
       --system
              Load settings from all system configuration files. Files are read from  directo‐
              ries  in the following list in given order from top to bottom.  Once a file of a
              given filename is loaded, any file of the same name in subsequent directories is
              ignored.
              /run/sysctl.d/*.conf
              /etc/sysctl.d/*.conf
              /usr/local/lib/sysctl.d/*.conf
              /usr/lib/sysctl.d/*.conf
              /lib/sysctl.d/*.conf
              /etc/sysctl.conf
 ilyam8
on 8 Jul 2019
ilyam8
on 8 Jul 2019
Ok, thanks. This works as expected... :)
I still have a lot of udp errors. But I think this not the right issue to discuss that. Regards
hoppel118
on 10 Jul 2019
an upgrade to the latest netdata and this sysctl resolves my issue as well. Thanks for all the help!
--
nimbius
on 10 Jul 2019
Hello,
i had the same problem and i noticed something.
10min netdev budget ran outs > 2-3k
squeezed in softnet:  20-30 Events/s highest value: 120Events/s
I experimented around and the only thing that fixed it for me was setting net.core.netdev_budget_usecs to any value over 4000.
sysctl net.core.netdev_budget_usecs=4001
This was for me a magical gamechanger.
Every net.core.netdev_budget_usecs value under 4001 resulted in squeezed Packages, every value above 4000 in 0 squeezed Packages(I tried this several hours..).
Increasing net.core.netdev_budget didn't change anything, on this behavior...
This hard cut between net.core.netdev_budget_usecs=4000 == 20-30 squeezed Events/s and net.core.netdev_budget_usecs=4001 == 0 squeezed Events/s confuses me...
(Of curse the "netdev budget ran outs" alert in netdat also removes after a while when there are 0 squeezed Events/s)
Can anybody confirm such behavior, with a magical value for net.core.netdev_budget_usecs?
Maybe also > 4000 or any other value with a hard cut from many squeezed to null squeezed?
OS: Debian GNU/Linux 10 (buster)
Kernel: 4.19.0-5-amd64 #1 SMP Debian 4.19.37-5 (2019-06-19) x86_64 GNU/Linux
 AlpixTM
on 14 Jul 2019
AlpixTM
on 14 Jul 2019
I experimented around and the only thing that fixed it for me was setting net.core.netdev_budget_usecs to any value over 4000.
sysctl net.core.netdev_budget_usecs=4001
This was for me a magical gamechanger.
By chance is your kernel timer tick 250 Hz? Because 4001us is just above 4ms, which would be the granularity of the timer tick, and would make perfect sense.
tycho
on 14 Jul 2019
Hello @tycho, no my tick is 100Hz. But this may be an explanation.
root@*** / # getconf CLK_TCK
100
I still wonder why squeezed in softnet doesn't decrease at least by a littel bit, when increasing net.core.netdev_budget_usecs to 3000 or 3500.
| netdev_budget_usecs | squeezed Packages: | real        | expectation |
|---------------------|--------------------|-------------|-------------|
|                2000 |                    | 30 Events/s | 30 Events/s |
|                3000 |                    | 30 Events/s | 20 Events/s |
|                3500 |                    | 30 Events/s | 15 Events/s |
|                4000 |                    | 30 Events/s |  5 Events/s |
|                4001 |                    |  0 Events/s |  0 Events/s |
I experimented around and the only thing that fixed it for me was setting net.core.netdev_budget_usecs to any value over 4000.
sysctl net.core.netdev_budget_usecs=4001
This was for me a magical gamechanger.
Didnt work for me. Briefly i thought it would work, but it went back to ~10 alerts
Thumpxr
on 18 Jul 2019
Okay,
so try setting it to a higher value.
6000 or something like this.
And if this works, lower it and find the value you need and please share it here.
Did you increase net.core.netdev_budget?
Because if i got this right, more packages result in more needed usecs.
Default value should be 300.
AlpixTM
on 18 Jul 2019
@AlpixTM I had the same problem on Debian testing, same kernel, until I tried your magical 4001 number for net.core.netdev_budget_usecs and that did it. 4000 is not ok, but anything above is.
My PC is using two Realtek NICs. The r8169 driver identifies one as RTL8168e/8111e and the other as RTL8168g/8111g, as seen in dmesg. I was wondering what is your NIC?
Edit: Apparently, I can reproduce this on other machines, even in a VM, when I have firewall rules. So the actual network adapter is not the issue.
 mhanor
on 18 Jul 2019
mhanor
on 18 Jul 2019
Kind of odd thread but given this is being linked to from other places it's worth pointing out one should not take the "solution" above lightly. Especially evident by the need to tweak netdev_budget* which only applies to napi anyway and isn't supported on all cards. It should not take 10ms to pop 60k/pps. Either there is a bug in your network drivers or the host is starved for resources (and misconfigured).
It is trivial for a 10G host to micro burst flood another at 1G. Cloudflare's' values are based on an _entirely_ different usecase.
 h1z1
on 7 Aug 2019
h1z1
on 7 Aug 2019
Hi @h1z1 ,
Thank you by the additional information, I also would like to give an additional information that I am working now in a PR to fix this for the next Netdata release.
Best regards!
 thiagoftsm
on 7 Aug 2019
thiagoftsm
on 7 Aug 2019
I also would like to give an additional information that I am working now in a PR to fix this for the next Netdata release.
Fix what exactly? I haven't seen any consensus on a need to increase the threshhold.
cakrit
on 12 Aug 2019
This issue is cited in the issue #4154, the main issue that I am using to create joinable alarms. When I wrote the comment was not exactly about this specific problem, but as @Ferroin said in the issue that I am working, it has direct relationship with this, so it will help solve this issue.
thiagoftsm
on 12 Aug 2019
It won't solve anything. What it will do is stop this alarm from triggering which isn't addressing the core problem. Even with support for cascading alarms _this_ issue can still surface when you have more events coming in then the host can handle. Which IS the core problem.
h1z1
on 25 Aug 2019
Can anybody confirm such behavior, with a magical value for net.core.netdev_budget_usecs?
Maybe also > 4000 or any other value with a hard cut from many squeezed to null squeezed?
Can confirm 100%
Ubuntu 18.04 in kvm using virtio networking
4.15.0-64-generic #73-Ubuntu SMP
 arnili
on 25 Sep 2019
arnili
on 25 Sep 2019
Also can confirm on Archlinux 5.3.8-arch1-1 #1 SMP PREEMPT @1572357769 x86_64 GNU/Linux, setting net.core.netdev_budget_usecs=4001 completely dropped the squeezed events (was not seeing any packet loss, machine under no noticeable load, etc).
 f0ff886f
on 5 Nov 2019
f0ff886f
on 5 Nov 2019
@tycho can be right, because HZ in Linux userspace is always 100. Can you please check your kernel configuration file for CONFIG_HZ substring? Mine show this:
$ grep "^CONFIG_HZ" /boot/config-5.0.0-37-generic
CONFIG_HZ_250=y
CONFIG_HZ=250
If HZ is indeed 250 then 4000 usecs is only 1 jiffie (4 ms), but 4001 is 2 (8 ms).
 sysoleg
on 22 Dec 2019
sysoleg
on 22 Dec 2019
Hey @oleg-umnik
CONFIG_HZ_250=y
CONFIG_HZ=250
If HZ is indeed 250 then 4000 usecs is only 1 jiffie (4 ms), but 4001 is 2 (8 ms).
Are you sure about that?
I dont know really mutch about this kernel ticks and so on, do you have a link to an explanation or something like this?
AlpixTM
on 22 Dec 2019
@AlpixTM here is the link for nice explanation http://books.gigatux.nl/mirror/kerneldevelopment/0672327201/ch10lev1sec2.html
sysoleg
on 22 Dec 2019
FWIW netdev_budget_usecs is converted to jiffies:
https://elixir.bootlin.com/linux/v5.0.21/source/net/core/dev.c#L6408
 jaffcheng
on 3 Jul 2020
jaffcheng
on 3 Jul 2020
Related issues
 startryst
·
56Comments
startryst
·
56Comments
 jeremyjpj0916
·
64Comments
thiagoftsm
·
55Comments
jeremyjpj0916
·
64Comments
thiagoftsm
·
55Comments
 Peggy4444
·
58Comments
Peggy4444
·
58Comments
 ldelossa
·
107Comments
ldelossa
·
107Comments
Most helpful comment
I have the same problem (lots of squeezed events, not other real problems). I've spent lots of time reading lots of docs over the internet regarding net_dev_budget at linux network stack, until i found the source code responsible for the time_squeeze: https://github.com/torvalds/linux/blob/v4.13/net/core/dev.c#L5572
Turns out, budget isn't the only variable controlling for packet being squeezed out. There is also time frame, during which everything is supposed to be processed. By default at 4.13 Linux kernel it is 2000 us. So changing the budget after certain value does nothing, if processing takes more than 2000 us. After I've increased
net.core.netdev_budget_usecsto 5000 just to test it (sudo sysctl -w net.core.netdev_budget_usecs=5000). And all of the time_squeezes has disappeared. By tweaking this value andnetdev_budget, I found out that tweakingnetdev_budgethas 0 effect on amount of time_squeezed events (on my machine and at relatively low load), butnetdev_budget_usecsneeded to be at least at 4250 for time_squeezed to disappear. I'm far from being a linux expert, so I don't know if setting this value to the double of the original value might cause any problems, but it seems to work for now.