Netdata: Question on netdata alarms(system.softnet_stat / ipv4.tcplistenissues) and what it likely means?
Question summary
Hey folks, sorry if this is the wrong place to ask a generic question about some of what netdata is monitoring here, if you can direct me to a better place feel free to close this and let me know where to go and I will go elsewhere. I have been running Netdata over a year on a few hosts and finally got hit with low level TCP problems at a very low TPS against an NGINX web server reverse proxying API traffic and Netdata sits sidecar to my nginx webserver.
3 alerts, one mentions could be cause of dropped packets, sure enough the ipv4 errors to follow look like dropped packets 😆 .
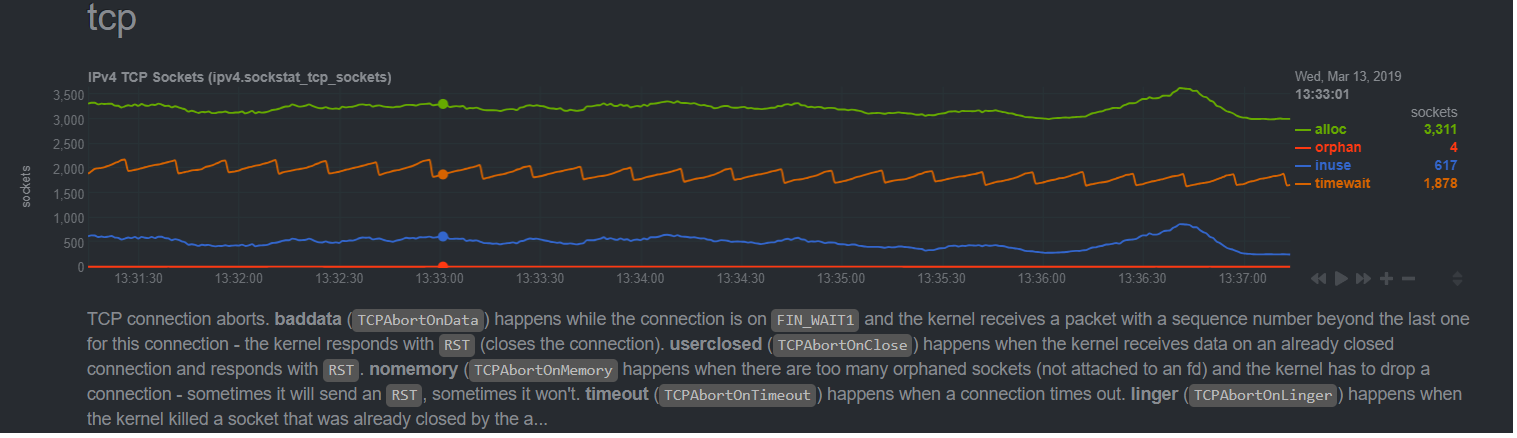
Then the tcp sockets chart I noticed was around 3-4 orphaned consistently, healthy nginx nodes in other environments sit at basically 0 with minor blips to 1 sometimes rarely.
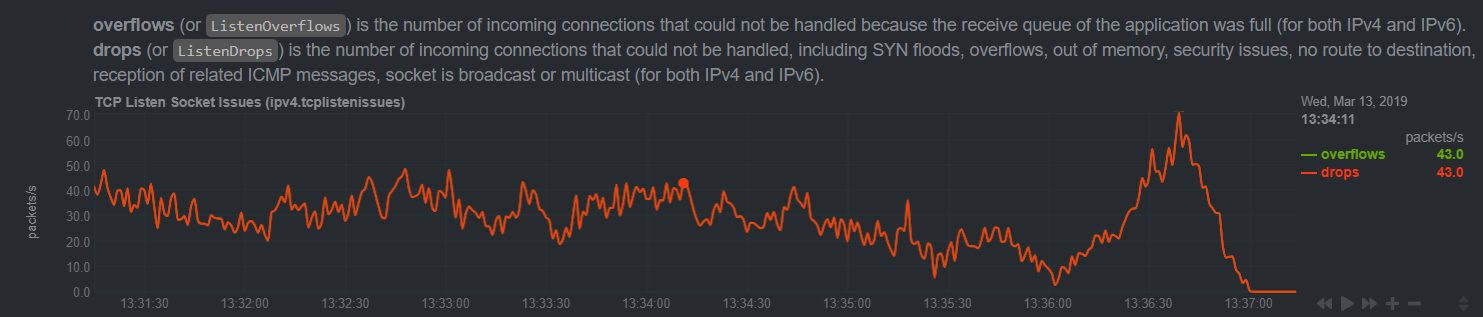
Lastly there was a chart of overflows/drops which stayed 1 to 1. Healthy nodes netdata's lack this chart being present, I assume likely because there is no such failures for netdata to capture and visualize 😄 .
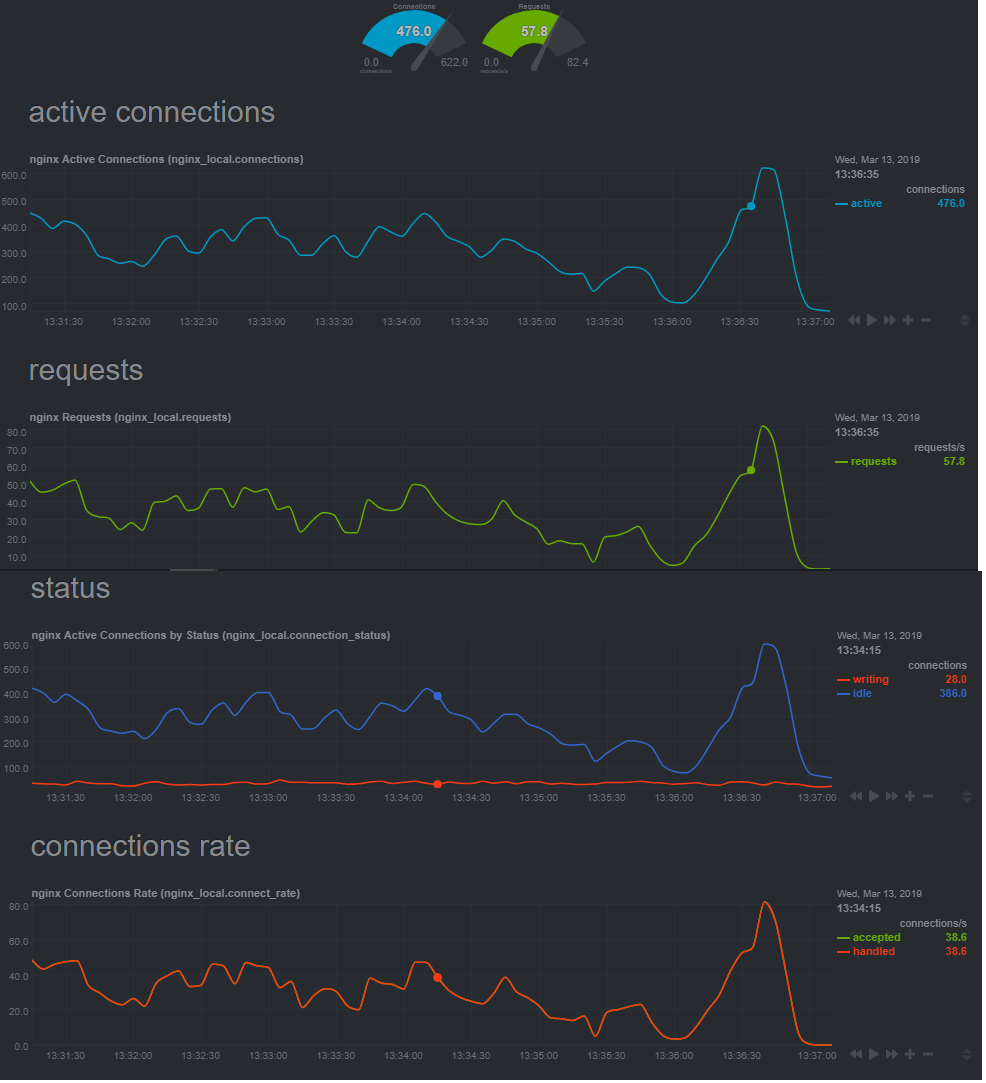
Lastly dropping in chart of nginx data, but honestly I don't think this is "nginx" problem per say, its just not enough traffic to warrant a performance webserver like nginx to have issues.

In the past I have gotten some really good feedback from all the sysadmins that maintain this awesome tooling and have high respect for you all and was curious your thoughts on these alarms/charts and what it indicates to you or how you would proceed to "dig into this" perhaps, maybe further packet captures to this host might reveal some misbehaving clients? Could it be physical hardware related? I have been running like I said for over a year and this kinda traffic volume is typical and very little, we have load tested to thousands of tps without issue in the past and for the error to pop up and people report impact on calls failing to us is a bit disturbing to say the least. To add to the mystery we run in 2 datacenters and our node in the other datacenter was fine at this time of day handling similar volume load balanced(check netdata on it too, no alerts and no problems). You can bet we are adding email alerts not when these show up in the future so we will be notified when low level tcp failures like this present itself again and Netdata captures them!
Thanks,
Jeremy
 jeremyjpj0916
All 3 comments
@Ferroin :smile:
 ilyam8
on 14 Mar 2019
ilyam8
on 14 Mar 2019
Analysis
TLDR
Based on the given info, I would suspect one of the following is the case (ordered based on how likely I think it is):
- You've got some serious networking issues between you and your clients. Either packets are getting duplicated somewhere, or there's a severe packet loss problem for only certain types of TCP packets causing connections to not be started or closed properly.
- Somebody is doing a somewhat poor job of trying to DoS your system.
- You're getting way more traffic than your system is able to reliably handle, but it's not an actual DoS attempt.
- You have bad RAM or a bad PSU.
- You have a bad CPU or mainboard.
- You have bad networking hardware.
- You have at-rest data corruption on your persistent storage devices (which may or may not themselves be going bad).
system.softnet_stat
This particular metric actually means very little unless it can be directly correlated with other events. Most of the time, the associated alarms triggering just mean that you're getting more traffic than th kernel thinks you should be able to handle (in the software sense, not the hardware sense), not that you have any actual network issues. It also can be pretty reliably triggered on many systems by simply using a large percentage of the network bandwidth, which is what I suspect is the case here given the other data.
TCP Listen Socket Overflows
Every listening TCP socket (actually, every listening socket that uses a connection oriented protocol) on Linux has a dedicated buffer associated with it which is used to queue connection attempts. This metric tracks the number of times that that buffer has overflowed for any socket on the system in the most recent collection period. The two most likely reasons for one of these buffers to overflow are the system reviving a high volume of legitimate new connections or somebody trying to run a DoS attack against the system.
TCP Listen Drops
This tracks new TCP connections that were dropped for _any_ reason. It includes listen socket overflows, as well as many other things, so it will always be at least equal to the number of TCP listen socket overflows. While some of the causes for dropped TCP connections can be hardware issues, your usage appears to be exactly tracking overflows, so it's likely just high as a side effect of having lots of listen socket overflows.
Orphaned Sockets
TCP unfortunately has a huge amount of overhead in connection setup and tear-down. The setup stage, obviously, has to be synchronous from the perspective of the application creating the connection, but the tear-down does not, and most applications let the kernel handle it almost completely asynchronously. Orphaned sockets are ones which are in this in-between state, the application has closed them, but the kernel needs to keep them allocated for protocol reasons (usually because the other end hasn't completely acknowledged that the connection is closed). Consistent non-zero values here indicate either packet loss issues on the network, or actively misbehaving clients.
Further Investigation
To start with, take a look at the network traffic for this system and see if it at least looks legitimate. I'd suggest using a tool like Wireshark for actually looking at the packet dump, as it makes it very easy to find things like duplicate or malformed packets. Provided that nothing looks unusual there (you might want to compare to a similar dump from one of your other known-working systems), you can probably rule out the first two cases.
If, beyond that, you can realistically rule out an unexpected increase in traffic volume that isn't a DoS attack or external networking issue, then it _might_ be a hardware problem, but that's the last thing I would suspect (and therefore the last thing I would investigate unless you have some trivial way to verify hardware).
 Ferroin
on 14 Mar 2019
Ferroin
on 14 Mar 2019
@Ferroin I really appreciate the detail you just gave. Will give it a read over. Again thanks a ton.
jeremyjpj0916
on 14 Mar 2019
Related issues
 Ryuzavi
·
3Comments
Ryuzavi
·
3Comments
 jordanhubbard
·
3Comments
jordanhubbard
·
3Comments
 ktsaou
·
3Comments
ktsaou
·
3Comments
 gino
·
3Comments
gino
·
3Comments
 GitStoph
·
3Comments
GitStoph
·
3Comments
Most helpful comment
Analysis
TLDR
Based on the given info, I would suspect one of the following is the case (ordered based on how likely I think it is):
system.softnet_stat
This particular metric actually means very little unless it can be directly correlated with other events. Most of the time, the associated alarms triggering just mean that you're getting more traffic than th kernel thinks you should be able to handle (in the software sense, not the hardware sense), not that you have any actual network issues. It also can be pretty reliably triggered on many systems by simply using a large percentage of the network bandwidth, which is what I suspect is the case here given the other data.
TCP Listen Socket Overflows
Every listening TCP socket (actually, every listening socket that uses a connection oriented protocol) on Linux has a dedicated buffer associated with it which is used to queue connection attempts. This metric tracks the number of times that that buffer has overflowed for any socket on the system in the most recent collection period. The two most likely reasons for one of these buffers to overflow are the system reviving a high volume of legitimate new connections or somebody trying to run a DoS attack against the system.
TCP Listen Drops
This tracks new TCP connections that were dropped for _any_ reason. It includes listen socket overflows, as well as many other things, so it will always be at least equal to the number of TCP listen socket overflows. While some of the causes for dropped TCP connections can be hardware issues, your usage appears to be exactly tracking overflows, so it's likely just high as a side effect of having lots of listen socket overflows.
Orphaned Sockets
TCP unfortunately has a huge amount of overhead in connection setup and tear-down. The setup stage, obviously, has to be synchronous from the perspective of the application creating the connection, but the tear-down does not, and most applications let the kernel handle it almost completely asynchronously. Orphaned sockets are ones which are in this in-between state, the application has closed them, but the kernel needs to keep them allocated for protocol reasons (usually because the other end hasn't completely acknowledged that the connection is closed). Consistent non-zero values here indicate either packet loss issues on the network, or actively misbehaving clients.
Further Investigation
To start with, take a look at the network traffic for this system and see if it at least looks legitimate. I'd suggest using a tool like Wireshark for actually looking at the packet dump, as it makes it very easy to find things like duplicate or malformed packets. Provided that nothing looks unusual there (you might want to compare to a similar dump from one of your other known-working systems), you can probably rule out the first two cases.
If, beyond that, you can realistically rule out an unexpected increase in traffic volume that isn't a DoS attack or external networking issue, then it _might_ be a hardware problem, but that's the last thing I would suspect (and therefore the last thing I would investigate unless you have some trivial way to verify hardware).