Netdata: Add SCSI device support to smartd_log.chart.py
man smartd says:
[For ATA devices] "At each check cycle attributes are logged as a line of semicolon separated triplets of the form "attribute-ID;attribute-norm-value;attribute-raw-value;".
For SCSI devices error counters and temperature [are] recorded in the form "counter-name;counter-value;"
The plugin relies on the attribute-ID, but the smartd log files are only populated with attribute-ID for ATA devices (weirdly)
Would it be possible to add support for SCSI disk smartd log files into smartd_log.chart.py?
 ScrumpyJack
All 66 comments
Hi @ScrumpyJack
For SCSI devices error counters and temperature [are] recorded in the form "counter-name;counter-value;"
please post here some lines from SCSI smartd log file
 ilyam8
on 26 Sep 2018
ilyam8
on 26 Sep 2018
uploaded the csv output for a scsi drive here
ScrumpyJack
on 26 Sep 2018
Do all those counters have corresponding names/ids?
Which counters should we chart?
ilyam8
on 26 Sep 2018
@Ferroin any ideas?
ilyam8
on 26 Sep 2018
From a cursory look at the attributes listed, it seems to me that we should be tracking the following by default:
temperature*-total-unc-errors: Appears to count uncorrected errors, which should be reported.*-total-err-corrected: Appears to count corrected errors, which should be reported.
The issue here is that the only one which maps directly to an ATA SMART attribute is temperature. There's not any ID because SCSI sends the names directly as part of the protocol, instead of ATA, which sends the ID but not the name (and you have to map the ID to the name in software). The reported values are functionally raw values, but they're in natural units for the counter type (degrees celsius for the temperature, individual errors for the error counters, etc).
 Ferroin
on 26 Sep 2018
Ferroin
on 26 Sep 2018
@ScrumpyJack
what do you think?
ilyam8
on 27 Sep 2018
Looks good.
To get predictive failures, something clever could be done with the ratio
*-gb-processed/*-corr-algorithm-invocations
or other such crunching, but knowing what and when that ratio is significant is another story.
ScrumpyJack
on 27 Sep 2018
Hm, i don't know how to organize dashboard menu..
current version:
do not distinguish between ata and scsi and just add suggested attributes as menu items?
'read-total-err-corrected',
'read-total-unc-errors',
'write-total-err-corrected',
'write-total-unc-errors',
'verify-total-err-corrected',
'verify-total-unc-errors'
I think:
- power (having
start/stop,power on hours,power cycle count) - errors (having
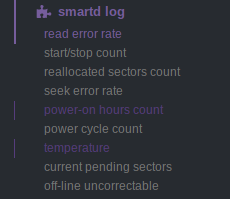
read error rate,reallocated sector count,seek error rate,current pending sectors,offline uncorrectable) - temperature
I don't have visibility of the charts, so keep in mind you can group XXX sectors, XXX error rate, XXX count of the same family to a single chart. But don't mix incremental and absolute values (prometheus does not like that)
 ktsaou
on 29 Sep 2018
ktsaou
on 29 Sep 2018
I don't have visibility of the charts,
Every attribute is a family which has two charts. One with normalized values, one with raw values. Dimensions - disks (super long names, like KINGSTON_SHFS37A120G-50026B7266003D93)
ilyam8
on 29 Sep 2018
Every attribute is a family which has two charts
hm... this is a problem I think.
Let me try to group them
ktsaou
on 29 Sep 2018
Definitely a problem. User want to monitor specific attribute, so attribute as a family is nice (easy to choose from dashobard menu). After grouping user will have to look through the titles to find attr in which he interested in.
ilyam8
on 29 Sep 2018
@ScrumpyJack as a plugin user what do you think?
ilyam8
on 29 Sep 2018
I think it is more complicated than that.
Let's see an example:
ID| Name | units | type | family | alarm | description
:---:|:-------------------------------------:|:-------------:|:----:|:-----------:|:---------------|:-----------
1 | Read Error Rate | normalized value | abs normalized | errors | | (Vendor specific raw value.) Stores data related to the rate of hardware read errors that occurred when reading data from a disk surface. The raw value has different structure for different vendors and is often not meaningful as a decimal number.
2 | Throughput Performance | value | abs raw | performance | on decrease | Overall (general) throughput performance of a hard disk drive. If the value of this attribute is decreasing there is a high probability that there is a problem with the disk.
3 | Spin-Up Time | ms | abs raw | spin | | Average time of spindle spin up (from zero RPM to fully operational [milliseconds]).
4 | Start/Stop Count | events | abs raw | power | | A tally of spindle start/stop cycles. The spindle turns on, and hence the count is increased, both when the hard disk is turned on after having before been turned entirely off (disconnected from power source) and when the hard disk returns from having previously been put to sleep mode.
5 | Reallocated Sectors Count | sectors | inc raw | wear | sum(-1m) > 0 | Count of reallocated sectors. The raw value represents a count of the bad sectors that have been found and remapped.[25] Thus, the higher the attribute value, the more sectors the drive has had to reallocate. This value is primarily used as a metric of the life expectancy of the drive; a drive which has had any reallocations at all is significantly more likely to fail in the immediate months. Tracks reallocated erase blocks instead on most SSD's.
6 | Read Channel Margin | - | - | - | | Margin of a channel while reading data. The function of this attribute is not specified.
7 | Seek Error Rate | normalized value | abs normalized | errors | | (Vendor specific raw value.) Rate of seek errors of the magnetic heads. If there is a partial failure in the mechanical positioning system, then seek errors will arise. Such a failure may be due to numerous factors, such as damage to a servo, or thermal widening of the hard disk. The raw value has different structure for different vendors and is often not meaningful as a decimal number. The normalized value has a consistent usage among vendors (decreases from 100 as the error rate goes up).
8 | Seek Time Performance | value | abs raw | performance | on decrease | Average performance of seek operations of the magnetic heads. If this attribute is decreasing, it is a sign of problems in the mechanical subsystem.
9 | Power-On Hours Count | hours | abs raw | power | - | Count of hours in power-on state. The raw value of this attribute shows total count of hours (or minutes, or seconds, depending on manufacturer) in power-on state.
10 | Spin-up Retries | retries | inc raw | spin | value > 0 | Count of retry of spin start attempts. This attribute stores a total count of the spin start attempts to reach the fully operational speed (under the condition that the first attempt was unsuccessful). An increase of this attribute value is a sign of problems in the hard disk mechanical subsystem.
11 | Calibration Retries | retries | inc raw | spin | sum(-1m) > 0 | This attribute indicates the count that recalibration was requested (under the condition that the first attempt was unsuccessful). An increase of this attribute value is a sign of problems in the hard disk mechanical subsystem.
12 | Power Cycle Count | events | abs raw | power | | This attribute indicates the count of full hard disk power on/off cycles.
13 | Soft Read Error Rate | errors | inc raw | errors | sum(-1m) > 0 | Uncorrected read errors reported to the operating system
100 | Erase/Program Cycles | count | abs raw | - | | Primarily an SSD attribute, used inconsistently among vendors. Some track this based on erase blocks, others track it only for the total size of the drive. Some only account TRIM commands, others account anything that causes an erase/rewrite cycle.
103 | Translation Table Rebuild | - | - | - | |
108 | Unknown (108) | - | - | - | |
170 | Reserved Block Count | % | abs raw | wear | > 90 | Number of physical erase cycles completed on the SSD as a percentage of the maximum physical erase cycles the drive is designed to endure. Intel SSDs report the available reserved space as a percentage of the initial reserved space.
171 | Program Fail Count | errors | inc raw | wear | sum(-1m) > 0 | The total number of flash program operation failures since the drive was deployed.[33] Identical to attribute 181.
172 | Erase Fail Count | failures | inc raw | wear | sum(-1m) > 0 |Counts the number of flash erase failures. This attribute returns the total number of Flash erase operation failures since the drive was deployed. This attribute is identical to attribute 182.
173 | Wear Leveller Worst Case Erase Count | erases | abs raw | wear | | Counts the maximum worst erase count on any block. Used instead by some devices to indicate the average number of times a block has been erased.
174 | Unexpected Power Loss | events | abs raw | power | | Also known as "Power-off Retract Count" per conventional HDD terminology. Raw value reports the number of unclean shutdowns, cumulative over the life of an SSD, where an "unclean shutdown" is the removal of power without STANDBY IMMEDIATE as the last command (regardless of PLI activity using capacitor power). Normalized value is always 100.
175 | Power Loss Protection Failure | - | - | - | | Last test result as microseconds to discharge cap, saturated at its maximum value. Also logs minutes since last test and lifetime number of tests. Raw value contains the following data: Bytes 0-1: Last test result as microseconds to discharge cap, saturates at max value. Test result expected in range 25 <= result <= 5000000, lower indicates specific error code. Bytes 2-3: Minutes since last test, saturates at max value. Bytes 4-5: Lifetime number of tests, not incremented on power cycle, saturates at max value. Normalized value is set to one on test failure or 11 if the capacitor has been tested in an excessive temperature condition, otherwise 100.
176 | Erase Fail Count | failures | inc raw | wear | sum(-1m) > 0 | S.M.A.R.T. parameter indicates a number of flash erase command failures.
180 | Unused Reserved NAND Blocks | blocks | abs raw | wear | value < ? | Tracks the number of spare erase blocks that can be used for wear leveling to replace failed erase blocks. Values approaching zero indicate lower remaining life expectancy for the drive.
183 | SATA Interface Downshift | events | inc raw | external failure | - | Indicates the number of times over the life of the drive that the SATA interface has been reconfigured to operate at lower than the drive's max speed. This can occur due to bad cabling or a bad SATA controller, but also can simply indicate that the drive is connected to a slower SATA controller than the fastest it can support.
190 | Airflow Temperature Celsius | degrees celsius | abs raw | temperature | - | Measures the temperature of the airflow in the drive, raw value is in degrees Celsius. Depending on drive construction, this may or may not be the same as 194 (Temperature Celsius).
194 | Temperature Celsius | degrees celsius | abs raw | temperature | - | Measures the temperature of the drive, equivalent to the SCSI temperature attribute. For SSD's this is typically either an aggregate measurement of the temperature of all the Flash chips and the controller, or a simple measurement near the center of the board. For HDD's, it's usually either a measurement of the internal airflow temperature, or a measurement of the temperature of the drive heads.
196 | Reallocation Event Count | events | inc raw | wear | sum(-1m) > 0 | Tracks the total number of times over the lifetime of the drive that the firmware has reallocated a sector (for HDD's) or a flash erase block (for SSD's). Many HDD's seem to not have this attribute.
197 | Current Pending Sector Count | sectors | abs raw | wear | sum(-1m) > 0 | Tracks the number of sectors (or flash erase blocks on SSD's) pending for a rewrite by the drive firmware. Raw value is always an exact count of pending sectors. Together with attribute 198, this is a reliable indicator of media wear. This value will go up when a bad sector/erase block is found, and then down again when it gets reallocated.
198 | Offline Uncorrectable Sector Count | sectors | abs raw | wear | ? | Tracks the number of sectors (or flash erase blocks on SSD's) with media errors that could not be corrected by the drive firmware. The raw value is an exact count of failed sectors. Together with attribute 197, this is a reliable indicator of media wear. This is an absolute value and needs to be reported as such, but any alarms based on it should report changes in the value, not use a fixed threshold. A lot of consumer NAS devices will kick disks with a non-zero value here out of a RAID array, but the disks are usually still good for quite some time afterwards despite this.
199 | UDMA CRC Error Count | errors | inc raw | external failure | ? | Tracks the total number of UDMA CRC errors the drive has encountered. The raw value is an absolute count, but charts should track a rate and the the alarms should trigger based on the rate. I'm not sure what a good alarm would be for this, as I'm still not quite certain about the significance (I think it's indicative of hardware or software issues outside of the drive, but I'm not sure).
202 | Percent Lifetime Used | % | abs normalized | wear | value < 5 | This is an aggregate estimate of how much of the expected life of the disk has been used. Only widely seen on SSD's. The normalized value (not the raw one) is the percentage remaining life expectancy for the SSD, while the raw value is the actual percentage used. This almost always changes very slowly and is only an integer, so tracking rate of change on the scale Netdata operates at is useless. Most drives are set to fail SMART health checks when the normalized value hits 1%, 5% makes sense as a reasonable warning point for an alarm. The graph for this should document that the displayed value is the _opposite_ of the attribute name (that is, percent remaining lifetime).
206 | Write Error Rate | normalized value | abs normalized | errors | | Equivalent to attribute 1 (Read Error Rate), just for writes instead of reads. The same issues with tracking attribute 1 apply here.
So, I believe a few values need to be absolute, others need to be incremental and many have to completely ignored.
Then to group them, we have to understand what they mean.
Keep in mind many have different labels compared to https://en.wikipedia.org/wiki/S.M.A.R.T.
I you want to do this right and be super useful for all people, I could try to finish this grouping. The above table has to be filled with all attributes and then another pass in needed to understand each family and assign chart names and metric names in each chart.
ktsaou
on 29 Sep 2018
Definitely a problem. User want to monitor specific attribute, so attribute as a family is nice (easy to choose from dashobard menu). After grouping user will have to look through the titles to find attr in which he interested in
I am not sure of this use case. Who wants to check a specific SMART attribute? I don't even know the available SMART attributes. Normally, I want netdata to know them and let me know when something is wrong or indicates an issue.
ktsaou
on 29 Sep 2018
Incremental? I am not optimistic about raw values, because of
but higher raw attribute values may be better or worse depending on the attribute and manufacturer
As manufacturers do not necessarily agree on precise attribute definitions and measurement units
Some codes are specific to particular drive types (magnetic platter, flash, SSD)
Drives may use different codes for the same parameter
Manufacturers that have implemented at least one S.M.A.R.T. attribute in various products include...
ilyam8
on 30 Sep 2018
Yes, this is why I have used incremental in XXX count and XXX retries attributes.
ktsaou
on 30 Sep 2018
If you give me a few days, I can put together a list of what I know of for certain on the ATA side (what needs to be absolute, what needs to be incremental, what each one means) based on the devices I have immediate access to (an assortment of traditional LMR HDD's and some TLC NAND SSD's). There are however a few odd cases of attributes that pretty much have to be raw because they can't be reported sanely otherwise. Temperatures fit this (and luckily almost all modern drives report them in degrees celsius, though there are some older models form US companies that report in Fahrenheit and I've seen a few odd ones that reported in Kelvins).
Ferroin
on 1 Oct 2018
@ScrumpyJack as a plugin user what do you think?
What do I think? I think this is the reason why this project is so successful.
ScrumpyJack
on 1 Oct 2018
OK, regarding data I've found so far:
- Attribute 5 (Reallocated Sector Count) has a slightly different meaning for SSD's. On HDD's, it tracks the number of physical sectors reallocated by the drive's firmware. On SSD's, it tracks flash storage erase blocks, which are usually much bigger (2-8MB is typical).
- Attribute 7 (Seek Error Rate) has mostly useless raw values. However, the cooked value is useful as almost all vendors use it correctly. Pretty much, if the cooked value is less than 100, there is a non-zero number of seek errors, which is usually indicative of significant mechanical wear on the drive.
- Attribute 9 (Power-on Hours Count) is not actually all that useful in many cases as a generic indicator of drive life expectancy because we can't tell for certain what the actual drive life expectancy is. Given this, i don't think having an alarm for it is a good idea, though exposing it in a chart is still worthwhile.
- Attribute 10 (Spinup Retries) is cumulative over the life of the drive. For a healthy drive it should _never_ be above zero, at all. Any non-zero value here is indicative of either an imminent mechanical failure, a past mechanical failure, or poor operational conditions that are likely to induce a mechanical failure. However, if the system keeps it's disks spinning all the time (which is not unusual), the proposed alarm will likely never trigger, because the attribute will only change on system startup before Netdata starts.
Other attributes of potential interest include:
- 190 (Airflow Temperature Celsius): Measures the temperature of the airflow in the drive, raw value is in degrees Celsius. Depending on drive construction, this may or may not be the same as 194 (Temperature Celsius). Absolute, alarms make sense, but are too context dependent to ship defaults.
- 194 (Temperature Celsius) Measures the temperature of the drive, equivalent to the SCSI
temperatureattribute. For SSD's this is typically either an aggregate measurement of the temperature of all the Flash chips and the controller, or a simple measurement near the center of the board. For HDD's, it's usually either a measurement of the internal airflow temperature, or a measurement of the temperature of the drive heads. Absolute raw value in degrees Celsius, alarms make sense, but are too context dependent to ship defaults. - 196 (Reallocation Event Count): Tracks the total number of times over the lifetime of the drive that the firmware has reallocated a sector (for HDD's) or a flash erase block (for SSD's). The raw value is an absolute indication of the total number of events over the lifetime of the drive, so we should track the rate of change and raise an alarm if it's non-zero. Many HDD's do not seem to have this attribute.
- 197 (Current Pending Sector Count): Tracks the number of sectors (or flash erase blocks on SSD's) pending for a rewrite by the drive firmware. Raw value is always an exact count of pending sectors. Together with attribute 198, this is a reliable indicator of media wear. This is an absolute value, and should ideally trip an alarm if it's ever non-zero, as that indicates that a media error has been found by the drive.
- 198 (Offline Uncorrectable Sector Count): Tracks the number of sectors (or flash erase blocks on SSD's) with media errors that could not be corrected by the drive firmware. The raw value is an exact count of failed sectors. Together with attribute 197, this is a reliable indicator of media wear. This is an absolute value and needs to be reported as such, but any alarms based on it should report _changes_ in the value, not use a fixed threshold. A lot of consumer NAS devices will kick disks with a non-zero value here out of a RAID array, but the disks are usually still good for quite some time afterwards despite this.
- 199 (UDMA CRC Error Count): Tracks the total number of UDMA CRC errors the drive has encountered. The raw value is an absolute count, but charts should track a rate and the the alarms should trigger based on the rate. I'm not sure what a good alarm would be for this, as I'm still not quite certain about the significance (I think it's indicative of hardware or software issues outside of the drive, but I'm not sure).
- 202 (Percent Lifetime Used): This is an aggregate estimate of how much of the expected life of the disk has been used. Only widely seen on SSD's. The cooked value (not the raw one) is the percentage _remaining_ life expectancy for the SSD. This almost always changes very slowly and is only an integer, so tracking rate of change on the scale Netdata operates at is useless. Most drives are set to fail SMART health checks when this hits 1%, 5% makes sense as a reasonable warning point for an alarm.
I'll hopefully have some more info tomorrow.
Ferroin
on 1 Oct 2018
This is awesome research. I don't want to seem impatient, are we any closer to getting them graphed?
ScrumpyJack
on 9 Oct 2018
@ScrumpyJack Unfortunately I don't think so.
@ktsaou I've not been able to find anything further except stuff that matches up with what you posted, so I think for the moment we probably have sufficient information to work with.
Ferroin
on 9 Oct 2018
@Ferroin please update table with the info you have found (i see Other attributes of potential interest include)
And i think we need attr type column (raw/normalized)
ilyam8
on 10 Oct 2018
Updated, including adding a couple other attributes I've largely confirmed are consistent. I know of over a dozen more that aren't on the table, but they're so heavily vendor dependent as to whether they appear or not that I don't think we should track them.
Also, I just added the raw/normalized info to the type column, that seems to make the most sense.
Ferroin
on 10 Oct 2018
@Ferroin
i see 194 Temperature Celsius abs raw. But raw value makes no sense (ex.: 194;34;34359738402). Same for 190.
ilyam8
on 10 Oct 2018
@l2isbad There's some extra parsing involved regardless of whether you use the normalized value or the raw value, but you can get extra data out of the raw value, hence my suggestion to use the raw value. I just forgot to mention this in the notes.
More specifically, for both 190 and 194:
- For the normalized value reported value is 100 minus the actual temperature.
- For the raw value it's not directly readable as any value, but it can be parsed to get a minimum and maximum temperature for the drive over some vendor defined time period, plus the current temperature and possibly (on some Western Digital drives) a count of how many times the device has gone over the designed temperature range. Info on the exact parsing can be found in the
ata_format_attr_raw_value()function inatacmds.cppin the smartmontools sources. In short, there are five known formats:
- The low byte is the current temperature, the third lowest is the minimum, and the fifth lowest is the maximum, with the other three bytes being either
\x00or\xff. Known to be used by Hitachi and HGST drives. - The low byte is the current temperature, the third lowest is the maximum, and the fifth lowest is the minimum, with the other three bytes being either
\x00or\xff. Known to be used by Kingston SSD's, and I believe also by SanDisk and Crucial SSD's. - The low byte is the current temperature, the third lowest is the minimum, and the fourth lowest is the maximum. The second lowest byte is either
\x00or\xff, and the high two bytes are\x00. Known to be used by Maxtor, Samsung, Seagate, and Toshiba drives. - The low byte is the current temperature, the second lowest is the minimum, and the third lowest is the maximum, with the three highest bytes being
\x00. Known to be used by some (mostly older) Western Digital drives. - The low byte is the current temperature, the third lowest is the minimum, and the fourth lowest is the maximum. The second lowest is
\x00or\xff, and the high two bytes are an unsigned 16-bit integer indicating how many times the drive has been above the rated operating temperature.
- The low byte is the current temperature, the third lowest is the minimum, and the fifth lowest is the maximum, with the other three bytes being either
Ferroin
on 10 Oct 2018
How close are we to having this in a release?
ScrumpyJack
on 25 Oct 2018
It seems we need to rewrite the whole module.
For the ATA i have this
Families:
- performance
- spin
- wear
- power
- errors
- temperature
It's not clear to me how to handle SCSI devices.
Additional families at the end of the list? prepend scsi to family, like
- scsi errors // (read, write, verify)
- scsi temperature
ilyam8
on 25 Oct 2018
@l2isbad IMO, it makes more sense to just group the SCSI attributes into the same categories they would be in if it were an ATA device. We treat SCSI devices the same as ATA devices everywhere else, so it seem odd to me to differentiate here given that the attributes can be trivially grouped into the existing families.
Also, for now, I do think just tracking temperature and read/write/verify errors for SCSI devices is probably fine. There are some other attributes that it might make sense to track (for example storage utilization for devices that do thin-provisioning in firmware and expose it), but they kind of require hardware to test against, which I'm pretty sure we don't have access to.
Ferroin
on 25 Oct 2018
it makes more sense to just group the SCSI attributes into the same categories they would be in if it were an ATA device
Then we need to add ATA/SCSI to every chart title or it will be a mess.
Let's take temperature for example
we have
- Airflow Temperature Celsius (ATA)
- Temperature Celsius (ATA)
- Temperature (SCSI)
ilyam8
on 25 Oct 2018
so we have 3 type of charts
- specific to ATA
- specific to SCSI
- common to both (SCSI temperature and ATA 194 Temperature should be in the same chart)
ilyam8
on 25 Oct 2018
so we have 3 type of charts
- specific to ATA
- specific to SCSI
- common to both (SCSI temperature and ATA 194 Temperature should be in the same chart)
OK, let me try this from a different angle: _Why_ do we need different charts for SCSI and ATA attributes given that no storage device can provide both simultaneously? The only configuration that comes close to causing issues with just sharing charts is SATA devices connected to a SAS HBA, but those will still provide ATA SMART attributes only (because the HBA is not involved at all in the data collection except as a transport component).
Ferroin
on 25 Oct 2018
Why do we need different charts for SCSI and ATA
How else?.
ATA has Soft Read Error Rate chart.
SCSI has Read, Write, Verify Error charts (or Uncorrected, Corrected depends on grouping).
We can't mix them, right?
All these charts under the errors family.
But both scsi and ata has on common chart - temperature.
ilyam8
on 25 Oct 2018
Or Soft Read Error Rate is the same as read-total-unc-errors ?
ilyam8
on 25 Oct 2018
Ah, OK, that's what I was misunderstanding. I forgot that the module does one chart per attribute. (which still seems odd to me, but that's kind of irrelevant since it's what people are used to at this point). Sorry about the confusion.
Ferroin
on 25 Oct 2018
@Ferroin can you provie a match table for SCSI - ATA attrs?
ATA 194 Temperature Celsius - SCSI temperature
What else?
ilyam8
on 25 Oct 2018
I forgot that the module does one chart per attribute
dimensions are disk names (super long names, we can't use them as families :cry: )
Can you suggest a better approach?
ilyam8
on 25 Oct 2018
@Ferroin can you provie a match table for SCSI - ATA attrs?
ATA 194 Temperature Celsius - SCSI temperature
What else?
As far as I know, there's nothing that maps properly except temperature. At least, none of the attributes reported by the device that @ScrumpyJack was kind enough to provide an attribute dump from appear to.
dimensions are disk names
Can you suggest a better approach?
The intuitive approach for me is to have one set of charts per disk/device, with each chart being a particular unit, and the dimension names being the attribute names. I wouldn't necessarily say that's any better than what we currently have though, both approaches have their own issues relating to scaling of the charts, and both produce a potentially very large number of charts. Given this, I think we should just keep the approach being used currently (people are used to it).
The only tricky point is the temperature chart. I do think it should be shared, but how to choose what to use for the ATA devices gets tricky. I'm of the opinion that we should probably use attribute 194 preferentially to attribute 190 and only expose one of them, as that's consistent with how tools like hddtemp work. It would also be really neat to support showing min/max temperature values for ATA devices by parsing the raw values, but that may make the chart really cluttered.
Ferroin
on 25 Oct 2018
The intuitive approach for me is to have one set of charts per disk/device, with each chart being a particular unit, and the dimension names being the attribute names.
Agree. It would simplify all.
The reason why it wasn't implemented in that way is long disk names (KINGSTON_SHFS37A120G-50026B7266003D93), we can't use them as families.
ilyam8
on 25 Oct 2018
Second reason is that it's hard to find the chart you need, when there is a lot of charts and all of them under the same family
ilyam8
on 25 Oct 2018
Titles are hard to read imo. (small font...)
ilyam8
on 25 Oct 2018
@gmosx What do you think about chart titles? is it only me or not? It's hard to scroll and read titles. They are not stand out, font is small.
ilyam8
on 25 Oct 2018
Given this, I think we should just keep the approach being used currently (people are used to it).
@Ferroin Not a big problem actually :smile: We have already changed approach (each attr family => group of attrs family).
If we find the way how to to have one set of charts per disk/device, it will be cool!
So the question is - how to handle long disk names, we need them for families...
ilyam8
on 25 Oct 2018
If we find the way how to to have one set of charts per disk/device, it will be cool!
Should be as simple as just defining the charts differently. Even if we do that though, we should let people choose that or the chart-per-attribute approach, as having a set per disk/device will translate in some cases to an absolutely insane number of charts (if I'm doing the math correctly, that would potentially be at least a dozen charts per device for most ATA devices).
So the question is - how to handle long disk names, we need them for families...
Regarding chart titles, it would be nice if they were a bit bigger. A different choice of font would probably help too. I've actually been running the dashboard with some minor CSS changes to override things to use a monospace font (I'm using Droid Sans Mono Dotted, which is my preferred font for almost everything these days) and the whole thing (not just chart families, but dimension names and even the chart descriptions) is much easier to read.
As far as disk names for chart names, we probably have to get a bit more involved than just borrowing the smartd names directly. My thought is to provide a way for the user to remap the disk names as they see fit, have a quick switch to display just the serial number (the part after the -, this is likely to be useful for people who actually track disk serial numbers, which is not unusual in enterprise scenarios (or among crazy people like myself)), and possibly a script to generate a mapping from the smartd device names to paths in /dev. Ideally, if we do that, we would also include the original smartd name in any alerts.
Ferroin
on 25 Oct 2018
On the chart per device or chart per attribute question, it's unclear what you've chosen.
Are you suggesting a default that can be changed?
Chart per device would mean potentially thousands of charts, and charts per attribute would mean unreadable charts 👀
ScrumpyJack
on 25 Oct 2018
Ok, good points @Ferroin better to stay with _devices as dimensions_ approach.
ilyam8
on 25 Oct 2018
Chart per device would mean potentially thousands of charts, and charts per attribute would mean unreadable charts
thousands of charts is no go, so we chose potentially unreadable charts
ilyam8
on 25 Oct 2018
charts per attribute, that's cool. we can narrow that down by device in grafana or something :)
ScrumpyJack
on 25 Oct 2018
wip
ilyam8
on 30 Oct 2018
@Ferroin
190;64;622592036; 194;36;3435973840
You suggested to use raw value. How to calc temperature then? :smile:
ilyam8
on 30 Oct 2018
See https://github.com/netdata/netdata/issues/4285#issuecomment-428556760 or check the ata_format_attr_raw_value() function in atacmds.cpp from the smartmontools sources (its around line 1922). I"m not sure whether the data is supposed to be LSB or MSB in either case.
You might also want to double check if smartctl actually parses the raw values for that device. Just having it list the attributes should be enough. If it does parse them, the value in the RAW_VALUE column of the output for that attribute will look something like this: 35 (Min/Max 17/44)
IMO, if we can parse the raw values we should (we give the user more info this way), but if not we should fall back to just exposing the normalized value (and don't forget, the normalized value is supposed to be 100 _minus_ the actual temperature).
Ferroin
on 30 Oct 2018
@gmosx What do you think about chart titles? is it only me or not? It's hard to scroll and read titles. They are not stand out, font is small.
Yes I agree, the dashboard needs aesthetic improvements. I am entertaining a hybrid approach: incremental improvements in the current dashboard, and an experimental 'dashboard2' sporting a more aggressive redesign. Nothing is set in stone though. Will have more visibility by the time of our meeting.
 gmosx
on 30 Oct 2018
gmosx
on 30 Oct 2018
and don't forget, the normalized value is supposed to be 100 minus the actual temperature
Not sure about that.
Take a look
hddtemp reports 35
[lgz ~]sudo hddtemp /dev/sda
/dev/sda: KINGSTON SHFS37A120G: 35°C
smartd log normalized value is 35
[lgz ~]tail -n 1 /var/log/smartd/KINGSTON_SHFS37A120G-50026B7266003D93.ata.csv | grep -E -o "194(;[0-9]+){2}"
194;35;42952491043
smartctl
[lgz ~]sudo smartctl -a /dev/sda | grep ^194
194 Temperature_Celsius     0x0022   035   043   000    Old_age   Always       -       35 (Min/Max 10/43)
Oh, 100 minus the actual temperature is true for 190, 194 should be reported as is (normalized)
To be honest i have no idea how decode 42952491043 to current/min/max. (if this is even possible)
ilyam8
on 31 Oct 2018
Power On Hours
[lgz ~]sudo smartctl -a /dev/sda | grep Power_On
  9 Power_On_Hours          0x0032   091   091   000    Old_age   Always       -       8692 (156 14 0)
[lgz ~]sudo smartctl -a /dev/sdb | grep Power_On
  9 Power_On_Hours          0x0032   085   085   000    Old_age   Always       -       13617
9;91;237786569384436
237786569384436 should be decoded too
ilyam8
on 31 Oct 2018
To be honest i have no idea how decode 42952491043 to current/min/max. (if this is even possible)
194 Temperature_Celsius 0x0022 034 043 000 Old_age Always - 34 (Min/Max 10/43)
The low byte is the current temperature, the third lowest is the maximum, and the fifth lowest is the minimum
figured out
>>> 42952491042 & 0xFF
34
>>> (42952491042 & 0xFF0000) >> 16
43
>>> (42952491042 & 0xFF00000000) >> 32
10
237786569384436 should be decoded too
two lower bytes
>>> 237786569384436 & 0xFFFF
8692
OK, it looks like smartd is already doing the parsing of the nromalized value in the logs for attribute 194.
As far as parsing the raw values, it's a case where you kind of need to attempt to decode each way and see what looks like it makes sense. It looks like the aforementioned code in smartmontools splits the value into bytes and words and does some comparisons based on those to check things. The actual parsing for temperature values starts around line 2051 in atacmdx.cpp.
Based on my understanding of that code (which may be wrong, I'm not great with C++), this python code should roughly reproduce the same results:
def check_temp_word(i):
    if i <= 0x7F:
        return 0x11
    elif i <= 0xFF:
        return 0x01
    elif 0xFF80 <= i:
        return 0x10
    return 0x00


def check_temp_range(t, b0, b1):
    if b0 > b1:
        t0 = b1
        t1 = b0
    else:
        t0 = b0
        t1 = b1
    if (-60 <= t0 and t0 <= t and t <= t1 and t1 <= 120 and not (t0 == -1 and t1 <= 0)):
        return (t0, t1)
    return (None, None)


def parse_temp(raw):
    byte = list()
    word = list()
    for i in range(0, 6):
        byte.append(0xFF & (raw >> (i * 8)))
    for i in range(0, 3):
        word.append(0xFFFF & (raw >> (i * 16)))

    ctwd = check_temp_word(word[0])

    if not word[2]:
        if (not word[1]) and ctwd:
            # byte[0] is temp, no other data
            return (byte[0], None, None, None)
        elif ctwd and all(check_temp_range(byte[0], byte[2], byte[3])):
            # byte[0] is temp, byte[2] is max or min, byte[3] is min or max
            trange = check_temp_range(byte[0], byte[2], byte[3])
            return (byte[0], trange[0], trange[1], None)
        elif ctwd and all(check_temp_range(byte[0], byte[1], byte[2])):
            # byte[0] is temp, byte[1] is max or min, byte[2] is min or max
            trange = check_temp_range(byte[0], byte[1], byte[2])
            return (byte[0], trange[0], trange[1], None)
        else:
            # No data
            return (None, None, None, None)
    elif ctwd:
        if (ctwd & check_temp_word(word[1]) & check_temp_word(word[2]) != 0x00) and \
           all(check_temp_range(byte[0], byte[2], byte[4])):
            # byte[0] is temp, byte[2] is max or min, byte[4] is min or max
            trange = check_temp_range(byte[0], byte[2], byte[4])
            return (byte[0], trange[0], trange[1], None)
        else:
            trange = check_temp_range(byte[0], byte[2], byte[3])
            if word[2] < 0x7FFF and all(trange) and trange[1] >= 40:
                # byte[0] is temp, byte[2] is max or min, byte[3] is min or max, word[2] is overtemp count
                return (byte[0], trange[0], trange[1], word[2])
    else:
        # No data
        return (None, None, None, None)
Calling parse_temp on the raw value will return a 4-tuple containing the temperature, minimum, maximum, and over-temperature count, substituting None for values it can't decode.
Ferroin
on 31 Oct 2018
@Ferroin great. but... have you checked if your code works? It has syntax errors, index errors, etc :smile:
ilyam8
on 31 Oct 2018
@l2isbad I was a bit more focused on getting the logic translated correctly than making sure it ran. Give me a couple of minutes and I'll clean it up.
Ferroin
on 31 Oct 2018
Updated it to fix the errors.
Ferroin
on 31 Oct 2018
34359738404 contains only current temperature
In [14]: parse_temp(34359738404)

In [15]: 34359738404 & 0xFF
Out[15]: 36
It looks like that's a case that isn't handled either by the smartmontools code I was looking at. I may also have just been looking in the wrong place though.
Ferroin
on 31 Oct 2018
smartctl shows 36 (0 8 0 0 0)
ilyam8
on 31 Oct 2018
OK, I think I see what's up then. I forgot to look at the code further down that's responsible for printing the value out. This case gets handled there instead of in the other decoding logic.
Ferroin
on 31 Oct 2018
@ScrumpyJack merged the fix
ilyam8
on 6 Nov 2018
very very cool.
building it now
ScrumpyJack
on 6 Nov 2018
Related issues
 startryst
·
56Comments
startryst
·
56Comments
 askd77
·
71Comments
askd77
·
71Comments
 thiagoftsm
·
55Comments
ktsaou
·
100Comments
thiagoftsm
·
55Comments
ktsaou
·
100Comments
 breed808
·
59Comments
breed808
·
59Comments
Most helpful comment
Updated, including adding a couple other attributes I've largely confirmed are consistent. I know of over a dozen more that aren't on the table, but they're so heavily vendor dependent as to whether they appear or not that I don't think we should track them.
Also, I just added the raw/normalized info to the type column, that seems to make the most sense.