Hello Daniel,
I'm grateful for seeing this project being developed, had an eye on it from April and It's looking great. Nice work !
First of I was able to do some nice things where in matplotlib it wouldn't have been so fast and so easy to do(e.g.)
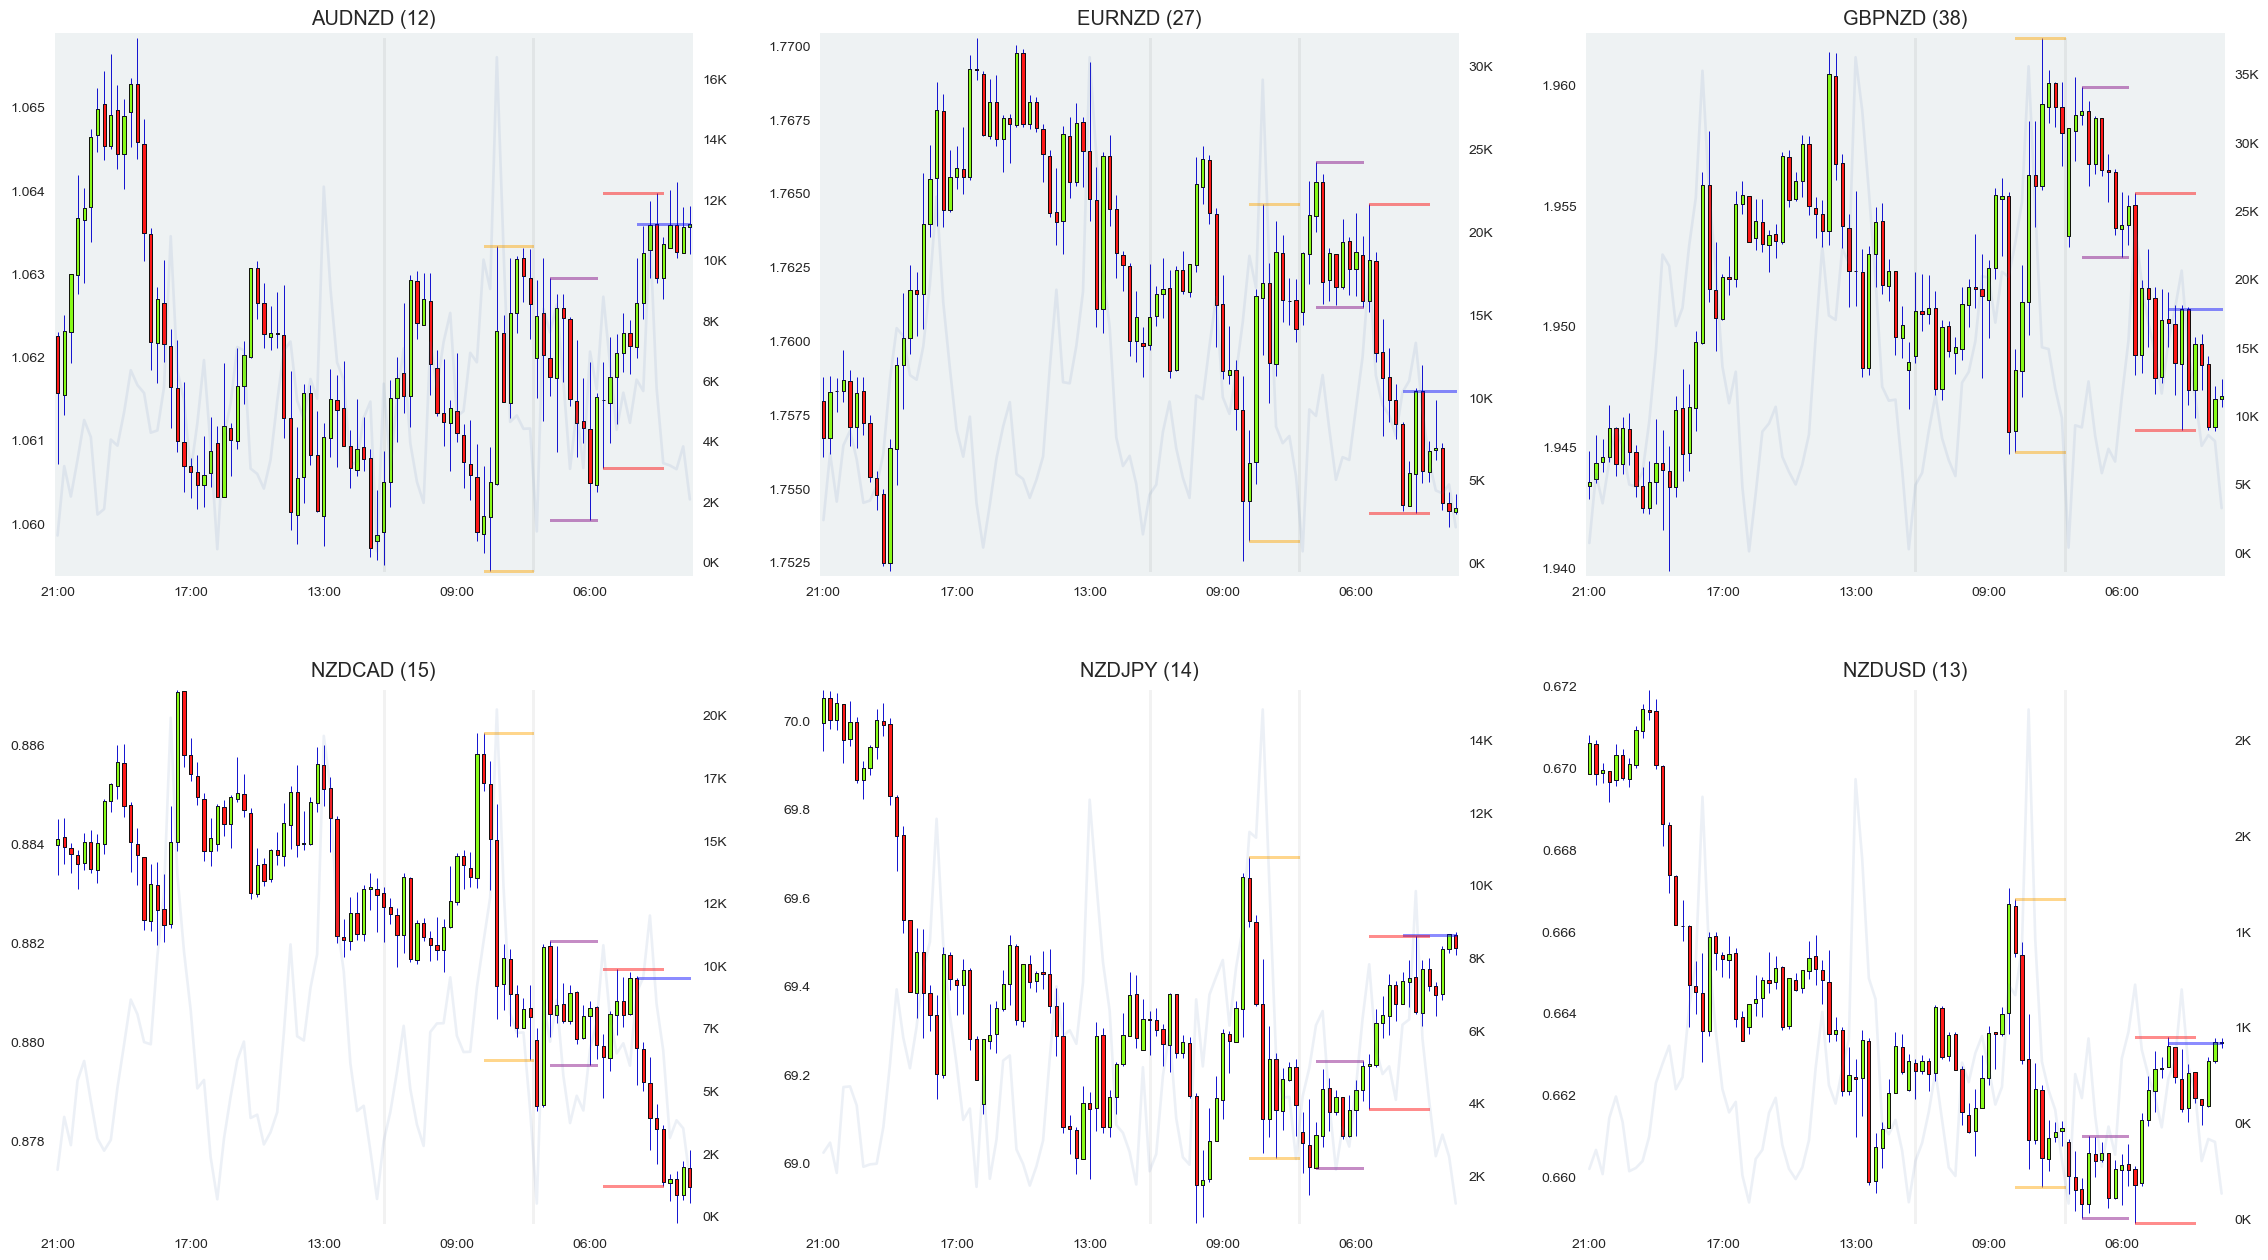
I have more questions, but they are mostly regarding chart ratio and trendlines.
Can i change the ratio of the chart ? For example I'd like to have 1 unit on Y axis to be equal with 10 days or 0.125 to be equal with 4.142 days ?
Moreover, can I get the value trendline values for each point based on the new ratio of the chart :
For example :
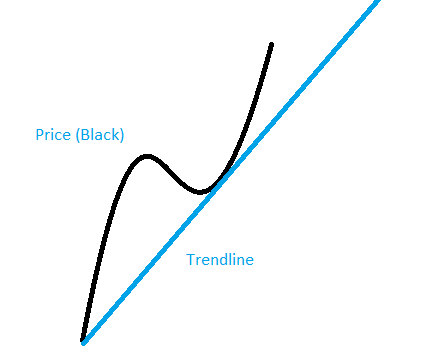
I'd be interested at a future point, when price will approach a trendline to calculate the exact price based on the scaled chart with my ratios. I know it's a mathematical formula for this, but I can't figure out how the variable of ratio has an impact.
2nd Question Based on this chart :
Let's say this is Default Ratio ( the chart is from Tradingview, and the trendline was made using "Trend Angle")
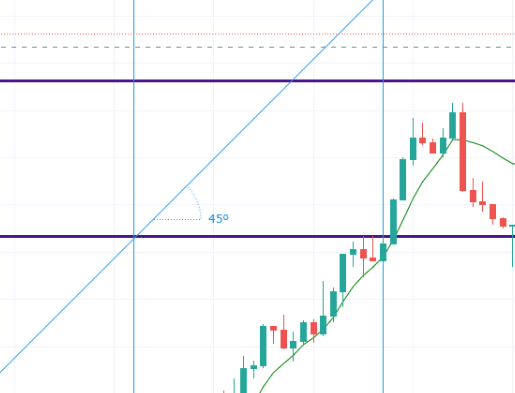
My next step is to change manually the chart ratio by modifying the X and Y scaling.
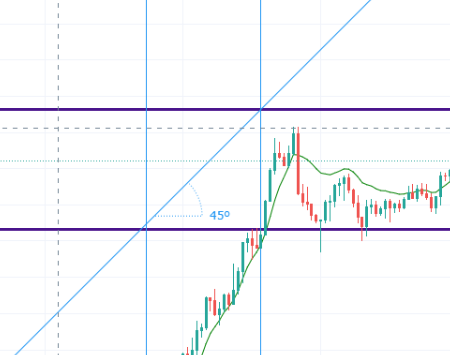
Can this be made in matplotlib using mplfinance? Do you know any sources I can look for in order to study maybe even find a formula.
I've looked also into figaspect, but I believe that the points of the trendline will be also scaled, so I'll have to modify them as well based on the scaling.
 nMihMo
All 6 comments
@NeaguMiha -- Thank you for sharing the plots that you made with mplfinance. I love to see the creative things people are doing with the package.
I am not sure I understand your questions. It is not clear to me whether you want to just change the shape of the chart, or whether you want to change the actual slope that would be calculated (in other words, scale either the X or Y data differently from your input data, in order to have a different ratio not just in terms of appearance, but in terms of the actual slope of a trend line that would be calculated. Or ... maybe you mean something different altogether and I am not understanding.
As another example, I do not understand what this means: "For example I'd like to have 1 unit on Y axis to be equal with 10 days" because there is no direct relationship between the Y axis and the X axis except either via the slope of the data itself, or through the relationship in terms of actual size on screen. Do you mean one of these two things? For example are you saying that if 1 unit of price takes up 1 cm on the screen for the Y axis, then you want 10 days on the X axis to also take up 1 cm on the screen??
Please clarify. Thank you.
 DanielGoldfarb
on 6 Nov 2020
DanielGoldfarb
on 6 Nov 2020
Thank you for responding,
"For example are you saying that if 1 unit of price takes up 1 cm on the screen for the Y axis, then you want 10 days on the X axis to also take up 1 cm on the screen??"
Yes, well the idea is that I want to calculate the angle for each line I draw, but If i change the 1 unit of price to take 0.8 cms on the screen for Y axis, _the angles should be recalculated for each line._ I can't find a solution here.
nMihMo
on 7 Nov 2020
@nMihMo - would you mind sharing your code on how you label the high and low pivots on your chart? I have identified pivot levels myself using the trendln package that I am now looking to add them as an overlay to these beautiful mplfinance candle charts, but the only option I see for overlays are ie moving averages passed as an argument in mpf.plot() @DanielGoldfarb
 tsferro2
on 19 Nov 2020
tsferro2
on 19 Nov 2020
@tsferro2
Tucker, Other options for overlays that may be of use for you are
tlines-- trend lines, see tutorial here: using lines, andmake_addplot()-- see tutorial here: addplot.
DanielGoldfarb
on 19 Nov 2020
@nMihMo
Sorry for not responding sooner to your latest comment.
I'm not sure I understand why you would want to calculate a trend line angle in terms of the angle as it appears on the screen because, as you point out, a different scaling of the data will result in a different angle on the screen (45 degrees versus some other amount).
It seems to me that in any mathematical determination of trend amounts (especially if intending to use those numbers in any type of a trading strategy) the trend numbers should be normalized to express trend in terms of either percent price change per unit time, or return on investment per unit time, or some other normalized value that is not affected by the current value of the investment, and certainly not affected by ratio or resolution of your display.
It seems to me that adjusting angles so that 1 unit change in price should correspond a certain number of days is affected by both the current value of your investment and the ratio of your plot display. And even if you adjust the plot so that a single unit price change always corresponds to a certain amount of time, this certainly it cannot be applied equally to all investments, because a single unit price change is far more meaningful for a stock such as Pfizer, whose current price is approximately $36 per share, that it is for say, Amazon, whose current price is more than of $3100 per share.
Please let me know if I am missing something, or if this my explanation is not clear.
All the best. --Daniel
DanielGoldfarb
on 19 Nov 2020
Thank you very much for your response and your time, I'll do some research this week.
nMihMo
on 24 Nov 2020
Related issues
 obahat
·
3Comments
obahat
·
3Comments
 toksis
·
5Comments
toksis
·
5Comments
 ismailbayram
·
4Comments
ismailbayram
·
4Comments
 leochan007
·
6Comments
leochan007
·
6Comments
 ghost355
·
5Comments
ghost355
·
5Comments